|
|
市場調査レポート
商品コード
1354724
企業資産管理 (EAM):各種用途と世界市場Enterprise Asset Management: Applications and Global Markets |
||||||
|
|
|||||||
|
|||||||


| 企業資産管理 (EAM):各種用途と世界市場 |
|
出版日: 2023年09月28日
発行: BCC Research
ページ情報: 英文 240 Pages
納期: 即納可能
|

- 全表示
- 概要
- 図表
- 目次
世界の企業資産管理 (EAM) の市場規模は、2023年の54億米ドルから、予測期間中は13.0%のCAGRで推移し、2028年には100億米ドルの規模に成長すると予測されています。
地域別では、北米市場が2023年の20億米ドルから、13.4%のCAGRで推移し、2028年には38億米ドルの規模に成長すると予測されています。また、欧州市場は、2023年の17億米ドルから、11.3%のCAGRで推移し、2028年には29億米ドルの規模に成長すると予測されています。
当レポートでは、世界の企業資産管理 (EAM) の市場を調査し、市場および技術の概要、市場影響因子の分析、法規制環境、市場規模の推移・予測、各種区分・地域別の詳細分析、技術および特許の動向、ESGの展開、競合情勢、主要企業のプロファイルなどをまとめています。
目次
第1章 イントロダクション
第2章 サマリー・ハイライト
- 市場の見通し
- 市場概要
第3章 市場概要
- 事業におけるEAMの重要性
- EAMソリューションの作業プロセス
- EAMの利点
- EAMの用途と産業
- EAMの主な機能
- バリューチェーン分析
- ポーターのファイブフォース分析
- PESTLE分析
- COVID-19が世界のEAM市場に与える影響
- ロシア・ウクライナ戦争が世界のEAM市場に与える影響
第4章 市場力学
- 概要
- 市場促進要因
- 市場抑制要因
- 現在の市場動向
- 市場機会
第5章 市場内訳:セグメント別
- 概要
- ソフトウェア
- サービス
第6章 市場内訳:資産タイプ別
- 概要
- 生産設備
- 線形資産
- 設備
- フリート
- その他
第7章 市場内訳:展開別
- 概要
- オンプレミス
- クラウド
第8章 市場内訳:組織規模別
- 概要
- 大企業
- 中小企業
第9章 市場内訳:エンドユーザー産業別
- 概要
- 石油・ガス
- 機械製造
- 航空宇宙・防衛
- エネルギー・電力
- 金属・鉱業
- 小売
- 自動車
- 政府施設
- その他
第10章 市場内訳:地域別
- 概要
- 北米
- 米国
- カナダ
- メキシコ
- 欧州
- ドイツ
- フランス
- イタリア
- スペイン
- その他の欧州
- アジア太平洋
- 中国
- インド
- 日本
- オーストラリア
- 韓国
- その他のアジア太平洋地域
- 世界のその他の地域
- 中東・アフリカ
- 南米
第11章 ESGの展開
- 概要
- ESG目標達成におけるEAMの役割
- 持続可能性の向上におけるEAMの役割
- ネットゼロ目標への取り組みにおけるEAMの役割
- デジタル化とESG変革
- EAMはESGをサポートします
- ケーススタディ:ESG導入の成功例
- BCCによる総論
第12章 新たな技術と開発
- 技術概要
- EAMの技術動向
第13章 特許分析
第14章 M&A・資金調達の見通し
- M&A分析
- ベンチャーキャピタル
第15章 競合情報
- 概要
- 市場シェア分析
- 戦略的分析
- 製品の発売
- 提携
- M&A
- 製品マッピング分析
- 製品マッピング分析:導入モデル別
第16章 企業プロファイル
- 概要
- ABB LTD.
- ACCRUENT
- APTEAN
- ASSETWORKS INC.
- AVEVA GROUP PLC
- CGI INC.
- EMAINT ENTERPRISES LLC
- HEXAGON AB
- IFS
- IBM CORP.
- IPS INTELLIGENT PROCESS SOLUTIONS GMBH
- ORACLE CORP.
- RFGEN SOFTWARE
- SAP SE
- SSG INSIGHT LTD.
- UPKEEP TECHNOLOGIES INC.
第17章 付録:頭字語
List of Tables
- Summary Table : Global Market for Enterprise Asset Management, by Region, Through 2028
- Table 1 : Global Market for Enterprise Asset Management, by Segment, Through 2028
- Table 2 : Global Market for Enterprise Asset Management Software, by Region, Through 2028
- Table 3 : Global Market for Enterprise Asset Management Services, by Region, Through 2028
- Table 4 : Global Market for Enterprise Asset Management, by Asset Type, Through 2028
- Table 5 : Global Market for Enterprise Asset Management of Production Equipment, by Region, Through 2028
- Table 6 : Global Market for Enterprise Asset Management of Linear Assets, by Region, Through 2028
- Table 7 : Global Market for Enterprise Asset Management of Facilities, by Region, Through 2028
- Table 8 : Global Market for Enterprise Asset Management of Fleet, by Region, Through 2028
- Table 9 : Global Market for Enterprise Asset Management of Others, by Region, Through 2028
- Table 10 : Comparison of On-premise vs. Cloud EAM Solutions
- Table 11 : Global Market for Enterprise Asset Management, by Deployment, Through 2028
- Table 12 : Global Market for On-premise Deployment of EAM Solutions, by Region, Through 2028
- Table 13 : Global Market for Cloud Deployment of EAM Solutions, by Region, Through 2028
- Table 14 : Global Market for Enterprise Asset Management, by Organization Size, Through 2028
- Table 15 : Global Market for Enterprise Asset Management of Large Enterprises, by Region, Through 2028
- Table 16 : Global Market for Enterprise Asset Management of Small and Medium Enterprises, by Region, Through 2028
- Table 17 : Global Market for Enterprise Asset Management, by End-Use Industry, Through 2028
- Table 18 : Global Market for Enterprise Asset Management of Oil and Gas, by Region, Through 2028
- Table 19 : Global Market for Enterprise Asset Management of Machinery Manufacturing, by Region, Through 2028
- Table 20 : Global Market for Enterprise Asset Management of Aerospace and Defense, by Region, Through 2028
- Table 21 : Global Market for Enterprise Asset Management of Energy and Power, by Region, Through 2028
- Table 22 : Global Market for Enterprise Asset Management of Metal and Mining, by Region, Through 2028
- Table 23 : Global Market for Enterprise Asset Management of Retail, by Region, Through 2028
- Table 24 : Global Market for Enterprise Asset Management of Automotive, by Region, Through 2028
- Table 25 : Global Market for Enterprise Asset Management of Government Facilities, by Region, Through 2028
- Table 26 : Global Market for Enterprise Asset Management of Others, by Region, Through 2028
- Table 27 : Global Market for Enterprise Asset Management, by Region, Through 2028
- Table 28 : North American Market for Enterprise Asset Management, by Country, Through 2028
- Table 29 : North American Market for Enterprise Asset Management, by Segment, Through 2028
- Table 30 : North American Market for Enterprise Asset Management, by Asset Type, Through 2028
- Table 31 : North American Market for Enterprise Asset Management, by Deployment, Through 2028
- Table 32 : North American Market for Enterprise Asset Management, by Organization Size, Through 2028
- Table 33 : North American Market for Enterprise Asset Management, by End-Use Industry, Through 2028
- Table 34 : European Market for Enterprise Asset Management, by Country, Through 2028
- Table 35 : European Market for Enterprise Asset Management, by Segment, Through 2028
- Table 36 : European Market for Enterprise Asset Management, by Asset Type, Through 2028
- Table 37 : European Market for Enterprise Asset Management, by Deployment, Through 2028
- Table 38 : European Market for Enterprise Asset Management, by Organization Size, Through 2028
- Table 39 : European Market for Enterprise Asset Management, by End-Use Industry, Through 2028
- Table 40 : Asia-Pacific Market for Enterprise Asset Management, by Country, Through 2028
- Table 41 : Asia-Pacific Market for Enterprise Asset Management, by Segment, Through 2028
- Table 42 : Asia-Pacific Market for Enterprise Asset Management, by Asset Type, Through 2028
- Table 43 : Asia-Pacific Market for Enterprise Asset Management, by Deployment, Through 2028
- Table 44 : Asia-Pacific Market for Enterprise Asset Management, by Organization Size, Through 2028
- Table 45 : Asia-Pacific Market for Enterprise Asset Management, by End-Use Industry, Through 2028
- Table 46 : Rest of the World Market for Enterprise Asset Management, by Subregion, Through 2028
- Table 47 : Rest of the World Market for Enterprise Asset Management, by Segment, Through 2028
- Table 48 : Rest of the World Market for Enterprise Asset Management, by Asset Type, Through 2028
- Table 49 : Rest of the World Market for Enterprise Asset Management, by Deployment, Through 2028
- Table 50 : Rest of the World Market for Enterprise Asset Management, by Organization Size, Through 2028
- Table 51 : Rest of the World Market for Enterprise Asset Management, by End-Use Industry, Through 2028
- Table 52 : Current Status of ESG in the Global Market for Enterprise Asset Management Among Some Major Players
- Table 53 : Patents Published on Enterprise Asset Management, January 2021-December 2022
- Table 54 : Number of Patents Published on Enterprise Asset Management, by Top 5 Companies, 2022
- Table 55 : M&A Deals in Global Market for Enterprise Asset Management, 2021-2022
- Table 56 : Venture Capital in the Global Market for Enterprise Asset Management, 2021-2023
- Table 57 : Product Mapping Analysis of Top Companies in the Global Market for Enterprise Asset Management, by Deployment Model
- Table 58 : ABB Ltd.: Financial Overview, 2020-2022
- Table 59 : ABB Ltd.: News/Key Developments, 2021-2022
- Table 60 : ABB Ltd.: Product Offering
- Table 61 : Accruent: News/Key Developments, 2021-2023
- Table 62 : Accruent: Product Offering
- Table 63 : Aptean: News/Key Developments, 2022-2023
- Table 64 : Aptean: Product Offering
- Table 65 : AssetWorks Inc.: Product Offering
- Table 66 : AVEVA Group Plc: Financial Overview, 2020-2022
- Table 67 : AVEVA Group Plc: Product Offering
- Table 68 : CGI Inc.: Financial Overview, 2020-2022
- Table 69 : CGI Inc.: Product Offering
- Table 70 : eMaint Enterprises LLC: Product Offering
- Table 71 : Hexagon AB: Financial Overview, 2020-2022
- Table 72 : Hexagon AB: News/Key Developments, 2021-2022
- Table 73 : Hexagon AB: Product Offering
- Table 74 : IFS AB: Financial Overview, 2020-2022
- Table 75 : IFS AB: News/Key Developments, 2022-2023
- Table 76 : IFS AB: Product Offering
- Table 77 : IBM Corp.: Financial Overview, 2020-2022
- Table 78 : IBM Corp.: News/Key Developments, 2022
- Table 79 : IBM Corp.: Product Offering
- Table 80 : IPS Intelligent Process Solutions GmbH: News/Key Developments, 2021-2022
- Table 81 : IPS Intelligent Process Solutions GmbH: Product Offering
- Table 82 : Oracle Corp.: Financial Overview, 2020-2022
- Table 83 : Oracle Corp.: Product Offering
- Table 84 : RFgen Software: Product Offering
- Table 85 : SAP SE: Financial Overview, 2020-2022
- Table 86 : SAP SE: News/Key Developments, 2021-2022
- Table 87 : SAP SE: Product Offering
- Table 88 : SSG Insight Ltd.: Product Offering
- Table 89 : UpKeep Technologies Inc.: Product Offering
- Table 90 : Acronyms and Abbreviations Used in This Report
List of Figures
- Summary Figure : Global Market Shares of Enterprise Asset Management, by Region, 2022
- Figure 1 : Importance of EAM in Businesses
- Figure 2 : Process for EAM System
- Figure 3 : Benefits of EAM
- Figure 4 : EAM Application and Industries
- Figure 5 : Key Functions of EAM
- Figure 6 : Value Chain Analysis of the Global Market for Enterprise Asset Management
- Figure 7 : Porter's Five Forces Model for the Global Market for Enterprise Asset Management
- Figure 8 : PESTLE Analysis for the Global Market for Enterprise Asset Management
- Figure 9 : Global Market Dynamics for Enterprise Asset Management Systems
- Figure 10 : Process Flow of IoT-Based Asset Monitoring Solution
- Figure 11 : Benefits of IoT in Asset Management and Monitoring
- Figure 12 : Advantages of SaaS-Based Asset Management
- Figure 13 : Restraints for Global Market for Enterprise Asset Management
- Figure 14 : Current Trends in the Global Market
- Figure 15 : Market Opportunities in the Global Market for Enterprise Asset Management
- Figure 16 : Global Market Shares of Enterprise Asset Management, by Segment, 2022
- Figure 17 : Global Market Shares of Enterprise Asset Management, by Segment, 2028
- Figure 18 : Global Market Shares of Enterprise Asset Management Software, by Region, 2022
- Figure 19 : Global Market Shares of Enterprise Asset Management Software, by Region, 2028
- Figure 20 : Global Market Shares of Enterprise Asset Management Services, by Region, 2022
- Figure 21 : Global Market Shares of Enterprise Asset Management Services, by Region, 2028
- Figure 22 : Global Market Shares of Enterprise Asset Management, by Asset Type, 2022
- Figure 23 : Global Market Shares of Enterprise Asset Management, by Asset Type, 2028
- Figure 24 : Global Market Shares of Enterprise Asset Management of Production Equipment, by Region, 2022
- Figure 25 : Global Market Shares of Enterprise Asset Management of Production Equipment, by Region, 2028
- Figure 26 : Global Market Shares of Enterprise Asset Management of Linear Assets, by Region, 2022
- Figure 27 : Global Market Shares of Enterprise Asset Management of Linear Assets, by Region, 2028
- Figure 28 : Global Market Shares of Enterprise Asset Management of Facilities, by Region, 2022
- Figure 29 : Global Market Shares of Enterprise Asset Management of Facilities, by Region, 2028
- Figure 30 : Global Market Shares of Enterprise Asset Management of Fleet, by Region, 2022
- Figure 31 : Global Market Shares of Enterprise Asset Management of Fleet, by Region, 2028
- Figure 32 : Global Market Shares of Enterprise Asset Management of Others, by Region, 2022
- Figure 33 : Global Market Shares of Enterprise Asset Management of Others, by Region, 2028
- Figure 34 : Global Market Shares of Enterprise Asset Management, by Deployment, 2022
- Figure 35 : Global Market Shares of Enterprise Asset Management, by Deployment, 2028
- Figure 36 : Global Market Shares of On-premise Deployment of Enterprise Asset Management, by Region, 2022
- Figure 37 : Global Market Shares of On-premise Deployment of Enterprise Asset Management, by Region, 2028
- Figure 38 : Global Market Shares of Cloud Deployment of Enterprise Asset Management, by Region, 2022
- Figure 39 : Global Market Shares of Cloud Deployment of Enterprise Asset Management, by Region, 2028
- Figure 40 : Global Market Shares of Enterprise Asset Management, by Organization Size, 2022
- Figure 41 : Global Market Shares of Enterprise Asset Management, by Organization Size, 2028
- Figure 42 : Global Market Shares of Enterprise Asset Management of Large Enterprises, by Region, 2022
- Figure 43 : Global Market Shares of Enterprise Asset Management of Large Enterprises, by Region, 2028
- Figure 44 : Global Market Shares of Enterprise Asset Management of Small and Medium Enterprises, by Region, 2022
- Figure 45 : Global Market Shares of Enterprise Asset Management of Small and Medium Enterprises, by Region, 2028
- Figure 46 : Global Market Shares of Enterprise Asset Management, by End-Use Industry, 2022
- Figure 47 : Global Market Shares of Enterprise Asset Management, by End-Use Industry, 2028
- Figure 48 : Global Market Shares of Enterprise Asset Management of Oil and Gas, by Region, 2022
- Figure 49 : Global Market Shares of Enterprise Asset Management of Oil and Gas, by Region, 2028
- Figure 50 : Global Market Shares of Enterprise Asset Management of Machinery Manufacturing, by Region, 2022
- Figure 51 : Global Market Shares of Enterprise Asset Management of Machinery Manufacturing, by Region, 2028
- Figure 52 : Global Market Shares of Enterprise Asset Management of Aerospace and Defense, by Region, 2022
- Figure 53 : Global Market Shares of Enterprise Asset Management of Aerospace and Defense, by Region 2028
- Figure 54 : Global Market Shares of Enterprise Asset Management of Energy and Power, by Region, 2022
- Figure 55 : Global Market Shares of Enterprise Asset Management of Energy and Power, by Region, 2028
- Figure 56 : Global Market Shares of Enterprise Asset Management of Metal and Mining, by Region, 2022
- Figure 57 : Global Market Shares of Enterprise Asset Management of Metal and Mining, by Region, 2028
- Figure 58 : Global Market Shares of Enterprise Asset Management of Retail, by Region, 2022
- Figure 59 : Global Market Shares of Enterprise Asset Management of Retail, by Region, 2028
- Figure 60 : Global Market Shares of Enterprise Asset Management of Automotive, by Region, 2022
- Figure 61 : Global Market Shares of Enterprise Asset Management of Automotive, by Region 2028
- Figure 62 : Global Market Shares of Enterprise Asset Management of Government Facilities, by Region, 2022
- Figure 63 : Global Market Shares of Enterprise Asset Management of Government Facilities, by Region, 2028
- Figure 64 : Global Market Shares of Enterprise Asset Management of Others, by Region, 2022
- Figure 65 : Global Market Shares of Enterprise Asset Management of Others, by Region, 2028
- Figure 66 : Global Market Shares of Enterprise Asset Management, by Region, 2022
- Figure 67 : Global Market Shares of Enterprise Asset Management, by Region, 2028
- Figure 68 : North American Market Shares of Enterprise Asset Management, by Country, 2022
- Figure 69 : North American Market Shares of Enterprise Asset Management, by Country, 2028
- Figure 70 : North American Market Shares of Enterprise Asset Management, by Segment, 2022
- Figure 71 : North American Market Shares of Enterprise Asset Management, by Segment, 2028
- Figure 72 : North American Market Shares of Enterprise Asset Management, by Asset Type, 2022
- Figure 73 : North American Market Shares of Enterprise Asset Management, by Asset Type, 2028
- Figure 74 : North American Market Shares of Enterprise Asset Management, by Deployment, 2022
- Figure 75 : North American Market Shares of Enterprise Asset Management, by Deployment, 2028
- Figure 76 : North American Market Shares of Enterprise Asset Management, by Organization Size, 2022
- Figure 77 : North American Market Shares of Enterprise Asset Management, by Organization Size, 2028
- Figure 78 : North American Market Shares of Enterprise Asset Management, by End-Use Industry, 2022
- Figure 79 : North American Market Shares of Enterprise Asset Management, by End-Use Industry, 2028
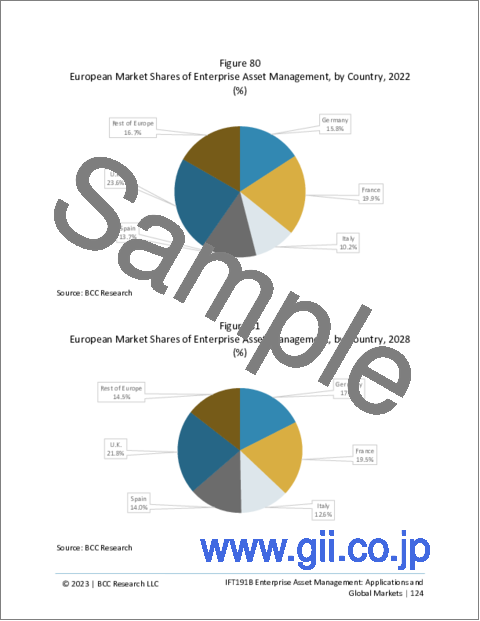
- Figure 80 : European Market Shares of Enterprise Asset Management, by Country, 2022
- Figure 81 : European Market Shares of Enterprise Asset Management, by Country, 2028
- Figure 82 : European Market Shares of Enterprise Asset Management, by Segment, 2022
- Figure 83 : European Market Shares of Enterprise Asset Management, by Segment, 2028
- Figure 84 : European Market Shares of Enterprise Asset Management, by Asset Type, 2022
- Figure 85 : European Market Shares of Enterprise Asset Management, by Asset Type, 2028
- Figure 86 : European Market Shares of Enterprise Asset Management, by Deployment, 2022
- Figure 87 : European Market Shares of Enterprise Asset Management, by Deployment, 2028
- Figure 88 : European Market Shares of Enterprise Asset Management, by Organization Size, 2022
- Figure 89 : European Market Shares of Enterprise Asset Management, by Organization Size, 2028
- Figure 90 : European Market Shares of Enterprise Asset Management, by End-Use Industry, 2022
- Figure 91 : European Market Shares of Enterprise Asset Management, by End-Use Industry, 2028
- Figure 92 : Asia-Pacific Market Shares of Enterprise Asset Management, by Country, 2022
- Figure 93 : Asia-Pacific Market Shares of Enterprise Asset Management, by Country, 2028
- Figure 94 : Asia-Pacific Market Shares of Enterprise Asset Management, by Segment, 2022
- Figure 95 : Asia-Pacific Market Shares of Enterprise Asset Management, by Segment, 2028
- Figure 96 : Asia-Pacific Market Shares of Enterprise Asset Management, by Asset Type, 2022
- Figure 97 : Asia-Pacific Market Shares of Enterprise Asset Management, by Asset Type, 2028
- Figure 98 : Asia-Pacific Market Shares of Enterprise Asset Management, by Deployment, 2022
- Figure 99 : Asia-Pacific Market Shares of Enterprise Asset Management, by Deployment, 2028
- Figure 100 : Asia-Pacific Market Shares of Enterprise Asset Management, by Organization Size, 2022
- Figure 101 : Asia-Pacific Market Shares of Enterprise Asset Management, by Organization Size, 2028
- Figure 102 : Asia-Pacific Market Shares of Enterprise Asset Management, by End-Use Industry, 2022
- Figure 103 : Asia-Pacific Market Shares of Enterprise Asset Management, by End-Use Industry, 2028
- Figure 104 : Rest of the World Market Shares of Enterprise Asset Management, by Subregion, 2022
- Figure 105 : Rest of the World Market Shares of Enterprise Asset Management, by Subregion, 2028
- Figure 106 : Rest of the World Market Shares of Enterprise Asset Management, by Segment, 2022
- Figure 107 : Rest of the World Market Shares of Enterprise Asset Management, by Segment, 2028
- Figure 108 : Rest of World Market Shares of Enterprise Asset Management, by Asset Type, 2022
- Figure 109 : Rest of the World Market Shares of Enterprise Asset Management, by Asset Type, 2028
- Figure 110 : Rest of the World Market Shares of Enterprise Asset Management, by Deployment, 2022
- Figure 111 : Rest of the World Market Shares of Enterprise Asset Management, by Deployment, 2028
- Figure 112 : Rest of the World Market Shares of Enterprise Asset Management, by Organization Size, 2022
- Figure 113 : Rest of the World Market Shares of Enterprise Asset Management, by Organization Size, 2028
- Figure 114 : Rest of the World Market Shares of Enterprise Asset Management, by End-Use Industry, 2022
- Figure 115 : Rest of the World Market Shares of Enterprise Asset Management, by End-Use Industry, 2028
- Figure 116 : EAM Helps Companies Improve Sustainability and Execute Their ESG Strategy
- Figure 117 : EAM Helps Address Net-Zero Targets
- Figure 118 : Twin Transition Accelerates Adoption of ESG
- Figure 119 : Advanced Technologies for Asset Management
- Figure 120 : Benefits of Cloud-Based Asset Management System
- Figure 121 : Benefits of Blockchain in Enterprise Asset Management Systems
- Figure 122 : Benefits of IoT in Enterprise Asset Management
- Figure 123 : IoT-Based Enterprise Asset Management Trends
- Figure 124 : Share of Patents Published on Enterprise Asset Management, by Assignee Country, 2021
- Figure 125 : Share of Patents Published on Enterprise Asset Management, by Assignee Country, 2022
- Figure 126 : M&A in the Global Market for Enterprise Asset Management, by Deal Value, 2021-2022
- Figure 127 : Share of M&A Deals in the Global Market for Enterprise Asset Management, by Region, 2021-2022
- Figure 128 : Venture Capital in the Global Market for Enterprise Asset Management, by Revenue Growth, 2021-2023
- Figure 129 : Share of Venture Capital in the Global Market for Enterprise Asset Management, by Various Rounds, 2021-2023
- Figure 130 : Shares of Top Players in the Global Market for Enterprise Asset Management, 2022
- Figure 131 : Shares of the Top Players in the Global Market for Enterprise Asset Management, by Strategic Analysis, 2022
- Figure 132 : ABB Ltd.: Annual Revenue, 2020-2022
- Figure 133 : ABB Ltd.: Revenue Share, by Business Segment, 2022
- Figure 134 : ABB Ltd.: Revenue Share, by Region, 2022
- Figure 135 : Aveva Group Plc: Annual Revenue, 2020-2022
- Figure 136 : CGI Inc.: Annual Revenue, 2020-2022
- Figure 137 : CGI Inc.: Revenue Share, by Business Segment, 2022
- Figure 138 : CGI Inc.: Revenue Share, by Region/Country, 2022
- Figure 139 : Hexagon AB: Annual Revenue, 2020-2022
- Figure 140 : Hexagon AB: Revenue Share, by Business Segment, 2022
- Figure 141 : Hexagon AB: Revenue Share, by Region, 2022
- Figure 142 : IFS AB: Annual Revenue, 2020-2022
- Figure 143 : IBM Corp.: Annual Revenue, 2020-2022
- Figure 144 : IBM Corp.: Revenue Share, by Business Segment, 2022
- Figure 145 : IBM Corp.: Revenue Share, by Region, 2022
- Figure 146 : Oracle Corp.: Annual Revenue, 2020-2022
- Figure 147 : Oracle Corp.: Revenue Share, by Business Segment, 2022
- Figure 148 : Oracle Corp.: Revenue Share, by Region, 2022
- Figure 149 : SAP SE: Annual Revenue, 2020-2022
- Figure 150 : SAP SE: Revenue Share, by Business Segment, 2022
- Figure 151 : SAP SE: Revenue Share, by Region, 2022
Highlights:
The global market for enterprise asset management is estimated to increase from $5.4 billion in 2023 to reach $10.0 billion by 2028, at a compound annual growth rate (CAGR) of 13.0% from 2023 through 2028.
North American market for enterprise asset management is estimated to increase from $2.0 billion in 2023 to reach $3.8 billion by 2028, at a compound annual growth rate (CAGR) of 13.4% from 2023 through 2028.
European market for enterprise asset management is estimated to increase from $1.7 billion in 2023 to reach $2.9 billion by 2028, at a compound annual growth rate (CAGR) of 11.3% from 2023 through 2028.
Report Scope:
This report analyzes a variety of developing technologies and their feasibility at present. The report covers various segments of the enterprise asset management market, breaking it down by component, asset type, network type, deployment, organization size, end users and region. Furthermore, it also sub-segmented the regional market analysis by major countries, such as the U.S., China, Germany, India, and others, where the opportunities for advanced technologies are lucrative. The report also includes ESG developments, coverage of emerging technologies and a survey of EAM-related patents published in past few years.
The study was prepared in a simple, easy-to-understand format; tables and figures are included to illustrate historical, current, and future market scenarios. The report also covers leading companies by providing information on product types, business footprints, revenue, etc. BCC Research has also included a list of other relevant companies in various global and regional markets. Also, the report features a patent analysis of the enterprise asset management market, which represents a significant investment area for investors.
The report incorporates the impact of the COVID-19 pandemic and the Russia-Ukraine war on the global and regional markets.
In this report, 2022 is used as the market's base year; estimated values are provided for 2023; and the market values are forecast from 2023 to 2028. All market values are provided in $ millions, and market shares and CAGRs are provided in percentages.
Report Includes:
- 65 data tables and 26 additional tables
- An overview and analysis of the global market for enterprise asset management (EAM) systems and their current and future commercial applications
- Analyses of the global market trends, with historical market revenue data (sales figures) for 2022, estimates for 2023, forecasts for 2024, 2026, and projections of compound annual growth rates (CAGRs) through 2028
- Estimate of the actual market size and revenue forecast for the global EAM market in USD millions, and a corresponding market share analysis based on component, asset type, deployment, size of enterprise, end-use industry, and region.
- In-depth information (facts and figures) pertaining to the major factors influencing the market with respect to specific growth trends, upcoming technologies, future prospects and contributions to the overall market
- Analysis of market growth opportunities with a holistic review of Porter's Five Forces and PESTLE analyses considering the micro- and macroeconomic factors prevailing in the market
- Review of the impacts of COVID-19 and the Russia-Ukraine war on the global and regional markets for EAM systems and applications
- Review of key patent grants and recent patent applications related to EAM, with emphasis on emerging technologies and upcoming developments
- Updates on recent mergers and acquisitions (M&A) activity, venture fundings, and other growth strategies from EAM vendors
- Identifying the key players in the market, and analysis of the competitive landscape based on recent developments, segmental revenues and operational integration
- Profiles of the leading global players, including ABB Ltd., Hexagon AB, IBM Corp., SAP SE, Oracle Corp., and IPS Intelligent Process Solutions GmbH
Table of Contents
Chapter 1 Introduction
- Overview
- Study Goals and Objectives
- Reasons for Doing This Study
- Scope of Report
- What's New in this Update?
- Research Methodology
- Research Steps
- Information Sources
- Geographic Breakdown
Chapter 2 Summary and Highlights
- Market Outlook
- Market Summary
Chapter 3 Market Overview
- Introduction
- Importance of EAM in Businesses
- Working Process of EAM Solution
- Benefits of EAM
- EAM Application and Industries
- Key Functions of EAM
- Value Chain Analysis for the Global Market for Enterprise Asset Management
- Porter's Five Forces Analysis
- Bargaining Power of Suppliers
- Bargaining Power of Buyers
- The Threat of New Entrants
- Threat of Substitutes
- Competitive Rivalry
- PESTLE Analysis
- Impact of COVID-19 on the Global Market for Enterprise Asset Management
- Impact of Russia-Ukraine War on the Global Market for Enterprise Asset Management
Chapter 4 Market Dynamics
- Overview
- Market Drivers
- Increasing Usage of IoT Platforms and Devices to Manage Enterprise Assets
- Convergence of Technologies such as AI, IoT and Analytics
- Growing Popularity of SaaS-Based EAM Solutions
- Demand for Effective Management of Enterprise Resources
- Strategic Shift in Enterprises from Reactive to Predictive Approach
- Aging Infrastructure
- Market Restraints
- High Cost of EAM Solution
- Cybersecurity Risk
- Current Market Trends
- The Ongoing Trend for Integrating EAM with Big Data
- Increased Focus on Proactive Maintenance Practices
- Market Opportunities
- Growing Initiatives to Extend the Life Span of the Asset Using Advanced Technologies
- Increasing Trend for Deploying Cloud-Based EAM Solutions
Chapter 5 Market Breakdown by Segment
- Overview
- Software
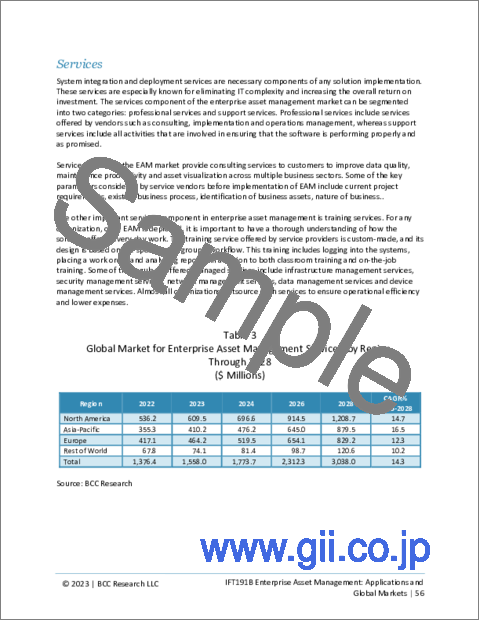
- Services
Chapter 6 Market Breakdown by Asset Type
- Overview
- Production Equipment
- Linear Assets
- Facilities
- Fleet
- Others
Chapter 7 Market Breakdown by Deployment
- Overview
- On-premise
- Cloud
Chapter 8 Market Breakdown by Organization Size
- Overview
- Large Enterprises
- Small and Medium Enterprises
Chapter 9 Market Breakdown by End-Use Industry
- Overview
- Oil and Gas
- Machinery Manufacturing
- Aerospace and Defense
- Energy and Power
- Metal and Mining
- Retail
- Automotive
- Government Facilities
- Others
Chapter 10 Market Breakdown by Region
- Overview
- North America
- U.S.
- Canada
- Mexico
- Europe
- Germany
- France
- Italy
- Spain
- Rest of Europe
- Asia-Pacific
- China
- India
- Japan
- Australia
- South Korea
- Rest of Asia-Pacific
- Rest of the World
- Middle East and Africa
- South America
Chapter 11 ESG Development
- Overview
- Role of EAM in Achieving ESG Targets
- Role of EAM in Improving Sustainability
- Role of EAM in Addressing Net-Zero Targets
- Digitalization and ESG Transformation
- EAM Supports ESG
- Case Study: Examples of Successful Implementation of ESG
- Concluding Remarks from BCC
Chapter 12 Emerging Technologies and Developments
- Technology Overview
- Technological Trends in EAM
Chapter 13 Patent Analysis
- Overview
- Descriptions of Patents on Enterprise Asset Management
Chapter 14 M&A and Funding Outlook
- M&A Analysis
- Venture Capital in the Global Market for Enterprise Asset Management
Chapter 15 Competitive Intelligence
- Overview
- Market Share Analysis
- Strategic Analysis
- Product Launches
- Partnerships
- Mergers and Acquisitions
- Product Mapping Analysis
- Product Mapping Analysis by Deployment Model
Chapter 16 Company Profiles
- Overview
- ABB LTD.
- ACCRUENT
- APTEAN
- ASSETWORKS INC.
- AVEVA GROUP PLC
- CGI INC.
- EMAINT ENTERPRISES LLC
- HEXAGON AB
- IFS
- IBM CORP.
- IPS INTELLIGENT PROCESS SOLUTIONS GMBH
- ORACLE CORP.
- RFGEN SOFTWARE
- SAP SE
- SSG INSIGHT LTD.
- UPKEEP TECHNOLOGIES INC.
Chapter 17 Appendix: Acronyms
