|
|
市場調査レポート
商品コード
1284955
エピジェネティック治療の世界市場Epigenetic Therapeutics: Global Markets |
||||||
|
|
|||||||


| エピジェネティック治療の世界市場 |
|
出版日: 2023年06月01日
発行: BCC Research
ページ情報: 英文 155 Pages
納期: 即納可能
|
- 全表示
- 概要
- 図表
- 目次
世界のエピジェネティック治療の市場規模は、2023年の68億米ドルから、2023年から2028年にかけての予測期間中は7.7%のCAGRで推移し、2028年には98億米ドルの規模に成長すると予測されています。
PRAP阻害剤の部門は、2023年の34億米ドルから、8.6%のCAGRで推移し、2028年には52億米ドルの規模に成長すると予測されています。また、キナーゼ阻害剤の部門は、2023年の26億米ドルかから、7.6%のCAGRで推移し、2028年には37億米ドルの規模に成長すると予測されています。
当レポートでは、世界のエピジェネティック治療の市場を調査し、市場の定義と概要、市場背景、市場影響因子と市場機会の分析、市場規模の推移・予測、各種区分・地域別の詳細分析、特許動向、パイプラインの分析、競合情勢、主要企業のプロファイルなどをまとめています。
目次
第1章 イントロダクション
第2章 サマリー・ハイライト
第3章 市場概要・定義
第4章 市場動向
- 市場促進要因
- 人口の高齢化
- 主要国における癌のリスク
- 新興市場における標的医療の浸透
- 市場機会
- 市場抑制要因
第5章 市場内訳:製品タイプ別
- PRAP阻害剤
- キナーゼ阻害剤
- IDH阻害剤
- HDAC阻害剤
- DNMT阻害剤
- 国民党阻害剤
第6章 COVID-19の影響
- COVID-19が医療機器および製薬業界に与える影響
- 選択的手続きの拒否/遅延
- COVID-19が医療機器および医薬品の各種部門に与える影響
- COVID-19がエピジェネティック治療市場に与える影響
第7章 市場内訳:地域別
- 市場概要・ディスカッション
- 北米
- ラテンアメリカ
- 欧州
- アジア太平洋
- その他の地域
第8章 新興/今後の技術
- CRISPR
- 抗体薬物複合体
- マルチターゲットエージェント
第9章 競合情勢
- 産業シナリオ
- 企業シェア
第10章 特許分析
- 製造業者別の特許分析
第11章 パイプライン分析
- 臨床試験シナリオ
第12章 企業プロファイル
- ASTRAZENECA
- BRISTOL-MYERS SQUIBB
- CLOVIS ONCOLOGY
- GSK PLC
- INCYTE
- IPSEN
- SEAGEN
- SERVIER LABORATORIES, LTD.
第13章 付録:頭字語
List of Tables
- Summary Table : Global Epigenetic Therapeutics Market, by Product Type, Through 2028
- Table 1 : Global Population, Age 60 and Older, 2010-2050
- Table 2 : Incidence of Pancreas Cancer, 2020-2040
- Table 3 : Incidence of Trachea, Bronchus and Lung Cancer, 2020-2040
- Table 4 : Incidence of Melanoma Cancer, 2020-2040
- Table 5 : Incidence of Prostate Cancer, 2020-2040
- Table 6 : Incidence of Breast Cancer, 2020-2040
- Table 7 : Incidence of Kidney and Renal Pelvis Cancers, 2020-2040
- Table 8 : Incidence of Hodgkin Lymphoma Cancer, 2020-2040
- Table 9 : Incidence of Non-Hodgkin Lymphoma Cancer, 2020-2040
- Table 10 : Incidence of Multiple Myeloma and Immunoproliferative Diseases, 2020-2040
- Table 11 : Incidence of Leukemia Cancer, 2020-2040
- Table 12 : Global Epigenetic Therapeutics Market, by Product Type, Through 2028
- Table 13 : Global PRAP Inhibitors Market, by Region, Through 2028
- Table 14 : Global Kinase Inhibitors Market, by Region, Through 2028
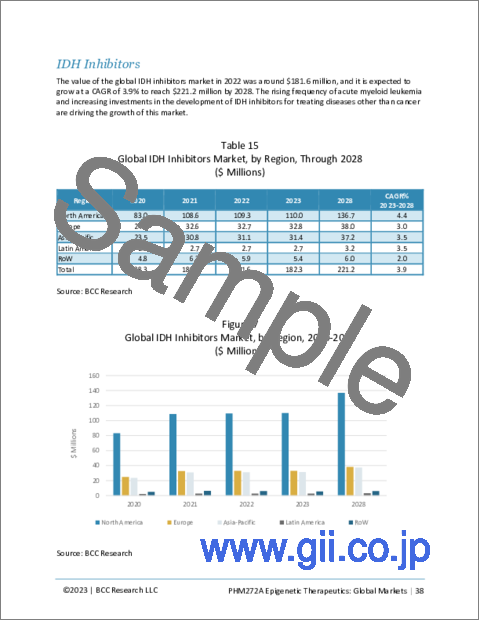
- Table 15 : Global IDH Inhibitors Market, by Region, Through 2028
- Table 16 : Global HDAC Inhibitors Market, by Region, Through 2028
- Table 17 : Global DNMT Inhibitors Market, by Region, Through 2028
- Table 18 : Global KMT Inhibitors Market, by Region, Through 2028
- Table 19 : Global Epigenetic Therapeutics Market, by Region, Through 2028
- Table 20 : North American Epigenetic Therapeutics Market, by Country, Through 2028
- Table 21 : Latin American Epigenetic Therapeutics Market, by Country, Through 2028
- Table 22 : European Epigenetic Therapeutics Market, by Country, Through 2028
- Table 23 : Asia-Pacific Epigenetic Therapeutics Market, by Country, Through 2028
- Table 24 : RoW Epigenetic Therapeutics Market, Through 2028
- Table 25 : Patents on Epigenetic Drugs, 2015-April 2023
- Table 26 : Selected Manufacturer Patents on Epigenetic Drugs, 2015-April 2023
- Table 27 : Patents on HDAC Inhibitors, 2015-April 2023
- Table 28 : Selected Manufacturer Patents on HDAC inhibitors, 2015-April 2023
- Table 29 : Patents on Kinase inhibitors, 2015-April 2023
- Table 30 : Patents on Verinostat Drug, 2015-April 2023
- Table 31 : Selected Manufacturer Patents on Verinostat Drug, 2015-April 2023
- Table 32 : Patents on Romidepsin Drug, 2015-April 2023
- Table 33 : Selected Manufacturer Patents on Romidepsin Drug, 2015-April 2023
- Table 34 : Patents on Panobinostat Drug, 2015-April 2023
- Table 35 : Selected Manufacturer Patents on Panobinostat Drug, 2015-April 2023
- Table 36 : Patents on Belinostat, 2015-April 2023
- Table 37 : Selected Manufacturer Patents on Belinostat, 2015-April 2023
- Table 38 : Patents on Tucidinostat Drug, 2015-April 2023
- Table 39 : Selected Manufacturer Patents on Tucidinostat Drug, 2015-April 2023
- Table 40 : Patents on 5-Azacytidine Drug, 2015-April 2023
- Table 41 : Selected Manufacturer Patents on 5-Azacytidine Drug, 2015-April 2023
- Table 42 : Patents on 5-Aza-2'-Deoxycytidine Drug, 2015-April 2023
- Table 43 : Selected Manufacturer Patents on 5-Aza-2'-Deoxycytidine Drug, 2015-April 2023
- Table 44 : Patents on Pinometostat Drug, 2015-April 2023
- Table 45 : Selected Manufacturer Patents on Pinometostat Drug, 2015-April 2023
- Table 46 : Patents on Ruxolitinib Drug, 2015-April 2023
- Table 47 : Selected Manufacturer Patents on Ruxolitinib Drug, 2015-April 2023
- Table 48 : Patents on AZD1152 Drug, 2015-April 2023
- Table 49 : Selected Manufacturer Patents on AZD1152 Drug, 2015-April 2023
- Table 50 : Patents on Olaparib Drug, 2015-April 2023
- Table 51 : Selected Manufacturer Patents on Olaparib Drug, 2015-April 2023
- Table 52 : Patents on Veliparib Drug, 2015-April 2023
- Table 53 : Selected Manufacturer Patents on Veliparib Drug, 2015-April 2023
- Table 54 : Patents on Niraparib Drug, 2015-April 2023
- Table 55 : Selected Manufacturer Patents on Niraparib Drug, 2015-April 2023
- Table 56 : Patents on Rucaparib Drug, 2015-April 2023
- Table 57 : Selected Manufacturer Patents on Rucaparib Drug, 2015-April 2023
- Table 58 : Patents on Talazoparib Drug, 2015-April 2023
- Table 59 : Selected Manufacturer Patents on Talazoparib Drug, 2015-April 2023
- Table 60 : Selected Kinase Inhibitors in Clinical Trials, as of 2023
- Table 61 : Selected Olaparib Inhibitors in Clinical Trials, as of 2023
- Table 62 : Selected Romidepsin Inhibitors in Clinical Trials, as of 2023
- Table 63 : Selected Ruxolitinib Inhibitors in Clinical Trials, as of 2023
- Table 64 : AstraZeneca: Company Annual Revenue, 2019-2022
- Table 65 : AstraZeneca: Annual Revenue, by Product, 2022
- Table 66 : Bristol-Myers Squibb: Company Annual Revenue, 2019-2022
- Table 67 : Clovis Oncology: Revenue, 2019-2021
- Table 68 : GSK: Company Annual Revenue, 2019-2022
- Table 69 : GSK: Annual Revenue, by Product, 2022
- Table 70 : Incyte: Company Annual Revenue, 2019-2021
- Table 71 : Incyte: Product Revenue, 2019-2021
- Table 72 : Ipsen: Sales Revenue, 2021 and 2022
- Table 73 : Ipsen: Sales Revenue, by Segment, 2021 and 2022
- Table 74 : Ipsen: Sales Revenue, by Region, 2021 and 2022
- Table 75 : Seagen: Company Annual Revenue, 2019-2021
- Table 76 : Acronyms Used in this Report
List of Figures
- Summary Figure A : Global Epigenetic Therapeutics Market, by Product Type, 2019-2028
- Summary Figure B : Global Epigenetic Therapeutics Market Share, by Product Type, 2022
- Figure 1 : Global Epigenetic Therapeutics Market, by Product, 2020-2028
- Figure 2 : Global Epigenetic Therapeutics Market Share, by Product, 2022
- Figure 3 : Global PRAP Inhibitors Market, by Region, 2020-2028
- Figure 4 : Global PRAP Inhibitors Market Share, by Region, 2022
- Figure 5 : Global Kinase Inhibitors Market, by Region, 2020-2028
- Figure 6 : Global Kinase Inhibitors Market Share, by Region, 2022
- Figure 7 : Global IDH Inhibitors Market, by Region, 2020-2028
- Figure 8 : Global IDH Inhibitors Market Share, by Region, 2022
- Figure 9 : Global HDAC Inhibitors Market, by Region, 2020-2028
- Figure 10 : Global HDAC Inhibitors Market Share, by Region, 2022
- Figure 11 : Global DNMT Inhibitors Market, by Region, 2020-2028
- Figure 12 : Global DNMT Inhibitors Market Share, by Region, 2022
- Figure 13 : Global KMT Inhibitors Market, by Region, 2020-2028
- Figure 14 : Global KMT Inhibitors Market Share, by Region, 2022
- Figure 15 : Global Epigenetic Therapeutics Market Share, by Region, 2022
- Figure 16 : North American Epigenetic Therapeutics Market Share, by Country, 2022
- Figure 17 : Latin American Epigenetic Therapeutics Market Share, by Country, 2022
- Figure 18 : European Epigenetic Therapeutics Market Share, by Country, 2022
- Figure 19 : Asia-Pacific Epigenetic Therapeutics Market Share, by Country, 2022
- Figure 20 : Global Epigenetic Therapeutics Market Share, by Company, 2022
- Figure 21 : Global PRAP Inhibitors Market Share, by Company, 2022
- Figure 22 : Global Kinase Inhibitors Market Share, by Company, 2022
- Figure 23 : Global IDH Inhibitors Market Share, by Company, 2022
- Figure 24 : Global HDAC Inhibitors Market Share, by Company, 2022
- Figure 25 : Global DNMT Inhibitors Market Share, by Company, 2022
- Figure 26 : Global KMT Inhibitors Market Share, by Company, 2022
- Figure 27 : AstraZeneca: Sales Share, by Product, 2022
- Figure 28 : AstraZeneca: Sales Share, by Region, 2022
- Figure 29 : Bristol-Myers Squibb: Sales Share, by Region, 2022
- Figure 30 : GSK: Revenue Share, by Product, 2022
- Figure 31 : GSK: Sales Share, by Region, 2022
- Figure 32 : Ipsen: Sales Revenue Share, by Segment, 2022
- Figure 33 : Ipsen: Sales Revenue Share, by Region 2022
Highlights:
The global market for epigenetic therapeutics is estimated to increase from $6.8 billion in 2023 to reach $9.8 billion by 2028, at a compound annual growth rate (CAGR) of 7.7% from 2023 through 2028.
The global market for epigenetic therapeutics for PRAP inhibitors is estimated to increase from $3.4 billion in 2023 to reach $5.2 billion by 2028, at a CAGR of 8.6% from 2023 through 2028.
The global market for epigenetic therapeutics for kinase inhibitors is estimated to increase from $2.6 billion in 2023 to reach $3.7 billion by 2028, at a CAGR of 7.6% from 2023 through 2028.
Report Scope:
This report is a comprehensive study of the global market for epigenetic therapeutics. It describes the epigenetic therapeutics market, which is segmented by product type and region. Based on product type, the market is segmented into PRAP inhibitors, Kinase inhibitors, IDH inhibitors, HDAC inhibitors, DNMT inhibitors and KMT inhibitors. The market is segmented by region into North America, Latin America, Europe, Asia-Pacific, and the Rest of the World (RoW).
This report examines the factors driving growth in the epigenetic drugs market, and it reviews major players, established companies and new entrants.
This report, however, does not cover epigenetic diagnostic assays and instruments.
Report Includes:
- 77 tables
- A comprehensive overview of the global markets for epigenetic therapeutics
- Analyses of the global market trends with historical market revenue data (sales figures) for 2020-2022, estimates for 2023, and projections of compound annual growth rates (CAGRs) through 2028
- Understanding of the upcoming market potential for epigenetic therapeutics with an emphasis on new products and technologies, and areas of focus to forecast this market into various segments and sub-segments
- Estimation of the actual market size and revenue forecast for the global epigenetic therapeutics market, and corresponding market share analysis product type and region
- In-depth information (facts and figures) concerning major market dynamics (DROs), technology advancements, new products and applications in epigenomics, and COVID-19 impact on the industry
- Coverage of the technological, economic, and business considerations of the market for epigenetic therapeutics, with analyses and growth forecasts through 2028
- A look at the recent breakthrough innovations, key technological issues, market regulations, and current status on the intellectual property rights on epigenetic therapeutics
- Review of patent trends and research publications for innovations in the genome-editing technologies
- Insight into the recent industry structure, government regulations and policies, development issues, and the vendor landscape
- Analysis of the competitive environment and market opportunities based on the company's business strategies, product mapping, and operational integration
- Descriptive company profiles of the leading pharma corporations, including AstraZeneca, Bristol-Myers Squibb, GSK, Ipsen, Seagen, and Incyte
Table of Contents
Chapter 1 Introduction
- Study Goals and Objectives
- Reasons for Doing this Study
- Scope of Report
- Methodology
- Information Sources
- Geographic Breakdown
- Analyst's Credentials
- BCC Custom Research
- Related BCC Research Reports
Chapter 2 Summary and Highlights
- Highlights of the Market for Epigenetic Therapeutics
Chapter 3 Market Overview and Definitions
- Overview
- Epigenetics
Chapter 4 Market Trends
- Market Drivers
- Aging Population
- Risk of Cancer in Major Countries
- Penetration of Targeted Medicine in Emerging Markets
- Market Opportunity
- Market Restraints
Chapter 5 Market Breakdown by Product Type
- Introduction
- PRAP Inhibitors
- Kinase Inhibitors
- IDH Inhibitors
- HDAC Inhibitors
- DNMT Inhibitors
- KMT Inhibitors
Chapter 6 Impact of COVID-19
- Introduction
- Impact of COVID-19 on the Medical Devices and Pharmaceutical Industries
- Decline/Delay in Elective Procedures
- Impact of COVID-19 on Medical Device and Pharmaceutical Product Segments
- Impact of COVID-19 on Epigenetic Therapeutics Markets
Chapter 7 Market Breakdown by Region
- Market Overview and Discussion
- North America
- Latin America
- Europe
- Asia-Pacific
- Rest of the World
Chapter 8 Emerging/Upcoming Technologies
- CRISPR
- Antibody Drug Conjugates
- Multitargeting Agents
Chapter 9 Competitive Landscape
- Industry Scenario
- Company Shares
Chapter 10 Patent Analysis
- Patent Analysis, by Manufacturer
Chapter 11 Pipeline Analysis
- Clinical Trials Scenario
Chapter 12 Company Profiles
- ASTRAZENECA
- BRISTOL-MYERS SQUIBB
- CLOVIS ONCOLOGY
- GSK PLC
- INCYTE
- IPSEN
- SEAGEN
- SERVIER LABORATORIES, LTD.