|
|
市場調査レポート
商品コード
1280005
電子工業用薬品および電子材料:世界市場Electronic Chemicals and Materials: The Global Market |
||||||
|
|
|||||||


| 電子工業用薬品および電子材料:世界市場 |
|
出版日: 2023年05月24日
発行: BCC Research
ページ情報: 英文 207 Pages
納期: 即納可能
|
- 全表示
- 概要
- 図表
- 目次
世界の電子工業用薬品および電子材料の市場規模は、2022年の594億米ドルから、2022年から2027年にかけて5.0%のCAGRで推移し、2027年には760億米ドルの規模に成長すると予測されています。
ウエハ部門は、2022年の168億米ドルから、5.8%のCAGRで推移し、2027年には222億米ドルの規模に成長すると予測されています。また、フォトレジスト化学品の部門は、2022年の40億米ドルから、7.2%のCAGRで推移し、2027年には57億米ドルの規模に成長すると予測されています。
当レポートでは、世界の電子工業用薬品および電子材料の市場を調査し、市場および技術の背景、市場影響因子と市場機会、市場規模の推移・予測、各種区分・地域別の詳細分析、特許動向、競合環境、主要企業のプロファイルなどをまとめています。
目次
第1章 イントロダクション
第2章 概要およびハイライト
第3章 市場および技術の背景
- 現在のシナリオ
- 半導体産業の現状
- 半導体製造における重要な作業
- 加工作業で使用される化学物質
- プリント基板の製造
- 電子工業用薬品産業における技術開発の歴史
- 電子工業用薬品の純度要件
- 電子工業用薬品および電子材料産業の規制
- エレクトロニクス産業で使用される有毒および危険な化学物質
第4章 市場力学
- 概要
- 市場促進要因
- 市場課題
- バリューチェーン分析
- ポーターのファイブフォース分析
- COVID-19とロシア・ウクライナ戦争が市場に与える影響
- 総論
第5章 市場内訳:製品タイプ別
- 概要
- ウエハ
- ケイ素
- 炭化ケイ素
- 窒化ガリウム
- ガリウムヒ素
- その他
- PCBラミネート
- ポリマー
- ポリアセチレン
- ポリアニリン
- ポリエチレンジオキシチオフェン
- ポリピロール
- ガス
- 特殊ガス
- 反応ガス
- バルクガス
- ドーパントガス
- その他
- フォトレジスト薬品
- ネガ型フォトレジスト
- ポジ型フォトレジスト
- ウェットケミカルおよび溶剤
- 酢酸
- 塩酸
- フッ化水素酸
- 過酸化水素
- イソプロピルアルコール
- メタノール
- メチルクロロホルム
- 硝酸
- パーフルオロカーボン
- パーフルオロオクチルスルホネート/パーフルオロアルキルスルホネート
- リン酸
- 硫酸
- 溶剤
- CMPスラリー
- その他
- 金属
- Low-K誘電体
- その他
第6章 市場内訳:用途別
- 概要
- 半導体および集積回路(IC)
- プリント基板
- ディスプレイ
- その他
第7章 市場内訳:エンドユーザー産業別
- 概要
- 通信
- コンピューター
- CE製品
- 工業
- 自動車
- 医療
- 航空宇宙・防衛
第8章 市場内訳:地域別
- 概要
- 南北アメリカ
- アジア太平洋
- 欧州・中東・アフリカ
第9章 競合情勢
- 競合シナリオの分析
- 特許レビュー
- 戦略的分析
第10章 企業プロファイル
- 主要企業
- AIR LIQUIDE
- AIR PRODUCTS INC.
- ALBEMARLE CORP.
- ASHLAND GLOBAL HOLDINGS INC.
- BASF SE
- COVESTRO AG
- THE DOW CHEMICAL CO.
- DUPONT DE NEMOURS INC.
- ENTEGRIS INC.
- FUJIFILM HOLDINGS CORP.
- HONEYWELL INTERNATIONAL INC.
- HUNTSMAN INTERNATIONAL LLC
- JSR CORP.
- LINDE PLC
- MERCK KGAA
- RESONAC HOLDINGS CORP.
- SHIN-ETSU CHEMICAL CO. LTD.
- SOLVAY SA
- SONGWON INDUSTRIAL CO. LTD.
- TOKYO OHKA KOGYO CO. LTD.
- その他の企業
- DIC CORP.
- DONGJIN SEMICHEM
- DONGWOO FINE CHEMICALS CO. LTD.
- FMC INDUSTRIAL CHEMICALS
- FORGE EUROPA LTD.
- GENERAL CHEMICAL CORP.
- IBM CORP.
- KANTO CHEMICAL CO. INC.
- MACDERMID INC.
- MATHESON TRI-GAS INC.
- NANTERO INC.
- RD CHEMICAL
- SUMCO CORP.
- SUMITOMO CHEMICAL CO. LTD.
- TAIYO NIPPON SANSO CORP.
- WACKER CHEMIE AG
第11章 付録:頭字語のリスト
List of Tables
- Summary Table : Global Market for Electronic Chemicals and Materials, by Product, Through 2027
- Table 1 : Chemicals Used in Semiconductor Fabrication Processes
- Table 2 : Electronic Gas Applications and Climate Impact
- Table 3 : Global Market for Semiconductor Wafers in the Electronics Industry, by Type, Through 2027
- Table 4 : Global Market for Semiconductor Wafers in the Electronics Industry, by Region, Through 2027
- Table 5 : Global Market for PCB Laminates in the Electronics Industry, by Region, Through 2027
- Table 6 : Global Market for Polymers in the Electronics Industry, by Type, Through 2027
- Table 7 : Global Market for Polymers in the Electronics Industry, by Region, Through 2027
- Table 8 : Global Market for Gases in the Electronics Industry, by Region, Through 2027
- Table 9 : Global Market for Photoresist Chemicals in the Electronics Industry, by Type, Through 2027
- Table 10 : Global Market for Photoresist Chemicals in the Electronics Industry, by Region, Through 2027
- Table 11 : Global Market for Wet Chemicals and Solvents in the Electronics Industry, by Region, Through 2027
- Table 12 : Global Market for CMP Slurries in the Electronics Industry, by Type, Through 2027
- Table 13 : Global Market for CMP Slurries in the Electronics Industry, by Region, Through 2027
- Table 14 : Global Market for Other Chemicals and Materials in the Electronics Industry, by Region, Through 2027
- Table 15 : Global Market for Electronic Chemicals and Materials, by Application, Through 2027
- Table 16 : Global Market for Electronic Chemicals and Materials in Semiconductors and ICs, by End-User Sector, Through 2027
- Table 17 : Global Market for Electronic Chemicals and Materials in Semiconductors and ICs, by Region, Through 2027
- Table 18 : Global Market for Electronic Chemicals and Materials in Printed Circuit Boards, by End-User Sector, Through 2027
- Table 19 : Global Market for Electronic Chemicals and Materials in Printed Circuit Boards, by Region, Through 2027
- Table 20 : Global Market for Electronic Chemicals and Materials in Displays, by End-User Sector, Through 2027
- Table 21 : Global Market for Electronic Chemicals and Materials in Displays, by Region, Through 2027
- Table 22 : Global Market for Electronic Chemicals and Materials in Other Applications, by End-User Sector, Through 2027
- Table 23 : Global Market for Electronic Chemicals and Materials in Other Applications, by Region, Through 2027
- Table 24 : Global Market for Electronic Chemicals and Materials, by End-User Sector, Through 2027
- Table 25 : Global Market for Electronic Chemicals and Materials in Communications, by Application, Through 2027
- Table 26 : Global Market for Electronic Chemicals and Materials in Computers, by Application, Through 2027
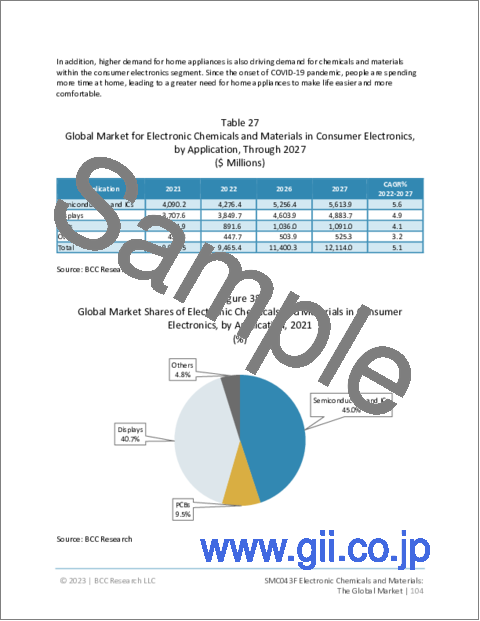
- Table 27 : Global Market for Electronic Chemicals and Materials in Consumer Electronics, by Application, Through 2027
- Table 28 : Global Market for Chemicals and Materials in Industrial Electronics, by Application, Through 2027
- Table 29 : Global Market for Chemicals and Materials in Automotive Electronics, by Application, Through 2027
- Table 30 : Global Market for Chemicals and Materials in Medical Electronics, by Application, Through 2027
- Table 31 : Global Market for Chemicals and Materials in Aerospace and Defense Electronics, by Application, Through 2027
- Table 32 : Global Market for Electronic Chemicals and Materials, by Region, Through 2027
- Table 33 : Americas Market for Electronic Chemicals and Materials, by Country, Through 2027
- Table 34 : Americas Market for Electronic Chemicals and Materials, by Product, Through 2027
- Table 35 : Americas Market for Electronic Chemicals and Materials, by Application, Through 2027
- Table 36 : Asia-Pacific Market for Electronic Chemicals and Materials, by Country, Through 2027
- Table 37 : Asia-Pacific Market for Electronic Chemicals and Materials, by Product, Through 2027
- Table 38 : Asia-Pacific Market for Electronic Chemicals and Materials, by Application, Through 2027
- Table 39 : EMEA Market for Electronic Chemicals and Materials, by Country, Through 2027
- Table 40 : EMEA Market for Electronic Chemicals and Materials, by Product, Through 2027
- Table 41 : EMEA Market for Electronic Chemicals and Materials, by Application, Through 2027
- Table 42 : Global Market for Electronic Chemicals and Materials: Acquisitions and Expansions, May 2019-February 2023
- Table 43 : Global Market for Electronic Chemicals and Materials: Product Launches, February 2019-February 2023
- Table 44 : Global Market for Electronic Chemicals and Materials: Agreements, Contracts, Collaborations and Partnerships, January 2019-March 2023
- Table 45 : Air Liquide: Company Overview
- Table 46 : Air Liquide: Related Offerings and Served Markets
- Table 47 : Air Products Inc.: Company Overview
- Table 48 : Air Products Inc.: Related Offerings and Served Markets
- Table 49 : Albemarle Corp.: Company Overview
- Table 50 : Albemarle Corp.: Product Offerings
- Table 51 : Ashland Global Holdings Inc.: Company Overview
- Table 52 : Ashland Global Holdings Inc.: Related Offerings
- Table 53 : BASF SE: Company Overview
- Table 54 : BASF SE: Related Offerings and Served Markets
- Table 55 : Covestro AG: Company Overview
- Table 56 : Covestro AG: Related Offerings and Served Markets
- Table 57 : The Dow Chemical Co.: Company Overview
- Table 58 : The Dow Chemical Co.: Related Offerings
- Table 59 : DuPont de Nemours Inc.: Company Overview
- Table 60 : DuPont de Nemours Inc.: Related Offerings and Key Raw Materials
- Table 61 : Entegris Inc.: Snapshot
- Table 62 : Entegris Inc.: Related Offerings
- Table 63 : Fujifilm Holdings Corp.: Company Overview
- Table 64 : Fujifilm Holdings Corp.: Related Offerings
- Table 65 : Honeywell International Inc.: Company Overview
- Table 66 : Honeywell International Inc.: Related Offerings
- Table 67 : Huntsman International LLC: Company Overview
- Table 68 : Huntsman International LLC: Related Offerings
- Table 69 : JSR Corp.: Company Overview
- Table 70 : JSR Corp.: Related Offerings
- Table 71 : Linde PLC: Company Overview
- Table 72 : Linde PLC: Related Offerings
- Table 73 : Merck KGaA: Company Overview
- Table 74 : Merck KGaA: Related Offerings
- Table 75 : Resonac Holdings Corp.: Company Overview
- Table 76 : Shin-Etsu Chemical Co. Ltd.: Company Overview
- Table 77 : Shin-Etsu Chemical Co. Ltd.: Related Offerings
- Table 78 : Solvay SA: Company Overview
- Table 79 : Solvay SA: Related Offerings
- Table 80 : Songwon Industrial Co. Ltd.: Company Overview
- Table 81 : Songwon Industrial Co. Ltd.: Related Offerings and Key Markets
- Table 82 : Tokyo Ohka Kogyo Co. Ltd.: Company Overview
- Table 83 : Tokyo Ohka Kogyo Co. Ltd.: Related Offerings
- Table 84 : List of Acronyms
List of Figures
- Summary Figure : Global Market Shares of Electronic Chemicals and Materials, by Application, 2021
- Figure 1 : Global Production of Electronics and IT Industries, 2012-2023
- Figure 2 : Shares of Semiconductor Sales Trend, by Region/Country in 2022 as Compared with 2021
- Figure 3 : Global Market for Semiconductors, 2000-2021
- Figure 4 : Global Electronic Chemicals and Materials Market: Drivers and Restraints
- Figure 5 : Global Mobile Subscribers and Licensed Cellular IoT Connections, 2021 and 2025
- Figure 6 : Technology Mix Share, by Region, 2021
- Figure 7 : Technology Mix Share, by Region, 2025
- Figure 8 : Value Chain Analysis
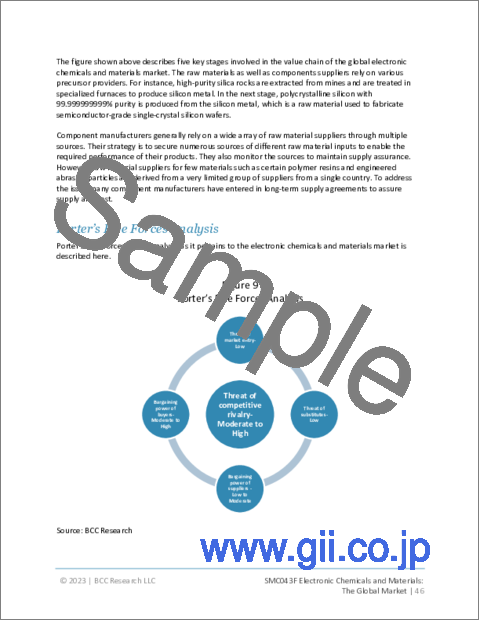
- Figure 9 : Porter's Five Forces Analysis
- Figure 10 : Global/Regional Economic Growth Share, 2022 and 2023
- Figure 11 : Global Market Shares of Semiconductor Wafers in the Electronics Industry, by Type, 2021
- Figure 12 : Global Market Shares of Semiconductor Wafers in the Electronics Industry, by Region, 2021
- Figure 13 : PCB Material
- Figure 14 : Properties of PCB Laminate Dielectric Materials
- Figure 15 : Global Market Shares of PCB Laminates in the Electronics Industry, by Region, 2021
- Figure 16 : Global Market Shares of Polymers in the Electronics Industry, by Type, 2021
- Figure 17 : Global Market Shares of Polymers in the Electronics Industry, by Region, 2021
- Figure 18 : Global Market Shares of Polymers in the Electronics Industry, by Region, 2021
- Figure 19 : Global Market Shares of Photoresist Chemicals in the Electronics Industry, by Type, 2021
- Figure 20 : Global Market Shares of Photoresist Chemicals in the Electronics Industry, by Region, 2021
- Figure 21 : Global Market Shares of Wet Chemicals and Solvents in the Electronics Industry, by Region, 2021
- Figure 22 : Global Market Shares of CMP Slurries in the Electronics Industry, by Type, 2021
- Figure 23 : Global Market Shares of CMP Slurries in the Electronics Industry, by Region, 2021
- Figure 24 : Global Market Shares of Other Chemicals and Materials in the Electronics Industry, by Region, 2021
- Figure 25 : Global Market Shares of Electronic Chemicals and Materials, by Application, 2021
- Figure 26 : Global Market Shares of Semiconductor Industry, by Region/Country, 2021
- Figure 27 : Global Market Shares of Electronic Chemicals and Materials in Semiconductors and ICs, by End-User Sector, 2021
- Figure 28 : Global Market Shares for Electronic Chemicals and Materials in Semiconductors and ICs, by Region, 2021
- Figure 29 : Global Market Shares of Electronic Chemicals and Materials in Printed Circuit Boards, by End-User Sector, 2021
- Figure 30 : Global Market Shares of Electronic Chemicals and Materials in Printed Circuit Boards, by Region, 2021
- Figure 31 : Global Market Shares of Electronic Chemicals and Materials in Displays, by End-User Sector, 2021
- Figure 32 : Global Market Shares of Electronic Chemicals and Materials in Displays, by Region, 2021
- Figure 33 : Global Market Shares of Electronic Chemicals and Materials in Other Applications, by End-User Sector, 2021
- Figure 34 : Global Market Shares of Electronic Chemicals and Materials in Other Applications, by Region, 2021
- Figure 35 : Global Market Shares of Electronic Chemicals and Materials, by End-User Sector, 2021
- Figure 36 : Global Market Shares of Electronic Chemicals and Materials in Communications, by Application, 2021
- Figure 37 : Global Market Shares of Electronic Chemicals and Materials in Computers, by Application, 2021
- Figure 38 : Global Market Shares of Electronic Chemicals and Materials in Consumer Electronics, by Application, 2021
- Figure 39 : Global Market Shares of Chemicals and Materials in Industrial Electronics, by Application, 2021
- Figure 40 : Shares of Semiconductor Demand Structure, by Node Size
- Figure 41 : Global Market Shares of Chemicals and Materials in Automotive Electronics, by Application, 2021
- Figure 42 : Global Market Shares of Chemicals and Materials in Medical Electronics, by Application, 2021
- Figure 43 : Global Market Shares of Chemicals and Materials in Aerospace and Defense Electronics, by Application, 2021
- Figure 44 : Global Electronics Trade, by Country, 2021
- Figure 45 : Global Market Shares of Electronic Chemicals and Materials, by Region, 2021
- Figure 46 : Americas Market Shares of Electronic Chemicals and Materials, by Country, 2021
- Figure 47 : Americas Market Shares of Electronic Chemicals and Materials, by Product, 2021
- Figure 48 : Americas Market Shares of Electronic Chemicals and Materials, by Application, 2021
- Figure 49 : The Total GVA Contribution to GDP of the U.S. Semiconductor Industry, 2021
- Figure 50 : Asia-Pacific Market Shares of Electronic Chemicals and Materials, by Country, 2021
- Figure 51 : Asia-Pacific Market Shares of Electronic Chemicals and Materials, by Product, 2021
- Figure 52 : Asia-Pacific Market Shares of Electronic Chemicals and Materials, by Application, 2021
- Figure 53 : EMEA Market Shares of Electronic Chemicals and Materials, by Country, 2021
- Figure 54 : EMEA Market Shares of Electronic Chemicals and Materials, by Product, 2021
- Figure 55 : EMEA Market Shares of Electronic Chemicals and Materials, by Application, 2021
- Figure 56 : Key Competitive factors
- Figure 57 : Shares of the Most-Followed Strategies Used in the Global Market for Electronic Chemicals and Materials, 2019-2023
- Figure 58 : Air Liquide: Group Revenue, 2021 and 2022
- Figure 59 : Air Liquide: Group Revenue Share, by End-User Industry, 2022
- Figure 60 : Air Liquide: Group Revenue Share, by Region, 2022
- Figure 61 : Air Products Inc.: Sales, 2020-2022
- Figure 62 : Air Products Inc.: Sales Share, by Business Segment, 2021
- Figure 63 : Air Products Inc.: Sales Share, by Region/Country, 2021
- Figure 64 : Albemarle Corp.: Sales, 2021 and 2022
- Figure 65 : Ashland Global Holdings Inc.: Sales, 2021 and 2022
- Figure 66 : Ashland Global Holdings Inc.: Sales Share, by Business Segment, 2022
- Figure 67 : Ashland Global Holdings Inc.: Sales Share, by Region, 2022
- Figure 68 : BASF SE: Net Sales, 2021 and 2022
- Figure 69 : BASF SE: Revenue Share, by Region, 2022
- Figure 70 : BASF SE: Revenue Share, by Business Segment, 2022
- Figure 71 : COVESTRO AG: Net Sales, 2021 and 2022
- Figure 72 : The Dow Chemical Co.: Net Sales, 2021 and 2022
- Figure 73 : The Dow Chemical Co.: Revenue Share, by Region/Country, 2022
- Figure 74 : The Dow Chemical Co.: Revenue Share, by Business Segment, 2022
- Figure 75 : DuPont de Nemours Inc.: Net Sales, 2021 and 2022
- Figure 76 : DuPont de Nemours Inc.: Revenue Share, by Business Segment, 2022
- Figure 77 : Entegris Inc.: Net Sales, 2021 and 2022
- Figure 78 : Entegris Inc.: Revenue Share, by Business Segment, 2022
- Figure 79 : Fujifilm Holdings Corp.: Net Sales, 2021 and 2022
- Figure 80 : Fujifilm Holdings Corp.: Revenue Share, by Business Segment, 2022
- Figure 81 : Fujifilm Holdings Corp.: Revenue Share, by Region/Country, 2022
- Figure 82 : Honeywell International Inc.: Net Sales, 2021 and 2022
- Figure 83 : Honeywell International Inc.: Revenue Share, by Business Segment, 2022
- Figure 84 : Huntsman International LLC: Net Sales, 2021 and 2022
- Figure 85 : Huntsman International LLC: Revenue Share, by Business Segment, 2022
- Figure 86 : JSR Corp.: Net Sales, 2021 and 2022
- Figure 87 : Linde PLC: Net Sales, 2021 and 2022
- Figure 88 : Merck KGaA: Net Sales, 2021 and 2022
- Figure 89 : Merck KGaA: Revenue Share, by Business Segment, 2022
- Figure 90 : Merck KGaA: Revenue Share, by Region, 2022
- Figure 91 : Resonac Holdings Corp.: Net Sales, 2021 and 2022
- Figure 92 : Resonac Holdings Corp.: Revenue Share, by Business Segment, 2022
- Figure 93 : Shin-Etsu Chemical Co. Ltd.: Net Sales, 2021 and 2022
- Figure 94 : Shin-Etsu Chemical Co. Ltd.: Revenue Share, by Business Segment, 2022
- Figure 95 : Shin-Etsu Chemical Co. Ltd.: Revenue Share, by Region/Country, 2022
- Figure 96 : Solvay SA: Net Sales, 2020 and 2021
- Figure 97 : Solvay SA: Revenue Share, by Region, 2022
- Figure 98 : Songwon Industrial Co. Ltd.: Net Sales, 2021 and 2022
- Figure 99 : Songwon Industrial Co. Ltd.: Revenue Share, by Segment, 2022
- Figure 100 : Songwon Industrial Co. Ltd.: Revenue Share, by Region/Country, 2022
- Figure 101 : Tokyo Ohka Kogyo Co. Ltd.: Net Sales, 2021 and 2022
Highlights:
The global electronic chemicals and materials market should reach $76 billion by 2027 from $59.4 billion in 2022 at a compound annual growth rate (CAGR) of 5.0% for the forecast period of 2022 to 2027.
Wafers segment of the global electronic chemicals and materials market is expected to grow from $16.8 billion in 2022 to $22.2 billion in 2027 at a CAGR of 5.8% for the forecast period of 2022 to 2027.
Photoresist chemicals segment of the global electronic chemicals and materials market is expected to grow from $4.0 billion in 2022 to $5.7 billion in 2027 at a CAGR of 7.2% for the forecast period of 2022 to 2027.
Report Scope:
The report provides an overview of the global market for electronic chemicals and materials and analyzes market trends. The base year considered for analyses is 2021, while the market estimates and forecasts are given for 2022 to 2027. The market estimates are only provided in terms of revenue, in terms of millions of U.S dollars. Revenue forecasts for this period are segmented based on product type, application, end-user industry, and geography.
The report also focuses on the major driving trends and challenges that will affect the market and the vendor landscape. The report explains the competitive landscape and current trends in the electronic chemicals and materials market. The report concludes with an analysis of the electronic chemicals and materials vendor landscape and includes detailed profiles of the major players in the global electronic chemicals and materials market.
Report Includes:
- 40 tables and 45 additional tables
- An overview of the global market for electronic chemicals and materials
- Estimation of the market size and analyses of global market trends, with data of 2021, estimates for 2022 and 2026 with projections of compound annual growth rates (CAGRs) through 2027
- Highlights of the current and future market potential and quantification of electronic chemicals and materials market based on product type, application, end-user industry and region
- Identification of market drivers, restraints and other forces impacting the global market and evaluation of current market size and forecast
- Detailed analysis of the regulatory framework and policies and technological changes within the industry
- Market share analysis of the key companies of the industry and coverage of their proprietary technologies, strategic alliances, and other key market strategies and a relevant patent analysis
- Comprehensive company profiles of the leading players of the industry, including Air Liquide, BASF SE, Fujifilm Holdings Corp., Merck KGaA and Solvay SA
Table of Contents
Chapter 1 Introduction
- 1.1 Study Goals and Objectives
- 1.2 Reasons for Doing This Study
- 1.3 What's New in This Update?
- 1.4 Scope of Report
- 1.5 Information Sources
- 1.6 Methodology
- 1.7 Intended Audience
- 1.8 Geographic Breakdown
- 1.9 Analyst's Credentials
- 1.10 BCC Custom Research
- 1.11 Related BCC Research Reports
Chapter 2 Summary and Highlights
Chapter 3 Market and Technology Background
- 3.1 Current Scenario
- 3.2 Status of the Semiconductor Industry
- 3.2.1 Global Semiconductor Sales Scenario in 2022
- 3.2.2 Global Semiconductor Sales Scenario before 2022
- 3.3 Important Operations in Semiconductor Manufacturing
- 3.3.1 Blank Wafer Production
- 3.3.2 Semiconductor Fabrication Processes
- 3.3.3 Assembly and Packaging
- 3.4 Chemicals Used in the Processing Operation
- 3.5 Printed Circuit Board Manufacturing
- 3.5.1 Process Outline
- 3.6 Historical Technology Developments in the Electronic Chemicals Industry
- 3.7 Purity Requirements of Electronic Chemicals
- 3.8 Regulation of the Electronic Chemicals and Materials Industry
- 3.8.1 United States
- 3.8.2 European Union
- 3.8.3 Asia
- 3.9 Toxic and Hazardous Chemicals Used in the Electronics Industry
- 3.9.1 Fluorinated Compounds
- 3.9.2 Perfluorooctyl Sulfonates/Perfluoroalkyl Sulfonates
- 3.9.3 Polybrominated Diphenyl Ethers
- 3.9.4 Lead
- 3.9.5 Waste Electronic Equipment
Chapter 4 Market Dynamics
- 4.1 Overview
- 4.2 Market Drivers
- 4.2.1 Proliferating Semiconductor Demand
- 4.2.2 Growth of Printed Electronics
- 4.2.3 Rising Electronics Demand from Developing Countries
- 4.2.4 Growing Adoption of New Technologies Such as 5G and IoT
- 4.2.5 Technological Advancements of Existing Electronic Devices
- 4.3 Market Challenges
- 4.3.1 Strict Regulations Pertaining to Few Chemicals and Materials
- 4.4 Value Chain Analysis
- 4.5 Porter's Five Forces Analysis
- 4.6 Impact of COVID-19 and the Russia-Ukraine War on the Market
- 4.6.1 Overview
- 4.6.2 Impact on Associated Industries of Global Electronic Chemicals and Materials Market
- 4.7 Conclusion
Chapter 5 Market Breakdown by Product Type
- 5.1 Overview
- 5.2 Wafers
- 5.2.1 Silicon
- 5.2.2 Silicon Carbide
- 5.2.3 Gallium Nitride
- 5.2.4 Gallium Arsenide
- 5.2.5 Others
- 5.3 PCB Laminates
- 5.4 Polymers
- 5.4.1 Polyacetylenes
- 5.4.2 Polyaniline
- 5.4.3 Polyethylene Dioxythiophene
- 5.4.4 Polypyrrole
- 5.5 Gases
- 5.5.1 Specialty Gases
- 5.5.2 Reactant Gases
- 5.5.3 Bulk Gases
- 5.5.4 Dopant Gases
- 5.5.5 Miscellaneous Gases
- 5.6 Photoresist Chemicals
- 5.6.1 Negative Photoresists
- 5.6.2 Positive Photoresists
- 5.7 Wet Chemicals and Solvents
- 5.7.1 Acetic Acid
- 5.7.2 Hydrochloric Acid
- 5.7.3 Hydrofluoric Acid
- 5.7.4 Hydrogen Peroxide
- 5.7.5 Isopropyl Alcohol
- 5.7.6 Methanol
- 5.7.7 Methyl Chloroform
- 5.7.8 Nitric Acid
- 5.7.9 Perfluorocarbons
- 5.7.10 Perfluorooctyl Sulfonates/Perfluoroalkyl Sulfonates
- 5.7.11 Phosphoric Acid
- 5.7.12 Sulfuric Acid
- 5.7.13 Solvents
- 5.8 CMP Slurries
- 5.9 Others
- 5.9.1 Metals
- 5.9.2 Low-K Dielectric
- 5.9.3 Miscellaneous Chemicals
Chapter 6 Market Breakdown by Application
- 6.1 Overview
- 6.2 Semiconductors and Integrated Circuits (ICs)
- 6.3 Printed Circuit Boards
- 6.4 Displays
- 6.5 Others
Chapter 7 Market Breakdown by End-User Industry
- 7.1 Overview
- 7.2 Communications
- 7.3 Computers
- 7.4 Consumer Electronics
- 7.5 Industrial
- 7.6 Automotive
- 7.7 Medical
- 7.8 Aerospace and Defense
Chapter 8 Market Breakdown by Region
- 8.1 Overview
- 8.2 Americas
- 8.2.1 U.S.
- 8.2.2 Canada
- 8.2.3 Mexico
- 8.3 Asia-Pacific
- 8.3.1 China
- 8.3.2 Taiwan
- 8.3.3 South Korea
- 8.4 Europe, Middle East and Africa (EMEA)
- 8.4.1 Germany
- 8.4.2 Netherlands
- 8.4.3 GCC
Chapter 9 Competitive Landscape
- 9.1 Competitive Scenarios Analysis
- 9.2 Patent Review
- 9.2.1 Compositions
- 9.2.2 Application Development
- 9.2.3 Process Technology
- 9.3 Strategic Analysis
- 9.3.1 Acquisitions and Expansions
- 9.3.2 Product Launches
- 9.3.3 Agreements, Contracts, Collaborations and Partnerships
Chapter 10 Company Profiles
- 10.1 Key Players
- AIR LIQUIDE
- AIR PRODUCTS INC.
- ALBEMARLE CORP.
- ASHLAND GLOBAL HOLDINGS INC.
- BASF SE
- COVESTRO AG (FORMERLY BAYER MATERIALSCIENCE)
- THE DOW CHEMICAL CO.
- DUPONT DE NEMOURS INC. (FORMERLY DOWDUPONT INC.)
- ENTEGRIS INC.
- FUJIFILM HOLDINGS CORP.
- HONEYWELL INTERNATIONAL INC.
- HUNTSMAN INTERNATIONAL LLC
- JSR CORP. (FORMERLY JAPAN SYNTHETIC RUBBER CO. LTD.)
- LINDE PLC
- MERCK KGAA
- RESONAC HOLDINGS CORP.
- SHIN-ETSU CHEMICAL CO. LTD.
- SOLVAY SA
- SONGWON INDUSTRIAL CO. LTD.
- TOKYO OHKA KOGYO CO. LTD.
- 10.2 Other Players
- DIC CORP.
- DONGJIN SEMICHEM
- DONGWOO FINE CHEMICALS CO. LTD.
- FMC INDUSTRIAL CHEMICALS
- FORGE EUROPA LTD.
- GENERAL CHEMICAL CORP.
- IBM CORP.
- KANTO CHEMICAL CO. INC.
- MACDERMID INC.
- MATHESON TRI-GAS INC.
- NANTERO INC.
- RD CHEMICAL
- SUMCO CORP.
- SUMITOMO CHEMICAL CO. LTD.
- TAIYO NIPPON SANSO CORP.
- WACKER CHEMIE AG