|
|
市場調査レポート
商品コード
1132547
XaaS (Everything as a Service) の世界市場Everything as a Service (XaaS): Global Markets |
||||||
|
|
|||||||


| XaaS (Everything as a Service) の世界市場 |
|
出版日: 2022年09月30日
発行: BCC Research
ページ情報: 英文 151 Pages
納期: 即納可能
|
- 全表示
- 概要
- 図表
- 目次
世界のXaaS (Everything as a Service) の市場規模は、2022年の5,302億米ドルから、2027年には1兆8,000億米ドルに拡大し、2022年から2027年までのCAGRは28.0%と予測されています。
小売部門は、2022年の983億米ドルから、2027年には4,005億米ドルに増加し、2022年から2027年までのCAGRは32.4%と予測されています。また、IT・通信部門は、2022年の965億米ドルから、2027年には3,444億米ドルに増加し、2022年から2027年までのCAGRは29.0%と推定されています。
当レポートでは、世界のXaaS (Everything as a Service) の市場を調査し、市場概要、市場成長への各種影響因子の分析、市場規模の推移・予測、各種区分・地域/主要国別の内訳、特許動向、競合環境、主要企業のプロファイルなどをまとめています。
目次
第1章 イントロダクション
第2章 エグゼクティブサマリー・ハイライト
第3章 業界の見通し
- 市場概要
- XaaSの成熟段階
- バリューチェーン分析
- PESTLE分析
- ポーターのファイブフォース分析
- COVID-19:市場への影響の評価
第4章 市場力学
- 市場力学
- 市場促進要因
- 市場課題
- 市場機会
- XaaSの将来性
第5章 市場内訳:タイプ別
- 概要
- SaaS (Software as a Service)
- PaaS (Platform as a Service)
- IaaS (Infrastructure as a Service)
- DaaS (Device as a Service)
- AaaS (Analytics as a Service)
- UCaaS (Unified Communications as a Service)
- その他
第6章 市場内訳:事業区分別
- 概要
- B2B
- B2C
第7章 市場内訳:組織規模別
- 概要
- 大企業
- 中小企業
第8章 市場内訳:エンドユーザー産業別
- 概要
- 銀行・金融サービス・保険 (BFSI)
- 小売
- 製造
- IT・通信
- ヘルスケア
- 政府
- その他
第9章 市場内訳:地域別
- 概要
- 北米
- 欧州
- アジア太平洋
- ラテンアメリカ
- 中東・アフリカ
第10章 特許分析
- 概要
- 特許分析
- 最近付与された主な特許
第11章 競合情勢
- ベンダー情勢
- 市場ランキング分析
- 競合シナリオ
第12章 企業プロファイル
- ADOBE SYSTEMS INC.
- ALIBABA GROUP HOLDING LTD.
- ALPHABET INC.
- AMAZON.COM INC.
- BLACKBOARD INC.
- CISCO SYSTEMS INC.
- DELL TECHNOLOGIES INC.
- HCL TECHNOLOGIES LTD.
- INTERNATIONAL BUSINESS MACHINES CORP.
- MICROSOFT CORP.
- ORACLE CORP.
- SALESFORCE.COM INC.
- SAP SE
- VMWARE INC.
- その他の主要ベンダー
- AUTOMATIC DATA PROCESSING (ADP) LLC
- CITRIX SYSTEMS INC.
- INFOR INC.
- INTUIT INC.
- MCAFEE CORP.
- ORANGE BUSINESS SERVICES
- RACKSPACE TECHNOLOGY
- SOLUTION ANALYSTS PVT. LTD.
- WORKDAY INC.
List of Tables
- Summary Table : Global Market for XaaS, by End-use Industry, Through 2027
- Table 1 : PESTLE Analysis
- Table 2 : Global Market for XaaS, by Type, Through 2027
- Table 3 : Global Market for XaaS, by Business Type, Through 2027
- Table 4 : Global Market for XaaS, by Organization Size, Through 2027
- Table 5 : Global Market for XaaS, by End-use Industry, Through 2027
- Table 6 : Global Market for XaaS, by Region, Through 2027
- Table 7 : North American Market for XaaS, by Country, Through 2027
- Table 8 : North American Market for XaaS, by Type, Through 2027
- Table 9 : North American Market for XaaS, by Business Type, Through 2027
- Table 10 : North American Market for XaaS, by Organization Size, Through 2027
- Table 11 : North American Market for XaaS, by End-use Industry, Through 2027
- Table 12 : European Market for XaaS, by Country, Through 2027
- Table 13 : European Market for XaaS, by Type, Through 2027
- Table 14 : European Market for XaaS, by Business Type, Through 2027
- Table 15 : European Market for XaaS, by Organization Size, Through 2027
- Table 16 : European Market for XaaS, by End-use Industry, Through 2027
- Table 17 : Asia-Pacific Market for XaaS, by Country, Through 2027
- Table 18 : Asia-Pacific Market for XaaS, by Type, Through 2027
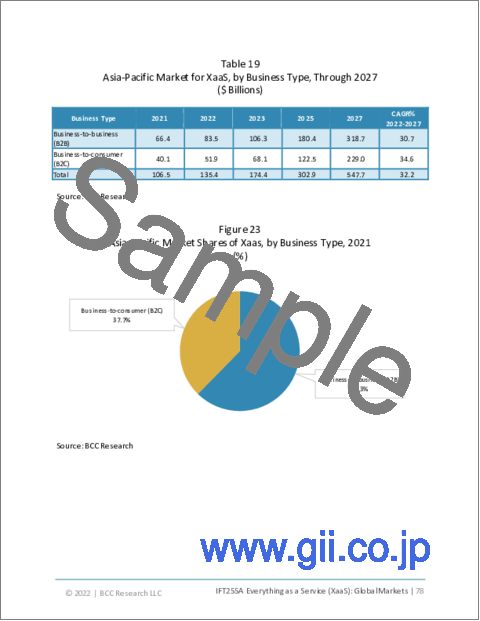
- Table 19 : Asia-Pacific Market for XaaS, by Business Type, Through 2027
- Table 20 : Asia-Pacific Market for XaaS, by Organization Size, Through 2027
- Table 21 : Asia-Pacific Market for XaaS, by End-use Industry, Through 2027
- Table 22 : Latin American Market for XaaS, by Country, Through 2027
- Table 23 : Latin American Market for XaaS, by Type, Through 2027
- Table 24 : Latin American Market for XaaS, by Business Type, Through 2027
- Table 25 : Latin American Market for XaaS, by Organization Size, Through 2027
- Table 26 : Latin American Market for XaaS, by End-use Industry, Through 2027
- Table 27 : Middle East and African Market for XaaS, by Type, Through 2027
- Table 28 : Middle East and African Market for XaaS, by Business Type, Through 2027
- Table 29 : Middle East and African Market for XaaS, by Organization Size, Through 2027
- Table 30 : Middle East and African Market for XaaS, by End-use Industry, Through 2027
- Table 31 : Global Market for XaaS Vendor Landscape
- Table 32 : Top Five Key Market Players of the Market for XaaS, 2021
- Table 33 : Global Competitive Scenario for XaaS, by Market Players, 2019-2022
- Table 34 : Adobe Systems Inc.: Financial Overview, 2019-2021
- Table 35 : Adobe Systems Inc.: Product Portfolio
- Table 36 : Adobe Systems Inc.: Recent Developments, 2020 and 2021
- Table 37 : Alibaba Group Holding Ltd.: Financial Overview, 2019-2021
- Table 38 : Alibaba Group Holding Ltd.: Product Portfolio
- Table 39 : Alibaba Group Holding Ltd.: Recent Development, 2021
- Table 40 : Alphabet Inc.: Financial Overview, 2019-2021
- Table 41 : Alphabet Inc.: Product Portfolio
- Table 42 : Alphabet Inc.: Recent Development, 2022
- Table 43 : Amazon.com Inc.: Financial Overview, 2019-2021
- Table 44 : Amazon.com Inc.: Product Portfolio
- Table 45 : Blackboard Inc.: Financial Overview, 2021
- Table 46 : Blackboard Inc.: Product Portfolio
- Table 47 : Cisco Systems Inc.: Financial Overview, 2019-2021
- Table 48 : Cisco Systems Inc.: Product Portfolio
- Table 49 : Cisco Systems Inc.: Recent Developments, 2021 and 2022
- Table 50 : Dell Technologies Inc.: Financial Overview, 2019-2021
- Table 51 : Dell Technologies Inc.: Product Portfolio
- Table 52 : Dell Technologies Inc.: Recent Developments, 2021 and 2022
- Table 53 : HCL Technologies Ltd.: Financial Overview, 2019-2021
- Table 54 : HCL Technologies Ltd.: Product Portfolio
- Table 55 : HCL Technologies Ltd.: Recent Development, 2022
- Table 56 : International Business Machines Corp.: Financial Overview, 2019-2021
- Table 57 : International Business Machines Corp.: Product Portfolio
- Table 58 : International Business Machines Corp.: Recent Developments, 2021 and 2022
- Table 59 : Microsoft Corp.: Financial Overview, 2019-2021
- Table 60 : Microsoft Corp.: Product Portfolio
- Table 61 : Microsoft Corp.: Recent Developments, 2021 and 2022
- Table 62 : Oracle Corp.: Financial Overview, 2019-2021
- Table 63 : Oracle Corp.: Product Portfolio
- Table 64 : Oracle Corp.: Recent Development, 2021
- Table 65 : Salesforce.com Inc.: Financial Overview, 2019-2021
- Table 66 : Salesforce.com Inc.: Product Portfolio
- Table 67 : SAP SE: Financial Overview, 2019-2021
- Table 68 : SAP SE: Product Portfolio
- Table 69 : SAP SE: Recent Development, 2021
- Table 70 : VMware Inc.: Financial Overview, 2019-2021
- Table 71 : VMware Inc.: Product Portfolio
- Table 72 : VMware Inc.: Recent Developments, 2021
List of Figures
- Summary Figure : Global Market Shares of Xaas, by End-use Industry, 2021
- Figure 1 : XaaS Maturity Phases
- Figure 2 : Value Chain Analysis
- Figure 3 : Porter's Five Forces Analysis
- Figure 4 : Global Market for XaaS Major Trends
- Figure 5 : Global Market for XaaS Major Trends
- Figure 6 : Global Market Shares of Xaas, by Type, 2021
- Figure 7 : Global Market Shares of Xaas, by Business Type, 2021
- Figure 8 : Global Market Shares of Xaas, by Organization Size, 2021
- Figure 9 : Global Market Shares of Xaas, by End-use Industry, 2021
- Figure 10 : Global Market Shares of Xaas, by Region, 2021
- Figure 11 : North American Market Shares of Xaas, by Country, 2021
- Figure 12 : North American Market Shares of Xaas, by Type, 2021
- Figure 13 : North American Market Shares of Xaas, by Business Type, 2021
- Figure 14 : North American Market Shares of Xaas, by Organization Size, 2021
- Figure 15 : North American Market Shares of Xaas, by End-use Industry, 2021
- Figure 16 : European Market Shares of Xaas, by Country, 2021
- Figure 17 : European Market Shares of Xaas, by Type, 2021
- Figure 18 : European Market Shares of Xaas, by Business Type, 2021
- Figure 19 : European Market Shares of Xaas, by Organization Size, 2021
- Figure 20 : European Market Shares of Xaas, by End-use Industry, 2021
- Figure 21 : Asia-Pacific Market Shares of Xaas, by Country, 2021
- Figure 22 : Asia-Pacific Market Shares of Xaas, by Type, 2021
- Figure 23 : Asia-Pacific Market Shares of Xaas, by Business Type, 2021
- Figure 24 : Asia-Pacific Market Shares of Xaas, by Organization Size, 2021
- Figure 25 : Asia-Pacific Market Shares of Xaas, by End-use Industry, 2021
- Figure 26 : Latin American Market Shares of Xaas, by Country, 2021
- Figure 27 : Latin American Market Shares of Xaas, by Type, 2021
- Figure 28 : Latin American Market Shares of Xaas, by Business Type, 2021
- Figure 29 : Latin American Market Shares of Xaas, by Organization Size, 2021
- Figure 30 : Latin American Market Shares of Xaas, by End-use Industry, 2021
- Figure 31 : Middle East and African Market Shares of Xaas, by Type, 2021
- Figure 32 : Middle East and African Market Shares of Xaas, by Business Type, 2021
- Figure 33 : Middle East and African Market Shares of Xaas, by Organization Size, 2021
- Figure 34 : Middle East and African Market Shares of Xaas, by End-use Industry, 2021
- Figure 35 : Number of XaaS Patents, by Year, 2018-2022
- Figure 36 : Shares of XaaS Patents, by Region/Country, 2021
- Figure 37 : Adobe Systems Inc.: Revenue Share, by Product Type, 2021
- Figure 38 : Adobe Systems Inc.: Revenue Share, by Region, 2021
- Figure 39 : Alibaba Group Holding Ltd.: Revenue Share, by Business Segment, 2021
- Figure 40 : Alphabet Inc.: Revenue Share, by Business Segment, 2021
- Figure 41 : Alphabet Inc.: Revenue Share, by Region, 2021
- Figure 42 : Amazon.com Inc.: Revenue Share, by Region/Country, 2021
- Figure 43 : Cisco Systems Inc.: Revenue Share, by Business Segment, 2021
- Figure 44 : Cisco Systems Inc.: Revenue Share, by Region, 2021
- Figure 45 : Dell Technologies Inc.: Revenue Share, by Business Segment, 2021
- Figure 46 : Dell Technologies Inc.: Revenue Share, by Region, 2021
- Figure 47 : HCL Technologies Ltd.: Revenue Share, by Business Segment, 2021
- Figure 48 : HCL Technologies Ltd.: Revenue Share, by Region/Country, 2021
- Figure 49 : International Business Machines Corp.: Revenue Share, by Business Segment, 2021
- Figure 50 : International Business Machines Corp.: Revenue Share, by Region, 2021
- Figure 51 : Microsoft Corp.: Revenue Share, by Business Segment, 2021
- Figure 52 : Microsoft Corp.: Revenue Share, by Region, 2021
- Figure 53 : Oracle Corp.: Revenue Share, by Business Segment, 2021
- Figure 54 : Oracle Corp.: Revenue Share, by Region, 2021
- Figure 55 : Salesforce.com Inc.: Revenue Share, by Business Segment, 2021
- Figure 56 : Salesforce.com Inc.: Revenue Share, by Region, 2021
- Figure 57 : SAP SE: Revenue Share, by Business Segment, 2021
- Figure 58 : SAP SE: Revenue Share, by Region, 2021
- Figure 59 : VMware Inc.: Revenue Share, by Business Segment, 2021
- Figure 60 : VMware Inc.: Revenue Share, by Region/Country, 2021
Highlights:
The global everything as a service (XaaS) market should reach $1.8 trillion by 2027 from $530.2 billion in 2022 at a compound annual growth rate (CAGR) of 28.0% for the forecast period of 2022 to 2027.
Retail segment of the global XaaS market is expected to grow from $98.3 billion in 2022 to $400.5 billion in 2027 at a CAGR of 32.4% for the forecast period of 2022 to 2027.
IT & telecom segment of the global XaaS market is expected to grow from $96.5 billion in 2022 to $344.4 billion in 2027 at a CAGR of 29.0% for the forecast period of 2022 to 2027.
Report Scope:
The scope of the report includes the global market of commercially deployed everything as a service products, solutions, and services.
- Everything as Service-based products that are in the pilot phase or are live for demonstration purposes have not been considered in the calculation of the overall market size.
- The market size includes the market of both everything as a service type, business, and organization size.
- The final market estimates and forecasts from industry experts are also aligned in the report.
- The report includes both services type and end-use industries for the calculation of overall market size.
- Cloud-based software, solutions and services have not been considered in the report.
Report Includes:
- 44 data tables and 29 additional tables
- A detailed overview and up-to-date analysis of the global everything as a service (XaaS) market
- Analyses of the global market trends, with historic revenue data for 2021, estimates for 2022, forecasts for 2023 and 2025, and projections of five-year compound annual growth rates (CAGRs) through 2027
- Highlights of the upcoming market potential for everything as a service (XaaS), and areas of focus to forecast this market into various segments and subsegments
- Estimation of the actual market size and revenue forecast for XaaS market in USD billion values, and their corresponding market share analysis based on type of technology, business model, size of enterprise, end-use industry and geographic region
- Updated information on key market drivers and opportunities, industry shifts and regulations, and other demographic factors that will influence this market demand in the coming years (2022-2027)
- Identification of the companies that are best positioned to meet this demand because of their proprietary technologies, strategic alliances, or other competitive advantages
- Assessment of the underlying technological, environmental, legal/regulatory, and political trends that may influence the size and nature of the market
- Examination of the vendor landscape of global XaaS market comprising key market participants, their global rankings, financial analysis, and competitive scenario for XaaS
- Descriptive company profiles of the market leading players, including Alphabet Inc., Dell Technologies Inc., HCL Technologies Ltd., Microsoft Corp. and SAP SE
Table of Contents
Chapter 1 Introduction
- 1.1 Study Goals and Objectives
- 1.2 Reasons for Doing This Study
- 1.3 Scope of Report
- 1.4 Intended Audiences
- 1.5 Information Sources
- 1.6 Research Methodology
- 1.7 Geographic Breakdown
- 1.8 Analyst's Credentials
- 1.9 BCC Custom Research
- 1.10 Related BCC Research Reports
Chapter 2 Executive Summary and Highlights
- 2.1 Executive Summary
Chapter 3 Industry Outlook
- 3.1 Market Overview
- 3.2 XaaS Maturity Phases
- 3.2.1 Crawl Phase
- 3.2.2 Walk Phase
- 3.2.3 Run Phase
- 3.2.4 Fly Phase
- 3.3 Value Chain Analysis
- 3.3.1 Supply Chain
- 3.3.2 Demand Chain
- 3.4 PESTLE Analysis
- 3.5 Porter's Five Forces Analysis
- 3.6 Assessment of COVID-19's Impact on the Market
Chapter 4 Market Dynamics
- 4.1 Market Dynamics
- 4.2 Market Drivers
- 4.2.1 Increasing Adoption of Cloud-Based Monitoring Systems
- 4.2.2 Growing Requirement of Scalable Storage Services
- 4.2.3 Increased Demand for Pay-As-You-Go Subscription Model
- 4.3 Market Challenges
- 4.3.1 Data Confidentiality and Privacy Concerns
- 4.3.2 Lack of XaaS Integrations
- 4.4 Market Opportunities
- 4.4.1 Growing Adoption of IoT as a Service and Artificial Intelligence as a Service
- 4.4.2 Rising Adoption of Cloud Services in the Healthcare Industry
- 4.5 Future of Everything as a Service (XaaS)
- 4.5.1 Signals of Change
Chapter 5 Market Breakdown by Type
- 5.1 Overview
- 5.2 Software as a Service (SaaS)
- 5.3 Platform as a Service (PaaS)
- 5.4 Infrastructure as a Service (IaaS)
- 5.5 Device as a Service (DaaS)
- 5.6 Analytics as a Service (AaaS)
- 5.7 Unified Communications as a Service (UCaaS)
- 5.8 Others
Chapter 6 Market Breakdown by Business Type
- 6.1 Overview
- 6.2 Business-to-Business (B2B)
- 6.3 Business-to-Consumer (B2C)
Chapter 7 Market Breakdown by Organization Size
- 7.1 Overview
- 7.2 Large Enterprises
- 7.3 Small and Medium Enterprises
Chapter 8 Market Breakdown by End-use Industry
- 8.1 Overview
- 8.2 Banking, Financial Services and Insurance (BFSI)
- 8.3 Retail
- 8.4 Manufacturing
- 8.5 IT & Telecom
- 8.6 Healthcare
- 8.7 Government
- 8.8 Others
Chapter 9 Market Breakdown by Region
- 9.1 Overview
- 9.2 North America
- 9.3 Europe
- 9.4 Asia-Pacific
- 9.5 Latin America
- 9.6 Middle East and Africa
Chapter 10 Patent Analysis
- 10.1 Overview
- 10.2 Patent Analysis
- 10.3 Key Recently Granted Patents
Chapter 11 Competitive Landscape
- 11.1 Vendor Landscape
- 11.2 Market Ranking Analysis
- 11.3 Competitive Scenario
Chapter 12 Company Profiles
- ADOBE SYSTEMS INC.
- ALIBABA GROUP HOLDING LTD.
- ALPHABET INC.
- AMAZON.COM INC.
- BLACKBOARD INC.
- CISCO SYSTEMS INC.
- DELL TECHNOLOGIES INC.
- HCL TECHNOLOGIES LTD.
- INTERNATIONAL BUSINESS MACHINES CORP.
- MICROSOFT CORP.
- ORACLE CORP.
- SALESFORCE.COM INC.
- SAP SE
- VMWARE INC.
- Other Prominent Vendors
- AUTOMATIC DATA PROCESSING (ADP) LLC
- CITRIX SYSTEMS INC.
- INFOR INC.
- INTUIT INC.
- MCAFEE CORP.
- ORANGE BUSINESS SERVICES
- RACKSPACE TECHNOLOGY
- SOLUTION ANALYSTS PVT. LTD.
- WORKDAY INC.