|
|
市場調査レポート
商品コード
1526034
電気自動車および燃料電池自動車:世界市場Electric Vehicles and Fuel Cell Vehicles: Global Markets |
||||||

|
|||||||
|
|||||||

| 電気自動車および燃料電池自動車:世界市場 |
|
出版日: 2024年08月01日
発行: BCC Research
ページ情報: 英文 171 Pages
納期: 即納可能
|

全表示
- 概要
- 図表
- 目次
世界の電気自動車および燃料電池自動車の市場規模は、2023年の6,559億米ドル、2024年の7,580億米ドルから、予測期間中はCAGR 18.6%で推移し、2029年には1兆8,000億米ドルに達すると予測されています。
BEV、HEV、PHEVを含むEVの部門は、2024年の7,512億米ドルから、CAGR 18.2%で推移し、2029年には1兆7,000億米ドルに達すると予測されています。また、FCEVの部門は、2024年の68億米ドルから、CAGR 43.3%で推移し、2029年には410億米ドルに達すると予測されています。
当レポートでは、電気自動車および燃料電池自動車の世界市場を調査し、市場概要、市場影響因子および市場機会の分析、新興技術および技術開発の動向、市場規模の推移・予測、各種区分・地域別の詳細分析、競合情勢、主要企業のプロファイルなどをまとめています。
目次
第1章 エグゼクティブサマリー
- 市場見通し
- 調査範囲
- 市場概要
第2章 市場概要
- 現在の市場概要と将来のシナリオ
- 電気自動車のサプライチェーン分析
- 原材料の採掘
- 電池セル製造および電池パック組み立て
- EV部品の組み立て
- EV製造
- EVサービス
- 電池のリサイクルと廃棄
- 燃料電池電気自動車のサプライチェーン分析
- 電気自動車のポーターのファイブフォース分析
- 燃料電池電気自動車のポーターのファイブフォース分析
- ロシア・ウクライナ戦争が世界市場に与える影響
第3章 市場力学
- 概要
- 市場促進要因
- 電気自動車の販売の世界的増加
- 電池コストの低下
- 石油価格の上昇が消費者のEVへのシフトを促進
- 市場抑制要因
- 新興諸国における不十分な電気自動車充電インフラ
- EV急速充電インフラ構築にかかる初期コストの高さ
- FCEVの生産コストの高さ
- 市場機会
- 公共交通機関の電化に対する政府の支援
- 水素インフラを推進する政府の取り組み
- ケーススタディ
- Tesla
- Toyota Motor Corp.
- 規制の枠組みと取り組み
- ドイツ
- 米国
- カナダ
- インド
- 中国
第4章 新興技術と開発
- 概要
- 電気自動車および燃料電池自動車の主要新興技術
- 自動充電
- 3次元EVプリント
- V2G EV充電ステーション
- EV導入におけるAIとIoTソリューションの新たな役割
- 特許分析
- 概要
- 公開された主要特許
- 主な調査結果
第5章 市場セグメンテーション分析
- セグメンテーションの内訳
- 世界のEVおよびFCEV市場:推進タイプ別
- EV
- PHEV
- ハイブリッド
- 燃料電池車
- 世界のEVおよびFCEV市場:車両タイプ別
- 乗用車
- 二輪車
- トラックとバン
- バス
- 三輪車
- 世界のEVおよびFCEV市場:動力源別
- リチウムイオン
- 鉛蓄電池
- ニッケル水素
- 燃料電池
- 地理的内訳
- 世界のEVおよびFCEV市場:地域別
- 北米
- 欧州
- アジア太平洋
- その他の地域
第6章 競合情報
- 概要
- 市場シェア分析
- 主な展開
第7章 電気自動車および燃料電池自動車市場における持続可能性:ESGの観点
- 概要
- 環境への影響
- 社会的影響
- ガバナンスの影響
- 世界の電気自動車・燃料電池自動車市場におけるESGの現状
- 世界の電気自動車および燃料電池自動車市場におけるESGに対する消費者の態度
- BCCによる総論
第8章 付録
- 調査手法
- 調査ステップ
- 参考文献
- 略語
- 企業プロファイル
- BMW AG
- BYD CO. LTD.
- CHONGQING CHANGAN AUTOMOBILE CO. LTD.
- GAC INTERNATIONAL CO. LTD.
- GENERAL MOTORS
- GREAT WALL MOTOR
- HYUNDAI MOTOR CO.
- LI AUTO INC.
- MERCEDES-BENZ GROUP AG
- SAIC MOTOR CORP. LTD.
- STELLANTIS N.V.
- TESLA
- TOYOTA MOTOR CORP.
- VOLKSWAGEN GROUP
- VOLVO CAR CORP.
- ZHEJIANG GEELY HOLDING GROUP
- 世界の電気自動車および燃料電池自動車市場における小規模企業
List of Tables
- Summary Table : Global Electric Vehicle and Fuel Cell Vehicle Market, by Propulsion Type, Through 2029
- Table 1 : Indian EV Charging Station Cost Breakdown
- Table 2 : Granted Patent Count for Electric Vehicles and Fuel Cell Vehicles, by Year, 2021-2024
- Table 3 : Globally Published Patents for Electric Vehicles and Fuel Cell Vehicles, 2023-2024
- Table 4 : Global Electric Vehicle and Fuel Cell Vehicle Market, by Propulsion Type, Through 2029
- Table 5 : Global Electric Vehicle and Fuel Cell Vehicle Market Volume, by Propulsion Type, Through 2029
- Table 6 : Global Electric Vehicle and Fuel Cell Vehicle Market for BEV, by Region, Through 2029
- Table 7 : Global Electric Vehicle and Fuel Cell Vehicle Market Volume for BEV, by Region, Through 2029
- Table 8 : Global Electric Vehicle and Fuel Cell Vehicle Market for PHEV, by Region, Through 2029
- Table 9 : Global Electric Vehicle and Fuel Cell Vehicle Market Volume for PHEV, by Region, Through 2029
- Table 10 : Global Electric Vehicle and Fuel Cell Vehicle Market for HEV, by Region, Through 2029
- Table 11 : Global Electric Vehicle and Fuel Cell Vehicle Market Volume for HEV, by Region, Through 2029
- Table 12 : Global Electric Vehicle and Fuel Cell Vehicle Market for FCEV, by Region, Through 2029
- Table 13 : Global Electric Vehicle and Fuel Cell Vehicle Market Volume for FCEV, by Region, Through 2029
- Table 14 : Global Electric Vehicle and Fuel Cell Vehicle Market, by Vehicle Type, Through 2029
- Table 15 : Global Electric Vehicle and Fuel Cell Vehicle Market Volume, by Vehicle Type, Through 2029
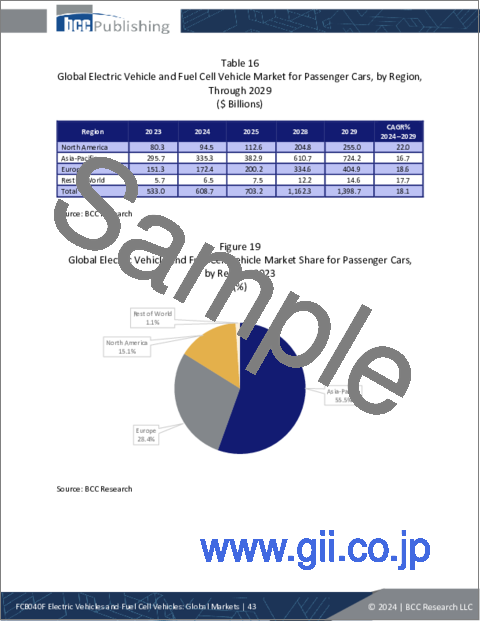
- Table 16 : Global Electric Vehicle and Fuel Cell Vehicle Market for Passenger Cars, by Region, Through 2029
- Table 17 : Global Electric Vehicle and Fuel Cell Vehicle Market Volume for Passenger Cars, by Region, Through 2029
- Table 18 : Global Electric Vehicle and Fuel Cell Vehicle Market for Two-Wheelers, by Region, Through 2029
- Table 19 : Global Electric Vehicle and Fuel Cell Vehicle Market Volume for Two-Wheelers, by Region, Through 2029
- Table 20 : Global Electric Vehicle and Fuel Cell Vehicle Market for Trucks and Vans, by Region, Through 2029
- Table 21 : Global Electric Vehicle and Fuel Cell Vehicle Market Volume for Trucks and Vans, by Region, Through 2029
- Table 22 : Global Electric Vehicle and Fuel Cell Vehicle Market for Buses, by Region, Through 2029
- Table 23 : Global Electric Vehicle and Fuel Cell Vehicle Market Volume for Buses, by Region, Through 2029
- Table 24 : Global Electric Vehicle and Fuel Cell Vehicle Market for Three-Wheelers, by Region, Through 2029
- Table 25 : Global Electric Vehicle and Fuel Cell Vehicle Market Volume for Three-Wheelers, by Region, Through 2029
- Table 26 : Global Electric Vehicle and Fuel Cell Vehicle Market, by Power Source, Through 2029
- Table 27 : Global Electric Vehicle and Fuel Cell Vehicle Market Volume, by Power Source, Through 2029
- Table 28 : Global Electric Vehicle and Fuel Cell Vehicle Market for Lithium-ion Battery, by Region, Through 2029
- Table 29 : Global Electric Vehicle and Fuel Cell Vehicle Market Volume for Lithium-ion Battery, by Region, Through 2029
- Table 30 : Global Electric Vehicle and Fuel Cell Vehicle Market for Lead-acid Battery, by Region, Through 2029
- Table 31 : Global Electric Vehicle and Fuel Cell Vehicle Market Volume for Lead-acid Battery, by Region, Through 2029
- Table 32 : Global Electric Vehicle and Fuel Cell Vehicle Market for Nickel Metal Hydride Batteries, by Region, Through 2029
- Table 33 : Global Electric Vehicle and Fuel Cell Vehicle Market Volume for Nickel Metal Hydride Batteries, by Region, Through 2029
- Table 34 : Global Electric Vehicle and Fuel Cell Vehicle Market for Fuel Cell Battery, by Region, Through 2029
- Table 35 : Global Electric Vehicle and Fuel Cell Vehicle Market Volume for Fuel Cell Battery, by Region, Through 2029
- Table 36 : Global Electric Vehicle and Fuel Cell Vehicle Market, by Region, Through 2029
- Table 37 : Global Electric Vehicle and Fuel Cell Vehicle Market Volume, by Region, Through 2029
- Table 38 : North American Electric Vehicle and Fuel Cell Vehicle Market, by Propulsion Type, Through 2029
- Table 39 : North American Electric Vehicle and Fuel Cell Vehicle Market Volume, by Propulsion Type, Through 2029
- Table 40 : North American Electric Vehicle and Fuel Cell Vehicle Market, by Vehicle Type, Through 2029
- Table 41 : North American Electric Vehicle and Fuel Cell Vehicle Market Volume, by Vehicle Type, Through 2029
- Table 42 : North American Electric Vehicle and Fuel Cell Vehicle Market, by Power Source, Through 2029
- Table 43 : North American Electric Vehicle and Fuel Cell Vehicle Market Volume, by Power Source, Through 2029
- Table 44 : North American Electric Vehicle and Fuel Cell Vehicle Market, by Country, Through 2029
- Table 45 : North American Electric Vehicle and Fuel Cell Vehicle Market Volume, by Country, Through 2029
- Table 46 : European Electric Vehicle and Fuel Cell Vehicle Market, by Propulsion Type, Through 2029
- Table 47 : European Electric Vehicle and Fuel Cell Vehicle Market Volume, by Propulsion Type, Through 2029
- Table 48 : European Electric Vehicle and Fuel Cell Vehicle Market, by Vehicle Type, Through 2029
- Table 49 : European Electric Vehicle and Fuel Cell Vehicle Market Volume, by Vehicle Type, Through 2029
- Table 50 : European Electric Vehicle and Fuel Cell Vehicle Market, by Power Source, Through 2029
- Table 51 : European Electric Vehicle and Fuel Cell Vehicle Market Volume, by Power Source, Through 2029
- Table 52 : European Electric Vehicle and Fuel Cell Vehicle Market, by Country, Through 2029
- Table 53 : European Electric Vehicle and Fuel Cell Vehicle Market Volume, by Country, Through 2029
- Table 54 : Asia-Pacific Electric Vehicle and Fuel Cell Vehicle Market, by Propulsion Type, Through 2029
- Table 55 : Asia-Pacific Electric Vehicle and Fuel Cell Vehicle Market Volume, by Propulsion Type, Through 2029
- Table 56 : Asia-Pacific Electric Vehicle and Fuel Cell Vehicle Market, by Vehicle Type, Through 2029
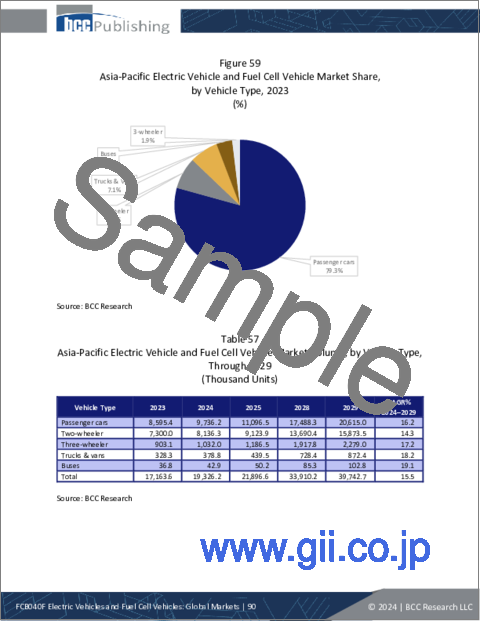
- Table 57 : Asia-Pacific Electric Vehicle and Fuel Cell Vehicle Market Volume, by Vehicle Type, Through 2029
- Table 58 : Asia-Pacific Electric Vehicle and Fuel Cell Vehicle Market, by Power Source, Through 2029
- Table 59 : Asia-Pacific Electric Vehicle and Fuel Cell Vehicle Market Volume, by Power Source, Through 2029
- Table 60 : Asia-Pacific Electric Vehicle and Fuel Cell Vehicle Market, by Country, Through 2029
- Table 61 : Asia-Pacific Electric Vehicle and Fuel Cell Vehicle Market Volume, by Country, Through 2029
- Table 62 : Rest of World Electric Vehicle and Fuel Cell Vehicle Market, by Propulsion Type, Through 2029
- Table 63 : Rest of World Electric Vehicle and Fuel Cell Vehicle Market Volume, by Propulsion Type, Through 2029
- Table 64 : Rest of World Electric Vehicle and Fuel Cell Vehicle Market, by Vehicle Type, Through 2029
- Table 65 : Rest of World Electric Vehicle and Fuel Cell Vehicle Market Volume, by Vehicle Type, Through 2029
- Table 66 : Rest of World Electric Vehicle and Fuel Cell Vehicle Market, by Power Source, Through 2029
- Table 67 : Rest of World Electric Vehicle and Fuel Cell Vehicle Market Volume, by Power Source, Through 2029
- Table 68 : Rest of World Electric Vehicle and Fuel Cell Vehicle Market, by Sub-region, Through 2029
- Table 69 : Rest of World Electric Vehicle and Fuel Cell Vehicle Market Volume, by Sub-region, Through 2029
- Table 70 : Partnerships and Agreements in the Global Electric Vehicle and Fuel Cell Vehicle Market, 2022-2024
- Table 71 : Company Expansions in the Global Electric Vehicle and Fuel Cell Vehicle Market, 2022-2024
- Table 72 : Business Acquisitions in the Global Electric Vehicle and Fuel Cell Vehicle Market, 2023
- Table 73 : ESG Risk Rating Metric, by Company, 2023
- Table 74 : Acronyms Used in the Report
- Table 75 : BMW AG: Company Snapshot
- Table 76 : BMW AG: Financial Performance, FY 2022 and FY 2023
- Table 77 : BMW AG: Product Portfolio
- Table 78 : BMW AG: News/Key Developments, 2023
- Table 79 : BYD Co. Ltd.: Company Snapshot
- Table 80 : BYD Co. Ltd.: Financial Performance, FY 2022 and FY 2023
- Table 81 : BYD Co. Ltd.: Product Portfolio
- Table 82 : BYD Co. Ltd.: News/Key Developments, 2023 and 2024
- Table 83 : Chongqing Changan Automobile Co. Ltd.: Company Snapshot
- Table 84 : Chongqing Changan Automobile Co. Ltd.: Financial Performance, FY 2022 and FY 2023
- Table 85 : Chongqing Changan Automobile Co. Ltd.: Product Portfolio
- Table 86 : GAC International Co. Ltd.: Company Snapshot
- Table 87 : GAC International Co. Ltd.: Financial Performance, FY 2022 and FY 2023
- Table 88 : GAC International Co. Ltd.: Product Portfolio
- Table 89 : GAC International Co. Ltd.: News/Key Developments, 2023 and 2024
- Table 90 : General Motors: Company Snapshot
- Table 91 : General Motors: Financial Performance, FY 2022 and FY 2023
- Table 92 : General Motors: Product Portfolio
- Table 93 : General Motors: News/Key Developments, 2022-2024
- Table 94 : Great Wall Motor: Company Snapshot
- Table 95 : Great Wall Motor: Financial Performance, FY 2022 and FY 2023
- Table 96 : Great Wall Motor: Product Portfolio
- Table 97 : Great Wall Motor: News/Key Developments, 2023 and 2024
- Table 98 : Hyundai Motor Co.: Company Snapshot
- Table 99 : Hyundai Motor Co.: Financial Performance, FY 2022 and FY 2023
- Table 100 : Hyundai Motor Co.: Product Portfolio
- Table 101 : Hyundai Motor Co.: News/Key Developments, 2023 and 2024
- Table 102 : Li Auto Inc.: Company Snapshot
- Table 103 : Li Auto Inc.: Financial Performance, FY 2022 and FY 2023
- Table 104 : Li Auto Inc.: Product Portfolio
- Table 105 : Mercedes-Benz Group AG: Company Snapshot
- Table 106 : Mercedes-Benz Group AG: Financial Performance, FY 2022 and FY 2023
- Table 107 : Mercedes-Benz Group AG: Product Portfolio
- Table 108 : SAIC Motor Corp. Ltd.: Company Snapshot
- Table 109 : SAIC Motor Corp. Ltd.: Financial Performance, FY 2022 and FY 2023
- Table 110 : SAIC Motor Corp. Ltd.: Product Portfolio
- Table 111 : Stellantis N.V.: Company Snapshot
- Table 112 : Stellantis N.V.: Financial Performance, FY 2022 and FY 2023
- Table 113 : Stellantis N.V.: Product Portfolio
- Table 114 : Stellantis N.V.: News/Key Developments, 2023 and 2024
- Table 115 : Tesla: Company Snapshot
- Table 116 : Tesla: Financial Performance, FY 2022 and FY 2023
- Table 117 : Tesla: Product Portfolio
- Table 118 : Tesla: News/Key Developments, 2024
- Table 119 : Toyota Motor Corp.: Company Snapshot
- Table 120 : Toyota Motor Corp.: Financial Performance, FY 2022 and FY 2023
- Table 121 : Toyota Motor Corp.: Product Portfolio
- Table 122 : Toyota Motor Corp.: News/Key Developments, 2022-2024
- Table 123 : Volkswagen Group: Company Snapshot
- Table 124 : Volkswagen Group: Financial Performance, FY 2022 and FY 2023
- Table 125 : Volkswagen Group: Product Portfolio
- Table 126 : Volkswagen Group: News/Key Developments, 2024
- Table 127 : Volvo Car Corp.: Company Snapshot
- Table 128 : Volvo Car Corp.: Financial Performance, FY 2022 and FY 2023
- Table 129 : Volvo Car Corp.: Product Portfolio
- Table 130 : Volvo Car Corp.: News/Key Developments, 2023
- Table 131 : Zhejiang Geely Holding Group: Company Snapshot
- Table 132 : Zhejiang Geely Holding Group: Financial Performance, FY 2022 and FY 2023
- Table 133 : Zhejiang Geely Holding Group: Product Portfolio
- Table 134 : Zhejiang Geely Holding Group: News/Key Developments, 2023 and 2024
- Table 135 : Small Players in the Global Electric Vehicles and Fuel Cell Vehicles Market
List of Figures
- Summary Figure : Global Electric Vehicle and Fuel Cell Vehicle Market Share, by Propulsion Type, 2023
- Figure 1 : Supply Chain for the Global Electric Vehicles Market
- Figure 2 : Supply Chain for the Global Fuel Cell Electric Vehicles Market
- Figure 3 : Global Market Dynamics of Electric Vehicles and Fuel Cell Electric Vehicles
- Figure 4 : Global Electric Car Sales, by Select Country/Region, 2020-2023
- Figure 5 : Lithium-ion Price Chart, 2020-2023
- Figure 6 : Patent Share of Electric Vehicles and Fuel Cell Vehicles, by Applicant, 2023
- Figure 7 : Global Electric Vehicle and Fuel Cell Vehicle Market Share, by Propulsion Type, 2023
- Figure 8 : Global Electric Vehicle and Fuel Cell Vehicle Market Volume Share, by Propulsion Type, 2023
- Figure 9 : Global Electric Vehicle and Fuel Cell Vehicle Market Share for BEV, by Region, 2023
- Figure 10 : Global Electric Vehicle and Fuel Cell Vehicle Market Volume Share for BEV, by Region, 2023
- Figure 11 : Global Electric Vehicle and Fuel Cell Vehicle Market Share for PHEV, by Region, 2023
- Figure 12 : Global Electric Vehicle and Fuel Cell Vehicle Market Volume Share for PHEV, by Region, 2023
- Figure 13 : Global Electric Vehicle and Fuel Cell Vehicle Market Volume Share for PHEV, by Region, 2023
- Figure 14 : Global Electric Vehicle and Fuel Cell Vehicle Market Volume Share for HEV, by Region, 2023
- Figure 15 : Global Electric Vehicle and Fuel Cell Vehicle Market Share for FCEV, by Region, 2023
- Figure 16 : Global Electric Vehicle and Fuel Cell Vehicle Market Volume Share for FCEV, by Region, 2023
- Figure 17 : Global Electric Vehicle and Fuel Cell Vehicle Market Share, by Vehicle Type, 2023
- Figure 18 : Global Electric Vehicle and Fuel Cell Vehicle Market Volume Share, by Vehicle Type, 2023
- Figure 19 : Global Electric Vehicle and Fuel Cell Vehicle Market Share for Passenger Cars, by Region, 2023
- Figure 20 : Global Electric Vehicle and Fuel Cell Vehicle Market Volume Share for Passenger Cars, by Region, 2023
- Figure 21 : Global Electric Vehicle and Fuel Cell Vehicle Market Share for Two-Wheelers, by Region, 2023
- Figure 22 : Global Electric Vehicle and Fuel Cell Vehicle Market Volume Share for Two-Wheelers, by Region, 2023
- Figure 23 : Global Electric Vehicle and Fuel Cell Vehicle Market Share for Trucks and Vans, by Region, 2023
- Figure 24 : Global Electric Vehicle and Fuel Cell Vehicle Market Volume Share for Trucks and Vans, by Region, 2023
- Figure 25 : Global Electric Vehicle and Fuel Cell Vehicle Market Share for Buses, by Region, 2023
- Figure 26 : Global Electric Vehicle and Fuel Cell Vehicle Market Volume Share for Buses, by Region, 2023
- Figure 27 : Global Electric Vehicle and Fuel Cell Vehicle Market Share for Three-Wheelers, by Region, 2023
- Figure 28 : Global Electric Vehicle and Fuel Cell Vehicle Market Volume Share for Three-Wheelers, by Region, 2023
- Figure 29 : Global Electric Vehicle and Fuel Cell Vehicle Market Share, by Power Source, 2023
- Figure 30 : Global Electric Vehicle and Fuel Cell Vehicle Market Volume Share, by Power Source, 2023
- Figure 31 : Global Electric Vehicle and Fuel Cell Vehicle Market Share for Lithium-ion Battery, by Region, 2023
- Figure 32 : Global Electric Vehicle and Fuel Cell Vehicle Market Volume Share for Lithium-ion Battery, by Region, 2023
- Figure 33 : Global Electric Vehicle and Fuel Cell Vehicle Market Share for Lead-acid Battery, by Region, 2023
- Figure 34 : Global Electric Vehicle and Fuel Cell Vehicle Market Volume Share for Lead-acid Battery, by Region, 2023
- Figure 35 : Global Electric Vehicle and Fuel Cell Vehicle Market Share for Nickel Metal Hydride Batteries, by Region, 2023
- Figure 36 : Global Electric Vehicle and Fuel Cell Vehicle Market Volume Share for Nickel Metal Hydride Batteries, by Region, 2023
- Figure 37 : Global Electric Vehicle and Fuel Cell Vehicle Market Share for Fuel Cell Battery, by Region, 2023
- Figure 38 : Global Electric Vehicle and Fuel Cell Vehicle Market Volume Share for Fuel Cell Battery, by Region, 2023
- Figure 39 : Global Electric Vehicle and Fuel Cell Vehicle Market Share, by Region, 2023
- Figure 40 : Global Electric Vehicle and Fuel Cell Vehicle Market Volume Share, by Region, 2023
- Figure 41 : North American Electric Vehicle and Fuel Cell Vehicle Market Share, by Propulsion Type, 2023
- Figure 42 : North American Electric Vehicle and Fuel Cell Vehicle Market Volume Share, by Propulsion Type, 2023
- Figure 43 : North American Electric Vehicle and Fuel Cell Vehicle Market Share, by Vehicle Type, 2023
- Figure 44 : North American Electric Vehicle and Fuel Cell Vehicle Market Volume Share, by Vehicle Type, 2023
- Figure 45 : North American Electric Vehicle and Fuel Cell Vehicle Market Share, by Power Source, 2023
- Figure 46 : North American Electric Vehicle and Fuel Cell Vehicle Market Volume Share, by Power Source, 2023
- Figure 47 : North American Electric Vehicle and Fuel Cell Vehicle Market Share, by Country, 2023
- Figure 48 : North American Electric Vehicle and Fuel Cell Vehicle Market Volume Share, by Country, 2023
- Figure 49 : European Electric Vehicle and Fuel Cell Vehicle Market Share, by Propulsion Type, 2023
- Figure 50 : European Electric Vehicle and Fuel Cell Vehicle Market Volume Share, by Propulsion Type, 2023
- Figure 51 : European Electric Vehicle and Fuel Cell Vehicle Market Share, by Vehicle Type, 2023
- Figure 52 : European Electric Vehicle and Fuel Cell Vehicle Market Volume Share, by Vehicle Type, 2023
- Figure 53 : European Electric Vehicle and Fuel Cell Vehicle Market Share, by Power Source, 2023
- Figure 54 : European Electric Vehicle and Fuel Cell Vehicle Market Volume Share, by Power Source, 2023
- Figure 55 : European Electric Vehicle and Fuel Cell Vehicle Market Share, by Country, 2023
- Figure 56 : European Electric Vehicle and Fuel Cell Vehicle Market Volume Share, by Country, 2023
- Figure 57 : Asia-Pacific Electric Vehicle and Fuel Cell Vehicle Market Share, by Propulsion Type, 2023
- Figure 58 : Asia-Pacific Electric Vehicle and Fuel Cell Vehicle Market Volume Share, by Propulsion Type, 2023
- Figure 59 : Asia-Pacific Electric Vehicle and Fuel Cell Vehicle Market Share, by Vehicle Type, 2023
- Figure 60 : Asia-Pacific Electric Vehicle and Fuel Cell Vehicle Market Volume Share, by Vehicle Type, 2023
- Figure 61 : Asia-Pacific Electric Vehicle and Fuel Cell Vehicle Market Share, by Power Source, 2023
- Figure 62 : Asia-Pacific Electric Vehicle and Fuel Cell Vehicle Market Volume Share, by Power Source, 2023
- Figure 63 : Asia-Pacific Electric Vehicle and Fuel Cell Vehicle Market Share, by Country, 2023
- Figure 64 : Asia-Pacific Electric Vehicle and Fuel Cell Vehicle Market Volume Share, by Country, 2023
- Figure 65 : Rest of World Electric Vehicle and Fuel Cell Vehicle Market Share, by Propulsion Type, 2023
- Figure 66 : Rest of World Electric Vehicle and Fuel Cell Vehicle Market Volume Share, by Propulsion Type, 2023
- Figure 67 : Rest of World Electric Vehicle and Fuel Cell Vehicle Market Share, by Vehicle Type, 2023
- Figure 68 : Rest of World Electric Vehicle and Fuel Cell Vehicle Market Volume Share, by Vehicle Type, 2023
- Figure 69 : Rest of World Electric Vehicle and Fuel Cell Vehicle Market Share, by Power Source, 2023
- Figure 70 : Rest of World Electric Vehicle and Fuel Cell Vehicle Market Volume Share, by Power Source, 2023
- Figure 71 : Rest of World Electric Vehicle and Fuel Cell Vehicle Market Share, by Sub-region, 2023
- Figure 72 : Rest of World Electric Vehicle and Fuel Cell Vehicle Market Volume Share, by Sub-region, 2023
- Figure 73 : Global Electric Vehicle and Fuel Cell Vehicle Market Share, by Company, 2023
- Figure 74 : Research Steps for the Global Electric Vehicles and Fuel Cell Vehicles Market
- Figure 75 : BMW AG: Revenue Share, by Business Unit, FY 2023
- Figure 76 : BMW AG: Revenue Share, by Country/Region, FY 2023
- Figure 77 : BYD Co. Ltd.: Revenue Share, by Business Unit, FY 2023
- Figure 78 : BYD Co. Ltd.: Revenue Share, by Country/Region, FY 2023
- Figure 79 : Chongqing Changan Automobile Co. Ltd.: Revenue Share, by Business Unit, FY 2023
- Figure 80 : Changan Automobile Co. Ltd.: Revenue Share, by Country/Region, FY 2023
- Figure 81 : GAC International Co. Ltd.: Revenue Share, by Business Unit, FY 2023
- Figure 82 : GAC International Co. Ltd.: Revenue Share, by Country/Region, FY 2023
- Figure 83 : General Motors: Revenue Share, by Business Unit, FY 2023
- Figure 84 : General Motors: Revenue Share, by Country/Region, FY 2023
- Figure 85 : Great Wall Motor: Revenue Share, by Business Unit, FY 2023
- Figure 86 : Great Wall Motor: Revenue Share, by Country/Region, FY 2023
- Figure 87 : Hyundai Motor Co.: Revenue Share, by Business Unit, FY 2023
- Figure 88 : Hyundai Motor Co.: Revenue Share, by Country/Region, FY 2023
- Figure 89 : Li Auto Inc.: Revenue Share, by Business Unit, FY 2023
- Figure 90 : Mercedes-Benz Group AG: Revenue Share, by Business Unit, FY 2023
- Figure 91 : Mercedes-Benz Group AG: Revenue Share, by Country/Region, FY 2023
- Figure 92 : SAIC Motor Corp. Ltd.: Revenue Share, by Business Unit, FY 2023
- Figure 93 : SAIC Motor Corp. Ltd.: Revenue Share, by Country/Region, FY 2023
- Figure 94 : Stellantis N.V.: Revenue Share, by Business Unit, FY 2023
- Figure 95 : Stellantis N.V.: Revenue Share, by Country/Region, FY 2023
- Figure 96 : Tesla: Revenue Share, by Business Unit, FY 2023
- Figure 97 : Tesla: Revenue Share, by Country/Region, FY 2023
- Figure 98 : Toyota Motor Corp.: Revenue Share, by Business Unit, FY 2023
- Figure 99 : Toyota Motor Corp.: Revenue Share, by Country/Region, FY 2023
- Figure 100 : Volkswagen Group: Revenue Share, by Business Unit, FY 2023
- Figure 101 : Volkswagen Group: Revenue Share, by Region, FY 2023
- Figure 102 : Volvo Car Corp.: Revenue Share, by Business Unit, FY 2023
- Figure 103 : Volvo Car Corp.: Revenue Share, by Country/Region, FY 2023
- Figure 104 : Zhejiang Geely Holding Group: Revenue Share, by Business Unit, FY 2023
- Figure 105 : Zhejiang Geely Holding Group: Revenue Share, by Country/Region, FY 2023
The global market for electric vehicles and fuel cell vehicles was valued at $655.9 billion in 2023. The market is expected to grow from $758.0 billion in 2024 to $1.8 trillion by 2029, at a compound annual growth rate (CAGR) of 18.6% from 2024 to 2029.
The global market for EVs, including the BEV, HEV, and PHEV is expected to grow from $751.2 billion in 2024 to $1.7 trillion by 2029, at a CAGR of 18.2% from 2024 to 2029.
The global market for FCEV is expected to grow from $6.8 billion in 2024 to $41.0 billion by 2029, at a CAGR of 43.3% from 2024 to 2029.
Report Scope:
This report includes key segments of EVs and FCEVs, such as propulsion type, vehicle type, and power source. Additionally, the report discusses the technological, regulatory, and market ranking analysis for top players. It further analyzes the market's dynamics and current industry trends. The report also covers patent analysis, the ESG development chapter, emerging technologies, and the impact of the Russia-Ukraine war on the EV and FCEV market. The report concludes by providing detailed company profiles of the top manufacturers in the global market.
Industrial vehicles and low-speed electric vehicles are not considered in the scope. The global volume (thousand units) for all the vehicle types is taken from the International Energy Agency (IEA) EV Outlook 2024 report.
The report also includes geographic analysis for North America, Europe, Asia-Pacific, and the Rest of the World (including South America, the Middle East, and Africa).
The base year is 2023, 2024 is an estimated year, and the market values are forecasted for five years until the end of 2029. All market values are in the dollar ($) billion. All market values are nominal.
Report Includes:
- 84 data tables and 52 additional tables
- Industry analysis of the global markets for electric vehicles (EVs) and fuel cell battery vehicles (FCEVs)
- Analyses of global market trends, with market revenue data from 2023, estimates for 2024, forecasts for 2025 and 2028, and projected CAGRs through 2029
- Estimates of the current market size in value and volumetric terms and revenue prospects, along with a market share analysis based on vehicle type, propulsion type, power source, and region
- Facts and figures pertaining to the market dynamics, current and emerging technologies, regulatory scenarios, and the expected impact of macroeconomic factors
- Assessment of unit sales and shipments of EVs, and a review of their power sources
- Insights into the market based on the Porter's Five Forces model and a value chain analysis
- Overview of ESG and sustainability trends, with a focus on consumer attitudes, companies' ESG score rankings and their ESG practices
- Analysis of patents related to EVs' power sources and components
- Insight into the industry structure, including company revenue share analysis, mergers and acquisitions, and venture funding
- Company profiles of leading players, including BYD Co. Ltd., Tesla Inc., Hyundai Motor Co., Volkswagen Group, and Zhejiang Geely Holding Group Co. Ltd.
Table of Contents
Chapter 1 Executive Summary
- Market Outlook
- Scope of Report
- Market Summary
Chapter 2 Market Overview
- Current Market Overview and Future Scenario
- Supply Chain Analysis of Electric Vehicles
- Raw Materials Mining
- Battery Cell Manufacturing and Battery Pack Assembling
- EV Components Assembling
- EV Manufacturing
- EV Service
- Battery Recycling and Disposal
- Supply Chain Analysis of Fuel Cell Electric Vehicles
- Raw Material Extraction and Processing
- Component Manufacturing
- System Integration
- Assembly and Testing
- Distribution and Retail
- Aftermarket Services
- Porter's Five Forces Analysis for Electric Vehicles
- Bargaining Power of Buyers
- Bargaining Power of Suppliers
- Potential for New Entrants to the Market
- Competition in the Industry
- Threat of Substitutes
- Porter's Five Forces Analysis for Fuel Cell Electric Vehicles
- Bargaining Power of Buyers
- Bargaining Power of Suppliers
- Potential for New Entrants to the Market
- Competition in the Industry
- Threat of Substitutes
- Impact of the Russia-Ukraine War on the Global Market
Chapter 3 Market Dynamics
- Overview
- Market Drivers
- Increasing Sales of Electric Cars Globally
- Decreasing Battery Costs are Supporting EV Adoption Globally
- Rising Petroleum Prices Drive the Shift of Consumers Toward EVs
- Market Restraints
- Inadequate Electric Vehicle Charging Infrastructure in Developing Countries
- High Initial Costs for Constructing EV Fast Charging Infrastructure
- High Production Cost of FCEV Can Hamper the Market Growth
- Market Opportunities
- Government Support for Public Transportation Electrification
- Government Initiatives Promoting Hydrogen Infrastructure
- Case Studies
- Tesla
- Toyota Motor Corp.
- Regulatory Framework and Initiatives
- Germany
- U.S.
- Canada
- India
- China
Chapter 4 Emerging Technologies and Developments
- Overview
- Key Emerging Technologies for Electric Vehicles and Fuel Cell Vehicles
- Autonomous Charging
- Three-Dimensional EV Printing
- V2G EV Charging Stations
- Emerging Role of AI and IoT Solutions in EV Deployment
- Patent Analysis
- Overview
- Key Patents Published
- Key Findings
Chapter 5 Market Segmentation Analysis
- Segmentation Breakdown
- Global EV and FCEV Market, by Propulsion Type
- BEV
- PHEV
- HEV
- FCEV
- Global EV and FCEV Market, by Vehicle Type
- Passenger Car
- Two-Wheeler
- Trucks and Vans
- Buses
- Three-Wheeler
- Global EV and FCEV Market, by Power Source
- Lithium-ion
- Lead-acid
- Nickel Metal Hydride
- Fuel Cell
- Geographic Breakdown
- Global EV and FCEV Market, by Region
- North America
- Europe
- Asia-Pacific
- Rest of the World
Chapter 6 Competitive Intelligence
- Overview
- Market Share Analysis
- Key Developments
Chapter 7 Sustainability in the Electric Vehicle and Fuel Cell Vehicle Market: An ESG Perspective
- Overview
- Environmental Impact
- Social Impact
- Governance Impact
- Current Status of ESG in the Global Electric Vehicle and Fuel Cell Vehicle Market
- Consumer Attitudes Towards ESG in the Global Electric Vehicle and Fuel Cell Vehicle Market
- Concluding Remarks from BCC Research
Chapter 8 Appendix
- Methodology
- Research Steps
- References
- Abbreviations
- Company Profiles
- BMW AG
- BYD CO. LTD.
- CHONGQING CHANGAN AUTOMOBILE CO. LTD.
- GAC INTERNATIONAL CO. LTD.
- GENERAL MOTORS
- GREAT WALL MOTOR
- HYUNDAI MOTOR CO.
- LI AUTO INC.
- MERCEDES-BENZ GROUP AG
- SAIC MOTOR CORP. LTD.
- STELLANTIS N.V.
- TESLA
- TOYOTA MOTOR CORP.
- VOLKSWAGEN GROUP
- VOLVO CAR CORP.
- ZHEJIANG GEELY HOLDING GROUP
- Small Players in the Global Electric Vehicles and Fuel Cell Vehicles Market
