|
|
市場調査レポート
商品コード
1420119
Bluetoothデバイスの世界市場:金額/数量別、デバイスタイプ別、Bluetoothバージョン別、機能別、販売チャネル別、地域別、国別の分析、市場考察、予測Global Bluetooth Devices Market : Analysis By Value and Volume, Device Type, Bluetooth Version, Functionality, By Sales Channel, By Region, By Country: Market Insights and Forecast |
||||||
|
|||||||
|
|||||||

| Bluetoothデバイスの世界市場:金額/数量別、デバイスタイプ別、Bluetoothバージョン別、機能別、販売チャネル別、地域別、国別の分析、市場考察、予測 |
|
出版日: 2024年02月01日
発行: Azoth Analytics
ページ情報: 英文 300 Pages
納期: 即納可能
|

全表示
- 概要
- 図表
- 目次
世界のBluetoothデバイスの市場規模は、予測期間の2024年~2029年にCAGRで13.2%の拡大が見込まれます。市場は、主要企業からの多額の支出により、異常な速度で成長すると予測されます。市場規模は2022年の416億米ドルから2029年に982億米ドルに達する見込みです。市場は、自動車におけるハンズフリー通信とオーディオストリーミングのニーズの向上や、スマートデバイスと無線接続ソリューションの受け入れの拡大、ウェアラブル技術の望ましさの増大によって牽引されています。各部門におけるエネルギー効率の高いコネクテッドデバイスに対するニーズの高まりも、市場成長の主な促進要因の1つです。ホームオートメーションシステムにおけるBluetooth Low Energyの需要は、スマートホームの動向によって増加しており、BLE対応ウェアラブルの成長は、健康とフィットネスに対する意識の高まりによって促進されています。
無線ネットワークへのニーズの高まり
世界のBluetoothデバイス市場の急成長は、世界中での無線ネットワークに対する需要の向上がその主因となっています。Bluetooth技術は、顧客と企業がともにコスト削減と旧来の有線セットアップの単純化を目指す中で、力強い回答として台頭しています。ウェアラブル、スマート家電、IoTアプリ、スピーカーやヘッドフォンなどのオーディオアクセサリは、Bluetoothデバイスのシームレスな無線接続の用途のほんの一部に過ぎません。
Bluetooth技術は接続を合理化し、複雑性を軽減するため、多くの産業で有益と考えられています。Bluetoothデバイスは、効果的な通信とコラボレーションを促進することで、ビジネス環境の生産性を向上させます。さらに、Bluetoothオーディオソリューションの使いやすさが、コンシューマーエレクトロニクス部門における需要の拡大に拍車をかけています。
その他の無線技術との競合
Wi-Fi 6や5Gなど、より高速なデータ転送と遅延の短縮を可能にする最新の無線技術は、これまでBluetoothと連携していた用途にも広がり始めています。Bluetoothの市場シェアは、高速通信や広範なデバイスへの接続性を必要とする状況でより優れた性能を発揮する代替技術により、特定の用途で制限される可能性があります。さらに、ZigBeeとZ-Waveという2つの特殊な無線プロトコルがホームオートメーションとIoT用途で確立され、信頼性の高い通信、低い消費電力、メッシュネットワーキングが不可欠なこれらの分野におけるBluetoothの優位性に挑戦しています。
企業が特定の用途にカスタマイズされた無線プロトコルを採用し、正確な空間認識に向けた超広帯域(UWB)などの新技術を研究する中、Bluetoothはその適応性を示し、幅広い用途で競争優位性を維持する必要があります。
当レポートでは、世界のBluetoothデバイス市場について調査し、市場規模と予測、地域とセグメントの分析、主要動向と機会などの情報を提供しています。
目次
第1章 市場の背景
- 範囲と製品の見通し
- エグゼクティブサマリー
- 調査手法
第2章 戦略的推奨事項
第3章 世界のBluetoothデバイス市場:実績と予測(2019年~2029年)
- Bluetoothデバイス市場に対するマクロ経済要因の影響の分析
- 世界のBluetoothデバイス市場:ウェアラブルデバイス企業の出荷数上位5社
- 世界のBluetoothデバイス市場:Bluetooth Low Energy ICの市場シェア
- 世界のBluetoothデバイス市場:主要BLE SoCサプライヤー
- 世界のBluetoothデバイス市場:ダッシュボード
- 世界のBluetoothデバイス市場:市場金額の評価(2019年~2029年)
- 世界のBluetoothデバイス市場:市場数量の評価(2019年~2029年)
- 世界のBluetoothデバイスの平均価格分析
- Bluetoothデバイス市場に対するCOVID-19の影響
- 世界のBluetoothデバイス市場セグメンテーション:デバイスタイプ別
- 世界のBluetoothデバイス市場:デバイスタイプ別、概要
- 世界のBluetoothデバイスの市場規模:ウェアラブル(金額)(2019年~2029年)
- 世界のBluetoothデバイスの市場規模:ヘッドフォン(金額)(2019年~2029年)
- 世界のBluetoothデバイスの市場規模:スピーカー(金額)(2019年~2029年)
- 世界のBluetoothデバイスの市場規模:PC周辺機器・アクセサリ(金額)(2019年~2029年)
- 世界のBluetoothデバイスの市場規模:その他のデバイス(金額)(2019年~2029年)
- 世界のBluetoothデバイス市場セグメンテーション:バージョン別
- 世界のBluetoothデバイス市場:バージョン別、概要
- 世界のBluetoothデバイスの市場規模:Bluetooth 5.0(金額)(2019年~2029年)
- 世界のBluetoothデバイスの市場規模:Bluetooth 4.0(金額)(2019年~2029年)
- 世界のBluetoothデバイス市場セグメンテーション:機能別
- 世界のBluetoothデバイス市場:機能別、概要
- 世界のBluetoothデバイスの市場規模:オーディオストリーミング(金額)(2019年~2029年)
- 世界のBluetoothデバイスの市場規模:データ転送(金額)(2019年~2029年)
- 世界のBluetoothデバイスの市場規模:位置情報サービス(金額)(2019年~2029年)
- 世界のBluetoothデバイスの市場規模:デバイスネットワーク(金額)(2019年~2029年)
- 世界のBluetoothデバイス市場セグメンテーション:販売チャネル別
- 世界のBluetoothデバイス市場:販売チャネル別、概要
- 世界のBluetoothデバイスの市場規模:オンライン(金額)(2019年~2029年)
- 世界のBluetoothデバイスの市場規模:オフライン(金額)(2019年~2029年)
第4章 世界のBluetoothデバイス市場:地域の分析
- 研究の地域範囲
- 地域のスナップショット
第5章 南北アメリカのBluetoothデバイス市場:実績と予測(2019年~2029年)
- 南北アメリカのBluetoothデバイス市場:スナップショット
- 南北アメリカのBluetoothデバイス市場:市場金額の評価(2019年~2029年)
- 南北アメリカのBluetoothデバイス市場:市場数量の評価(2019年~2029年)
- 南北アメリカのBluetoothデバイス市場:主な要因
- 南北アメリカのBluetoothデバイス市場:セグメント分析
- 南北アメリカのBluetoothデバイス市場セグメンテーション:デバイスタイプ別
- 南北アメリカのBluetoothデバイス市場セグメンテーション:バージョン別
- 南北アメリカのBluetoothデバイス市場セグメンテーション:機能別
- 南北アメリカのBluetoothデバイス市場セグメンテーション:販売チャネル別
- 南北アメリカのBluetoothデバイス市場セグメンテーション:国別
- 南北アメリカのBluetoothデバイス市場:国別、概要
- 米国のBluetoothデバイス市場:市場規模とCAGR(2019年~2029年)
- カナダのBluetoothデバイス市場:市場規模とCAGR(2019年~2029年)
- ブラジルのBluetoothデバイス市場:市場規模とCAGR(2019年~2029年)
- その他の南北アメリカのBluetoothデバイス市場:市場規模とCAGR(2019年~2029年)
第6章 欧州のBluetoothデバイス市場:実績と予測(2019年~2029年)
- 欧州のBluetoothデバイス市場:スナップショット
- 欧州のBluetoothデバイス市場:市場金額の評価(2019年~2029年)
- 欧州のBluetoothデバイス市場:市場数量の評価(2019年~2029年)
- 欧州のBluetoothデバイス市場:主な要因
- 欧州のBluetoothデバイス市場:セグメント分析
- 欧州のBluetoothデバイス市場セグメンテーション:デバイスタイプ別
- 欧州のBluetoothデバイス市場セグメンテーション:バージョン別
- 欧州のBluetoothデバイス市場セグメンテーション:機能別
- 欧州のBluetoothデバイス市場セグメンテーション:販売チャネル別
- 欧州のBluetoothデバイス市場セグメンテーション:国別
- 欧州のBluetoothデバイス市場:国別、概要
- ドイツのBluetoothデバイス市場:市場規模とCAGR(2019年~2029年)
- 英国のBluetoothデバイス市場:市場規模とCAGR(2019年~2029年)
- フランスのBluetoothデバイス市場:市場規模とCAGR(2019年~2029年)
- その他の欧州のBluetoothデバイス市場:市場規模とCAGR(2019年~2029年)
第7章 アジア太平洋のBluetoothデバイス市場:実績と予測(2019年~2029年)
- アジア太平洋のBluetoothデバイス市場:スナップショット
- アジア太平洋のBluetoothデバイス市場:市場金額の評価(2019年~2029年)
- アジア太平洋のBluetoothデバイス市場:市場数量の評価(2019年~2029年)
- アジア太平洋のBluetoothデバイス市場:主な要因
- アジア太平洋のBluetoothデバイス市場:セグメント分析
- アジア太平洋のBluetoothデバイス市場セグメンテーション:デバイスタイプ別
- アジア太平洋のBluetoothデバイス市場セグメンテーション:バージョン別
- アジア太平洋のBluetoothデバイス市場セグメンテーション:機能別
- アジア太平洋のBluetoothデバイス市場セグメンテーション:販売チャネル別
- アジア太平洋のBluetoothデバイス市場セグメンテーション:国別
- アジア太平洋のBluetoothデバイス市場:国別、概要
- 中国のBluetoothデバイス市場:市場規模とCAGR(2019年~2029年)
- 日本のBluetoothデバイス市場:市場規模とCAGR(2019年~2029年)
- 韓国のBluetoothデバイス市場:市場規模とCAGR(2019年~2029年)
- インドのBluetoothデバイス市場:市場規模とCAGR(2019年~2029年)
- その他のアジア太平洋のBluetoothデバイス市場:市場規模とCAGR(2019年~2029年)
第8章 中東・アフリカのBluetoothデバイス市場:実績と予測(2019年~2029年)
- 中東・アフリカのBluetoothデバイス市場:スナップショット
- 中東・アフリカのBluetoothデバイス市場:市場金額の評価(2019年~2029年)
- 中東・アフリカのBluetoothデバイス市場:市場数量の評価(2019年~2029年)
- 中東・アフリカのBluetoothデバイス市場:主な要因
- 中東・アフリカのBluetoothデバイス市場:セグメント分析
- 中東・アフリカのBluetoothデバイス市場セグメンテーション:デバイスタイプ別
- 中東・アフリカのBluetoothデバイス市場セグメンテーション:バージョン別
- 中東・アフリカのBluetoothデバイス市場セグメンテーション:機能別
- 中東・アフリカのBluetoothデバイス市場セグメンテーション:販売チャネル別
第9章 市場力学
- 世界のBluetoothデバイス市場に対する市場力学の影響の評価
- 促進要因
- 抑制要因
- 動向
第10章 産業エコシステム分析
- バリューチェーン分析
- ポーターのファイブフォース分析モデル
第11章 競合ポジショニング
- 企業の製品ポジショニング
- 市場ポジションマトリクス
- Bluetoothデバイス市場の市場シェア分析
- 企業プロファイル
- Apple, Inc.
- Logitech International S.A.
- Panasonic Holdings Corp.
- Samsung Electronics Co. Ltd.
- Dell Technologies Inc.
- Sony Group Corp.
- GN Store Nord A/S
- Huawei Technologies Co., Ltd.
- Xiaomi Corporation
- Sennheiser Electronic GmbH and Co. KG
List of Figures
List of Figures
- Figure 1: Global Bluetooth Devices Market Size, By Value, 2019-2022 (USD Billion)
- Figure 2: Global Bluetooth Devices Market Size, By Value, 2023-2029 (USD Billion)
- Figure 3: Global Bluetooth Devices Market CAGR (%), By Value, 2019-2022, 2024-2029
- Figure 4: Global Bluetooth Devices Market Size, By Volume, 2019-2022 (in Units'M)
- Figure 5: Global Bluetooth Devices Market Size, By Volume, 2023-2029 (in Units'M)
- Figure 6: Global Bluetooth Devices Market CAGR (%), By Volume, 2019-2022, 2024-2029
- Figure 7: Average Bluetooth Device Price, By Region, 2022 (USD/Unit)
- Figure 8: Global Bluetooth Devices Market Size, By Wearables, By Value, 2019H-2029F (USD Billion & CAGR)
- Figure 9: Global Bluetooth Devices Market Absolute Opportunity, By Wearables, 2019-2029 (USD Billion)
- Figure 10: Global Bluetooth Devices Market Size, By Headphone, By Value, 2019H-2029F (USD Billion & CAGR)
- Figure 11: Global Bluetooth Devices Market Absolute Opportunity, By Headphone, 2019-2029 (USD Billion)
- Figure 12: Global Bluetooth Devices Market Size, By Speaker, By Value, 2019H-2029F (USD Billion & CAGR)
- Figure 13: Global Bluetooth Devices Market Absolute Opportunity, By Speaker, 2019-2029 (USD Billion)
- Figure 14: Global Bluetooth Devices Market Size, By PC Peripherals & Accessories, By Value, 2019H-2029F (USD Billion & CAGR)
- Figure 15: Global Bluetooth Devices Market Absolute Opportunity, By PC Peripherals & Accessories, 2019-2029 (USD Billion)
- Figure 16: Global Bluetooth Devices Market Size, By Other Devices, By Value, 2019H-2029F (USD Billion & CAGR)
- Figure 17: Global Bluetooth Devices Market Absolute Opportunity, By Other Devices, 2019-2029 (USD Billion)
- Figure 18: Global Bluetooth Devices Market Size, By Bluetooth 5.0, By Value, 2019H-2029F (USD Billion & CAGR)
- Figure 19: Global Bluetooth Devices Market Absolute Opportunity, By Bluetooth 5.0, 2019-2029 (USD Billion)
- Figure 20: Global Bluetooth Devices Market Size, By Bluetooth 4.0, By Value, 2019H-2029F (USD Billion & CAGR)
- Figure 21: Global Bluetooth Devices Market Absolute Opportunity, By Bluetooth 4.0, 2019-2029 (USD Billion)
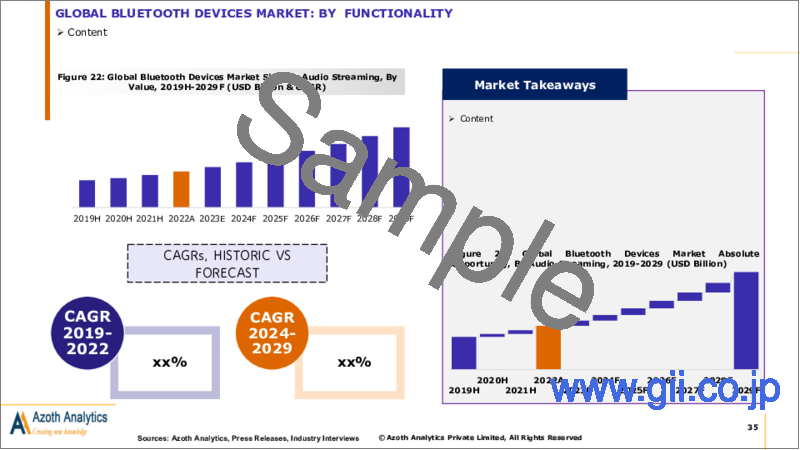
- Figure 22: Global Bluetooth Devices Market Size, By Audio Streaming, By Value, 2019H-2029F (USD Billion & CAGR)
- Figure 23: Global Bluetooth Devices Market Absolute Opportunity, By Audio Streaming, 2019-2029 (USD Billion)
- Figure 24: Global Bluetooth Devices Market Size, By Data Transfer, By Value, 2019H-2029F (USD Billion & CAGR)
- Figure 25: Global Bluetooth Devices Market Absolute Opportunity, By Data Transfer, 2019-2029 (USD Billion)
- Figure 26: Global Bluetooth Devices Market Size, By Location Services, By Value, 2019H-2029F (USD Billion & CAGR)
- Figure 27: Global Bluetooth Devices Market Absolute Opportunity, By Location Services, 2019-2029 (USD Billion)
- Figure 28: Global Bluetooth Devices Market Size, By Device Networks, By Value, 2019H-2029F (USD Billion & CAGR)
- Figure 29: Global Bluetooth Devices Market Absolute Opportunity, By Device Networks, 2019-2029 (USD Billion)
- Figure 30: Global Bluetooth Devices Market Size, By Online, By Value, 2019H-2029F (USD Billion & CAGR)
- Figure 31: Global Bluetooth Devices Market Absolute Opportunity, By Online, 2019-2029 (USD Billion)
- Figure 32: Global Bluetooth Devices Market Size, By Offline, By Value, 2019H-2029F (USD Billion & CAGR)
- Figure 33: Global Bluetooth Devices Market Absolute Opportunity, By Offline, 2019-2029 (USD Billion)
- Figure 34: Americas Bluetooth Devices Market Size, By Value, 2019H-2029F (USD Billion)
- Figure 35: Americas Bluetooth Devices Market Share, By Version, 2022 (%)
- Figure 36: Americas Bluetooth Devices Market Size, By Volume, 2019-2022 (in Units'M)
- Figure 37: Americas Bluetooth Devices Market Size, By Volume, 2023-2029 (in Units'M)
- Figure 38: Americas Bluetooth Devices Market, By Wearables, By Value, 2019H-2029F (USD Billion & CAGR)
- Figure 39: Americas Bluetooth Devices Market, By Headphone, By Value, 2019H-2029F (USD Billion & CAGR)
- Figure 40: Americas Bluetooth Devices Market, By Speaker, By Value, 2019H-2029F (USD Billion & CAGR)
- Figure 41: Americas Bluetooth Devices Market, By PC Peripherals & Accessories, By Value, 2019H-2029F (USD Billion & CAGR)
- Figure 42: Americas Bluetooth Devices Market, By Other Devices, By Value, 2019H-2029F (USD Billion & CAGR)
- Figure 43: Americas Bluetooth Devices Market, By Bluetooth 5.0, By Value, 2019H-2029F (USD Billion & CAGR)
- Figure 44: Americas Bluetooth Devices Market, By Bluetooth 4.0, By Value, 2019H-2029F (USD Billion & CAGR)
- Figure 45: Americas Bluetooth Devices Market, By Audio Streaming, By Value, 2019H-2029F (USD Billion & CAGR)
- Figure 46: Americas Bluetooth Devices Market, By Data Transfer, By Value, 2019H-2029F (USD Billion & CAGR)
- Figure 47: Americas Bluetooth Devices Market, By Location Services, By Value, 2019H-2029F (USD Billion & CAGR)
- Figure 48: Americas Bluetooth Devices Market, By Device Networks, By Value, 2019H-2029F (USD Billion & CAGR)
- Figure 49: Americas Bluetooth Devices Market, By Online, By Value, 2019H-2029F (USD Billion & CAGR)
- Figure 50: Americas Bluetooth Devices Market, By Offline, By Value, 2019H-2029F (USD Billion & CAGR)
- Figure 51: United States Bluetooth Devices Market, By Value, 2019-2029 (USD Billion & CAGR)
- Figure 52: United States Bluetooth Devices Market Value, By Version, 2022 (USD Billion)
- Figure 53: United States Bluetooth Devices Market Share, By Device Type, By Value, 2022 (%)
- Figure 54: United States Bluetooth Devices Market Share, By Version, 2022 (%)
- Figure 55: United States Bluetooth Devices Market Share, By Functionality, By Value, 2022 (%)
- Figure 56: United States Bluetooth Devices Market Share, By Sales Channel, 2022 (%)
- Figure 57: Canada Bluetooth Devices Market, By Value, 2019-2029 (USD Billion & CAGR)
- Figure 58: Canada Bluetooth Devices Market Value, By Version, 2022 (USD Billion)
- Figure 59: Canada Bluetooth Devices Market Share, By Device Type, By Value, 2022 (%)
- Figure 60: Canada Bluetooth Devices Market Share, By Version, 2022 (%)
- Figure 61: Canada Bluetooth Devices Market Share, By Functionality, By Value, 2022 (%)
- Figure 62: Canada Bluetooth Devices Market Share, By Sales Channel, 2022 (%)
- Figure 63: Brazil Bluetooth Devices Market, By Value, 2019-2029 (USD Billion & CAGR)
- Figure 64: Brazil Bluetooth Devices Market Value, By Version, 2022 (USD Billion)
- Figure 65: Brazil Bluetooth Devices Market Share, By Device Type, By Value, 2022 (%)
- Figure 66: Brazil Bluetooth Devices Market Share, By Version, 2022 (%)
- Figure 67: Brazil Bluetooth Devices Market Share, By Functionality, By Value, 2022 (%)
- Figure 68: Brazil Bluetooth Devices Market Share, By Sales Channel, 2022 (%)
- Figure 69: Rest of Americas Bluetooth Devices Market, By Value, 2019-2029 (USD Billion & CAGR)
- Figure 70: Rest of Americas Bluetooth Devices Market Value, By Version, 2022 (USD Billion)
- Figure 71: Rest of Americas Bluetooth Devices Market Share, By Device Type, By Value, 2022 (%)
- Figure 72: Rest of Americas Bluetooth Devices Market Share, By Version, 2022 (%)
- Figure 73: Rest of Americas Bluetooth Devices Market Share, By Functionality, 2022 (%)
- Figure 74: Rest of Americas Bluetooth Devices Market Share, By Sales Channel, 2022 (%)
- Figure 75: Europe Bluetooth Devices Market Size, By Value, 2019H-2029F (USD Billion)
- Figure 76: Europe Bluetooth Devices Market Share, By Version, 2022 (%)
- Figure 77: Europe Bluetooth Devices Market Size, By Volume, 2019-2022 (in Units'M)
- Figure 78: Europe Bluetooth Devices Market Size, By Volume, 2023-2029 (in Units'M)
- Figure 79: Europe Bluetooth Devices Market, By Wearables, By Value, 2019H-2029F (USD Billion & CAGR)
- Figure 80: Europe Bluetooth Devices Market, By Headphone, By Value, 2019H-2029F (USD Billion & CAGR)
- Figure 81: Europe Bluetooth Devices Market, By Speaker, By Value, 2019H-2029F (USD Billion & CAGR)
- Figure 82: Europe Bluetooth Devices Market, By PC Peripherals & Accessories, By Value, 2019H-2029F (USD Billion & CAGR)
- Figure 83: Europe Bluetooth Devices Market, By Other Devices, By Value, 2019H-2029F (USD Billion & CAGR)
- Figure 84: Europe Bluetooth Devices Market, By Bluetooth 5.0, By Value, 2019H-2029F (USD Billion & CAGR)
- Figure 85: Europe Bluetooth Devices Market, By Bluetooth 4.0, By Value, 2019H-2029F (USD Billion & CAGR)
- Figure 86: Europe Bluetooth Devices Market, By Audio Streaming, By Value, 2019H-2029F (USD Billion & CAGR)
- Figure 87: Europe Bluetooth Devices Market, By Data Transfer, By Value, 2019H-2029F (USD Billion & CAGR)
- Figure 88: Europe Bluetooth Devices Market, By Location Services, By Value, 2019H-2029F (USD Billion & CAGR)
- Figure 89: Europe Bluetooth Devices Market, By Device Networks, By Value, 2019H-2029F (USD Billion & CAGR)
- Figure 90: Europe Bluetooth Devices Market, By Online, By Value, 2019H-2029F (USD Billion & CAGR)
- Figure 91: Europe Bluetooth Devices Market, Offline, By Value, 2019H-2029F (USD Billion & CAGR)
- Figure 92: Germany Bluetooth Devices Market, By Value, 2019-2029 (USD Billion & CAGR)
- Figure 93: Germany Bluetooth Devices Market Value, By Version, 2022 (USD Billion)
- Figure 94: Germany Bluetooth Devices Market Share, By Device Type, By Value, 2022 (%)
- Figure 95: Germany Bluetooth Devices Market Share, By Version, 2022 (%)
- Figure 96: Germany Bluetooth Devices Market Share, By Functionality, By Value, 2022 (%)
- Figure 97: Germany Bluetooth Devices Market Share, By Sales Channel, 2022 (%)
- Figure 98: United Kingdom Bluetooth Devices Market, By Value, 2019-2029 (USD Billion & CAGR)
- Figure 99: United Kingdom Bluetooth Devices Market Value, By Version, 2022 (USD Billion)
- Figure 100: United Kingdom Bluetooth Devices Market Share, By Device Type, By Value, 2022 (%)
- Figure 101: United Kingdom Bluetooth Devices Market Share, By Version, 2022 (%)
- Figure 102: United Kingdom Bluetooth Devices Market Share, By Functionality, By Value, 2022 (%)
- Figure 103: United Kingdom Bluetooth Devices Market Share, By Sales Channel, 2022 (%)
- Figure 104: France Bluetooth Devices Market, By Value, 2019-2029 (USD Billion & CAGR)
- Figure 105: France Bluetooth Devices Market Value, By Version, 2022 (USD Billion)
- Figure 106: France Bluetooth Devices Market Share, By Device Type, By Value, 2022 (%)
- Figure 107: France Bluetooth Devices Market Share, By Version, 2022 (%)
- Figure 108: France Bluetooth Devices Market Share, By Functionality, By Value, 2022 (%)
- Figure 109: France Bluetooth Devices Market Share, By Sales Channel, 2022 (%)
- Figure 110: Rest of Europe Bluetooth Devices Market, By Value, 2019-2029 (USD Billion & CAGR)
- Figure 111: Rest of Europe Bluetooth Devices Market Value, By Version, 2022 (USD Billion)
- Figure 112: Rest of Europe Bluetooth Devices Market Share, By Device Type, By Value, 2022 (%)
- Figure 113: Rest of Europe Bluetooth Devices Market Share, By Version, 2022 (%)
- Figure 114: Rest of Europe Bluetooth Devices Market Share, By Functionality, By Value, 2022 (%)
- Figure 115: Rest of Europe Bluetooth Devices Market Share, By Sales Channel, 2022 (%)
- Figure 116: Asia Pacific Bluetooth Devices Market Size, By Value, 2019H-2029F (USD Billion)
- Figure 117: Asia Pacific Bluetooth Devices Market Share, By Version, 2022 (%)
- Figure 118: Asia Pacific Bluetooth Devices Market Size, By Volume, 2019-2022 (in Units'M)
- Figure 119: Asia Pacific Bluetooth Devices Market Size, By Volume, 2023-2029 (in Units'M)
- Figure 120: Asia Pacific Bluetooth Devices Market, By Wearables, By Value, 2019H-2029F (USD Billion & CAGR)
- Figure 121: Asia Pacific Bluetooth Devices Market, By Headphone, By Value, 2019H-2029F (USD Billion & CAGR)
- Figure 122: Asia Pacific Bluetooth Devices Market, By Speaker, By Value, 2019H-2029F (USD Billion & CAGR)
- Figure 123: Asia Pacific Bluetooth Devices Market, By PC Peripherals & Accessories, By Value, 2019H-2029F (USD Billion & CAGR)
- Figure 124: Asia Pacific Bluetooth Devices Market, By Other Devices, By Value, 2019H-2029F (USD Billion & CAGR)
- Figure 125: Asia Pacific Bluetooth Devices Market, By Bluetooth 5.0, By Value, 2019H-2029F (USD Billion & CAGR)
- Figure 126: Asia Pacific Bluetooth Devices Market, By Bluetooth 4.0, By Value, 2019H-2029F (USD Billion & CAGR)
- Figure 127: Asia Pacific Bluetooth Devices Market, By Audio Streaming, By Value, 2019H-2029F (USD Billion & CAGR)
- Figure 128: Asia Pacific Bluetooth Devices Market, By Data Transfer, By Value, 2019H-2029F (USD Billion & CAGR)
- Figure 129: Asia Pacific Bluetooth Devices Market, By Location Services, By Value, 2019H-2029F (USD Billion & CAGR)
- Figure 130: Asia Pacific Bluetooth Devices Market, By Device Networks, By Value, 2019H-2029F (USD Billion & CAGR)
- Figure 131: Asia Pacific Bluetooth Devices Market, By Online, By Value, 2019H-2029F (USD Billion & CAGR)
- Figure 132: Asia Pacific Bluetooth Devices Market, Offline, By Value, 2019H-2029F (USD Billion & CAGR)
- Figure 133: China Bluetooth Devices Market, By Value, 2019-2029 (USD Billion & CAGR)
- Figure 134: China Bluetooth Devices Market Value, By Version, 2022 (USD Billion)
- Figure 135: China Bluetooth Devices Market Share, By Device Type, By Value, 2022 (%)
- Figure 136: China Bluetooth Devices Market Share, By Version, 2022 (%)
- Figure 137: China Bluetooth Devices Market Share, By Functionality, By Value, 2022 (%)
- Figure 138: China Bluetooth Devices Market Share, By Sales Channel, 2022 (%)
- Figure 139: Japan Bluetooth Devices Market, By Value, 2019-2029 (USD Billion & CAGR)
- Figure 140: Japan Bluetooth Devices Market Value, By Version, 2022 (USD Billion)
- Figure 141: Japan Bluetooth Devices Market Share, By Device Type, By Value, 2022 (%)
- Figure 142: Japan Bluetooth Devices Market Share, By Version, 2022 (%)
- Figure 143: Japan Bluetooth Devices Market Share, By Functionality, By Value, 2022 (%)
- Figure 144: Japan Bluetooth Devices Market Share, By Sales Channel, 2022 (%)
- Figure 145: South Korea Bluetooth Devices Market, By Value, 2019-2029 (USD Billion & CAGR)
- Figure 146: South Korea Bluetooth Devices Market Value, By Version, 2022 (USD Billion)
- Figure 147: South Korea Bluetooth Devices Market Share, By Device Type, By Value, 2022 (%)
- Figure 148: South Korea Bluetooth Devices Market Share, By Version, 2022 (%)
- Figure 149: South Korea Bluetooth Devices Market Share, By Functionality, By Value, 2022 (%)
- Figure 150: South Korea Bluetooth Devices Market Share, By Sales Channel, 2022 (%)
- Figure 151: India Bluetooth Devices Market, By Value, 2019-2029 (USD Billion & CAGR)
- Figure 152: India Bluetooth Devices Market Value, By Version, 2022 (USD Billion)
- Figure 153: India Bluetooth Devices Market Share, By Device Type, By Value, 2022 (%)
- Figure 154: India Bluetooth Devices Market Share, By Version, 2022 (%)
- Figure 155: India Bluetooth Devices Market Share, By Functionality, By Value, 2022 (%)
- Figure 156: India Bluetooth Devices Market Share, By Sales Channel, 2022 (%)
- Figure 157: Rest of Asia Pacific Bluetooth Devices Market, By Value, 2019-2029 (USD Billion & CAGR)
- Figure 158: Rest of Asia Pacific Bluetooth Devices Market Value, By Version, 2022 (USD Billion)
- Figure 159: Rest of Asia Pacific Bluetooth Devices Market Share, By Device Type, By Value, 2022 (%)
- Figure 160: Rest of Asia Pacific Bluetooth Devices Market Share, By Version, 2022 (%)
- Figure 161: Rest of Asia Pacific Bluetooth Devices Market Share, By Functionality, By Value, 2022 (%)
- Figure 162: Rest of Americas Bluetooth Devices Market Share, By Sales Channel, 2022 (%)
- Figure 163: Middle east & Africa Bluetooth Devices Market Size, By Value, 2019H-2029F (USD Billion)
- Figure 164: Middle east & Africa Bluetooth Devices Market Share, By Version, 2022 (%)
- Figure 165: Middle East & Africa Bluetooth Devices Market Size, By Volume, 2019-2022 (in Units'M)
- Figure 166: Middle East & Africa Bluetooth Devices Market Size, By Volume, 2023-2029 (in Units'M)
- Figure 167: Middle east & Africa Bluetooth Devices Market, By Wearables, By Value, 2019H-2029F (USD Billion & CAGR)
- Figure 168: Middle east & Africa Bluetooth Devices Market, By Headphone, By Value, 2019H-2029F (USD Billion & CAGR)
- Figure 169: Middle East & Africa Bluetooth Devices Market, By Speaker, By Value, 2019H-2029F (USD Billion & CAGR)
- Figure 170: Middle East & Africa Bluetooth Devices Market, By PC Peripherals & Accessories, By Value, 2019H-2029F (USD Billion & CAGR)
- Figure 171: Middle East & Africa Bluetooth Devices Market, By Other Devices, By Value, 2019H-2029F (USD Billion & CAGR)
- Figure 172: Middle east & Africa Bluetooth Devices Market, By Bluetooth 5.0, By Value, 2019H-2029F (USD Billion & CAGR)
- Figure 173: Middle East & Africa Bluetooth Devices Market, By Bluetooth 4.0, By Value, 2019H-2029F (USD Billion & CAGR)
- Figure 174: Middle East & Africa Bluetooth Devices Market, By Audio Streaming, By Value, 2019H-2029F (USD Billion & CAGR)
- Figure 175: Middle East & Africa Bluetooth Devices Market, By Data Transfer, By Value, 2019H-2029F (USD Billion & CAGR)
- Figure 176: Middle East & Africa Bluetooth Devices Market, By Location Services, By Value, 2019H-2029F (USD Billion & CAGR)
- Figure 177: Middle East & Africa Bluetooth Devices Market, By Device Networks, By Value, 2019H-2029F (USD Billion & CAGR)
- Figure 178: Middle east & Africa Bluetooth Devices Market, By Online, By Value, 2019H-2029F (USD Billion & CAGR)
- Figure 179: Middle east & Africa Bluetooth Devices Market, Offline, By Value, 2019H-2029F (USD Billion & CAGR)
- Figure 180: Global Impact of Drivers and Restraints
- Figure 181: Market Share of Prominent Companies of Bluetooth Devices Market, 2022 (%)
- Figure 182: Apple, Inc. Revenues, 2020-2022 (USD Million)
- Figure 183: Apple, Inc., Revenue By Business Segment, 2022 (%)
- Figure 184: Apple, Inc., Revenue By Geographic Segment, 2022 (%)
- Figure 185: Logitech International S.A. Revenues, 2020-2022 (USD Million)
- Figure 186: Logitech International S.A. Revenue By Business Segment, 2022 (%)
- Figure 187: Logitech International S.A., By Geographic Segment, 2022
- Figure 188: Panasonic Holdings Corp. Revenues, 2020-2022 (USD Million)
- Figure 189: Panasonic Holdings Corp. Revenue By Business Segment, 2022 (%)
- Figure 190: Panasonic Holdings Corp. Revenue By Geographic Segment, 2022 (%)
- Figure 191: Samsung Electronics Co. Ltd. Revenues, 2020-2022 (USD Million)
- Figure 192: Samsung Electronics Co. Ltd. Revenue By Business Segment, 2022 (%)
- Figure 193: Samsung Electronics Co. Ltd. Revenue By Geographic Segment, 2022 (%)
- Figure 194: Dell Technologies Inc. Revenues, 2020-2022 (USD Million)
- Figure 195: Dell Technologies Inc. Revenue By Business Segment, 2022 (%)
- Figure 196: Dell Technologies Inc. Revenue By Geographic Segment, 2022 (%)
- Figure 197: Sony Group Corp. Revenues, 2020-2022 (USD Million)
- Figure 198: Sony Group Corp. Revenue By Geographic Segment, 2022 (%)
- Figure 199: Sony Group Corp. Revenue, By Geographic Segments, 2022 (%)
- Figure 200: GN Store Nord A/S Revenues, 2020-2022 (USD Million)
- Figure 201: GN Store Nord A/S Revenue, By Business Segments, 2022 (%)
- Figure 202: GN Store Nord A/S Revenue, By Geographic Segments, 2022 (%)
- Figure 203: Huawei Technologies Co., Ltd. Revenues, 2020-2022 (USD Million)
- Figure 204: Huawei Technologies Co., Ltd. Revenue By Customer Group, 2022 (%)
- Figure 205: Huawei Technologies Co., Ltd. Revenue By Geographic Segment, 2022 (%)
- Figure 206: Huawei Technologies Co., Ltd. Revenue By Industry, 2022 (%)
- Figure 207: Xiaomi Corporation Revenues, 2020-2022 (USD Million)
- Figure 208: Xiaomi Corporation Revenue By Business Segment, 2022 (%)
- Figure 209: Xiaomi Corporation Revenue By Geographic Segment, 2022 (%)
- Figure 210: Sennheiser Electronic GmbH and Co. KG Revenues, 2020-2022 (USD Million)
- Figure 211: Sennheiser Electronic GmbH and Co. KG Revenue By Business Segment, 2022 (%)
- Figure 212: Sennheiser Electronic GmbH and Co. KG Revenue By Geographic Segment, 2022 (%)
List of Tables
Table A1: Global Impact of Macro Economic Factors, By Region
Table A2: Top 5 Wearable Device Companies by Shipment Volume (market share and y-o-y growth) (shipments in millions)
Table A3: Bluetooth Low Energy IC Market Share
Table A4: Major BLE SoC Supplier by End-use
Table A5: United States Bluetooth Devices Market, By Device Type, By Value, 2019-2022 (USD Billion)
Table A6: United States Bluetooth Devices Market, By Device Type, By Value, 2023-2029 (USD Billion)
Table A7: United States Bluetooth Devices Market, By Version, By Value, 2019-2022 (USD Billion)
Table A8: United States Bluetooth Devices Market, By Version, By Value, 2023-2029 (USD Billion)
Table A9: United States Bluetooth Devices Market, By Functionality, By Value, 2019-2022 (USD Billion)
Table A10: United States Bluetooth Devices Market, By Functionality, By Value, 2023-2029 (USD Billion)
Table A11: United States Bluetooth Devices Market, By Sales Channel, By Value, 2019-2022 (USD Billion)
Table A12: United States Bluetooth Devices Market, By Sales Channel, By Value, 2023-2029 (USD Billion)
Table A13: Canada Bluetooth Devices Market, By Device Type, By Value, 2019-2022 (USD Billion)
Table A14: Canada Bluetooth Devices Market, By Device Type, By Value, 2023-2029 (USD Billion)
Table A15: Canada Bluetooth Devices Market, By Version, By Value, 2019-2022 (USD Billion)
Table A16: Canada Bluetooth Devices Market, By Version, By Value, 2023-2029 (USD Billion)
Table A17: Canada Bluetooth Devices Market, By Functionality, By Value, 2019-2022 (USD Billion)
Table A18: Canada Bluetooth Devices Market, By Functionality, By Value, 2023-2029 (USD Billion)
Table A19: Canada Bluetooth Devices Market, By Sales Channel, By Value, 2019-2022 (USD Billion)
Table A20: Canada Bluetooth Devices Market, By Sales Channel, By Value, 2023-2029 (USD Billion)
Table A21: Brazil Bluetooth Devices Market, By Device Type, By Value, 2019-2022 (USD Billion)
Table A22: Brazil Bluetooth Devices Market, By Device Type, By Value, 2023-2029 (USD Billion)
Table A23: Brazil Bluetooth Devices Market, By Version, By Value, 2019-2022 (USD Billion)
Table A24: Brazil Bluetooth Devices Market, By Version, By Value, 2023-2029 (USD Billion)
Table A25: Brazil Bluetooth Devices Market, By Functionality, By Value, 2019-2022 (USD Billion)
Table A26: Brazil Bluetooth Devices Market, By Functionality, By Value, 2023-2029 (USD Billion)
Table A27: Brazil Bluetooth Devices Market, By Sales Channel, By Value, 2019-2022 (USD Billion)
Table A28: Brazil Bluetooth Devices Market, By Sales Channel, By Value, 2023-2029 (USD Billion)
Table A29: Rest of Americas Bluetooth Devices Market, By Device Type, By Value, 2019-2022 (USD Billion)
Table A30: Rest of Americas Bluetooth Devices Market, By Device Type, By Value, 2023-2029 (USD Billion)
Table A31: Rest of Americas Bluetooth Devices Market, By Version, By Value, 2019-2022 (USD Billion)
Table A32: Rest of Americas Bluetooth Devices Market, By Version, By Value, 2023-2029 (USD Billion)
Table A33: Rest of Americas Bluetooth Devices Market, By Functionality, By Value, 2019-2022 (USD Billion)
Table A34: Rest of Americas Bluetooth Devices Market, By Functionality, By Value, 2019-2022 (USD Billion)
Table A35: Rest of Americas Bluetooth Devices Market, By Sales Channel, By Value, 2019-2022 (USD Billion)
Table A36: Rest of Americas Bluetooth Devices Market, By Sales Channel, By Value, 2023-2029 (USD Billion)
Table A37: Germany Bluetooth Devices Market, By Device Type, By Value, 2019-2022 (USD Billion)
Table A38: Germany Bluetooth Devices Market, By Device Type, By Value, 2023-2029 (USD Billion)
Table A39: Germany Bluetooth Devices Market, By Version, By Value, 2019-2022 (USD Billion)
Table A40: Germany Bluetooth Devices Market, By Version, By Value, 2023-2029 (USD Billion)
Table A41: Germany Bluetooth Devices Market, By Functionality, By Value, 2019-2022 (USD Billion)
Table A42: Germany Bluetooth Devices Market, By Functionality, By Value, 2023-2029 (USD Billion)
Table A43: Germany Bluetooth Devices Market, By Sales Channel, By Value, 2019-2022 (USD Billion)
Table A44: Germany Bluetooth Devices Market, By Sales Channel, By Value, 2023-2029 (USD Billion)
Table A45: United Kingdom Bluetooth Devices Market, By Device Type, By Value, 2019-2022 (USD Billion)
Table A46: United Kingdom Bluetooth Devices Market, By Device Type, By Value, 2023-2029 (USD Billion)
Table A47: United Kingdom Bluetooth Devices Market, By Version, By Value, 2019-2022 (USD Billion)
Table A48: United Kingdom Bluetooth Devices Market, By Version, By Value, 2023-2029 (USD Billion)
Table A49: United Kingdom Bluetooth Devices Market, By Functionality, By Value, 2019-2022 (USD Billion)
Table A50: United Kingdom Bluetooth Devices Market, By Functionality, By Value, 2023-2029 (USD Billion)
Table A51: United Kingdom Bluetooth Devices Market, By Sales Channel, By Value, 2019-2022 (USD Billion)
Table A52: United Kingdom Bluetooth Devices Market, By Sales Channel, By Value, 2023-2029 (USD Billion)
Table A53: France Bluetooth Devices Market, By Device Type, By Value, 2019-2022 (USD Billion)
Table A54: France Bluetooth Devices Market, By Device Type, By Value, 2023-2029 (USD Billion)
Table A55: France Bluetooth Devices Market, By Version, By Value, 2019-2022 (USD Billion)
Table A56: France Bluetooth Devices Market, By Version, By Value, 2023-2029 (USD Billion)
Table A57: France Bluetooth Devices Market, By Functionality, By Value, 2019-2022 (USD Billion)
Table A58: France Bluetooth Devices Market, By Functionality, By Value, 2023-2029 (USD Billion)
Table A59: France Bluetooth Devices Market, By Sales Channel, By Value, 2019-2022 (USD Billion)
Table A60: France Bluetooth Devices Market, By Sales Channel, By Value, 2023-2029 (USD Billion)
Table A61: Rest of Europe Bluetooth Devices Market, By Device Type, By Value, 2019-2022 (USD Billion)
Table A62: Rest of Europe Bluetooth Devices Market, By Device Type, By Value, 2023-2029 (USD Billion)
Table A63: Rest of Europe Bluetooth Devices Market, By Version, By Value, 2019-2022 (USD Billion)
Table A64: Rest of Europe Bluetooth Devices Market, By Version, By Value, 2023-2029 (USD Billion)
Table A65: Rest of Europe Bluetooth Devices Market, By Functionality, By Value, 2019-2022 (USD Billion)
Table A66: Rest of Europe Bluetooth Devices Market, By Functionality, By Value, 2023-2029 (USD Billion)
Table A67: Rest of Europe Bluetooth Devices Market, By Sales Channel, By Value, 2019-2022 (USD Billion)
Table A68: Rest of Europe Bluetooth Devices Market, By Sales Channel, By Value, 2023-2029 (USD Billion)
Table A69: China Bluetooth Devices Market, By Device Type, By Value, 2019-2022 (USD Billion)
Table A70: China Bluetooth Devices Market, By Device Type, By Value, 2023-2029 (USD Billion)
Table A71: China Bluetooth Devices Market, By Version, By Value, 2019-2022 (USD Billion)
Table A72: China Bluetooth Devices Market, By Version, By Value, 2023-2029 (USD Billion)
Table A73: China Bluetooth Devices Market, By Functionality, By Value, 2019-2022 (USD Billion)
Table A74: China Bluetooth Devices Market, By Functionality, By Value, 2023-2029 (USD Billion)
Table A75: China Bluetooth Devices Market, By Sales Channel, By Value, 2019-2022 (USD Billion)
Table A76: China Bluetooth Devices Market, By Sales Channel, By Value, 2023-2029 (USD Billion)
Table A77: Japan Bluetooth Devices Market, By Device Type, By Value, 2019-2022 (USD Billion)
Table A78: Japan Bluetooth Devices Market, By Device Type, By Value, 2023-2029 (USD Billion)
Table A79: Japan Bluetooth Devices Market, By Version, By Value, 2019-2022 (USD Billion)
Table A80: Japan Bluetooth Devices Market, By Version, By Value, 2023-2029 (USD Billion)
Table A81: Japan Bluetooth Devices Market, By Functionality, By Value, 2019-2022 (USD Billion)
Table A82: Japan Bluetooth Devices Market, By Functionality, By Value, 2023-2029 (USD Billion)
Table A83: Japan Bluetooth Devices Market, By Sales Channel, By Value, 2019-2022 (USD Billion)
Table A84: Japan Bluetooth Devices Market, By Sales Channel, By Value, 2023-2029 (USD Billion)
Table A85: South Korea Bluetooth Devices Market, By Device Type, By Value, 2019-2022 (USD Billion)
Table A86: South Korea Bluetooth Devices Market, By Device Type, By Value, 2023-2029 (USD Billion)
Table A87: South Korea Bluetooth Devices Market, By Version, By Value, 2019-2022 (USD Billion)
Table A88: South Korea Bluetooth Devices Market, By Version, By Value, 2023-2029 (USD Billion)
Table A89: South Korea Bluetooth Devices Market, By Functionality, By Value, 2019-2022 (USD Billion)
Table A90: South Korea Bluetooth Devices Market, By Functionality, By Value, 2023-2029 (USD Billion)
Table A91: South Korea Bluetooth Devices Market, By Sales Channel, By Value, 2019-2022 (USD Billion)
Table A92: South Korea Bluetooth Devices Market, By Sales Channel, By Value, 2023-2029 (USD Billion)
Table A93: India Bluetooth Devices Market, By Device Type, By Value, 2019-2022 (USD Billion)
Table A94: India Bluetooth Devices Market, By Device Type, By Value, 2023-2029 (USD Billion)
Table A95: India Bluetooth Devices Market, By Version, By Value, 2019-2022 (USD Billion)
Table A96: India Bluetooth Devices Market, By Version, By Value, 2023-2029 (USD Billion)
Table A97: India Bluetooth Devices Market, By Functionality, By Value, 2019-2022 (USD Billion)
Table A98: India Bluetooth Devices Market, By Functionality, By Value, 2023-2029 (USD Billion)
Table A99: India Bluetooth Devices Market, By Sales Channel, By Value, 2019-2022 (USD Billion)
Table A100: India Bluetooth Devices Market, By Sales Channel, By Value, 2023-2029 (USD Billion)
Table A101: Rest of Asia Pacific Bluetooth Devices Market, By Device Type, By Value, 2019-2022 (USD Billion)
Table A102: Rest of Asia Pacific Bluetooth Devices Market, By Device Type, By Value, 2023-2029 (USD Billion)
Table A103: Rest of Asia Pacific Bluetooth Devices Market, By Version, By Value, 2019-2022 (USD Billion)
Table A104: Rest of Asia Pacific Bluetooth Devices Market, By Version, By Value, 2023-2029 (USD Billion)
Table A105: Rest of Asia Pacific Bluetooth Devices Market, By Functionality, By Value, 2019-2022 (USD Billion)
Table A106: Rest of Asia Pacific Bluetooth Devices Market, By Functionality, By Value, 2023-2029 (USD Billion)
Table A107: Rest of Asia Pacific Bluetooth Devices Market, By Sales Channel, By Value, 2019-2022 (USD Billion)
Table A108: Rest of Asia Pacific Bluetooth Devices Market, By Sales Channel, By Value, 2023-2029 (USD Billion)
Table A109: Apple, Inc. Financials, 2020-2022
Table A110: Logitech International S.A. Financials, 2020-2022
Table A111: Panasonic Holdings Corp. Financials, 2020-2022
Table A112: Samsung Electronics Co. Ltd. Financials, 2020-2022
Table A113: Dell Technologies Inc. Financials, 2020-2022
Table A114: Sony Group Corp. Financials, 2020-2022
Table A115: GN Store Nord A/S Financials, 2020-2022
Table A116: Huawei Technologies Co., Ltd. Financials, 2020-2022
Table A117: Xiaomi Corporation Financials, 2020-2022
Table A118: Sennheiser Electronic GmbH and Co. KG Financials, 2020-2022
Executive Summary
Azoth Analytics has released a research report titled "Global Bluetooth Devices Market (2024 Edition)" which provides a complete analysis of the Global Bluetooth Devices Market industry in terms of Value (USD Billion) and Volume (Million Units), market segmentation by Device Type (Wearables, Headphone, Speaker, PC Peripherals & Accessories, Others), Version (Bluetooth 5.0, Bluetooth 4.0), Functionality (Audio Streaming, Data Transfer, Location Services, Device Networks) and Sales Channel (Online, Offline) for the historical period of 2019-2022, estimates of 2023 and the forecast period of 2024-2029. The research report also assesses growth indicators, restraints, sales growth and demand risk, and other important statistics, as well as a full assessment of current and future market trends that are relevant to the market's evolution.
During the forecast period, 2024-2029, the Global Bluetooth Devices Market is expected to expand at a CAGR of 13.2%. The Global Bluetooth Devices market is expected to grow at an extraordinary rate driven by significant expenditures from key players. The Global Bluetooth Devices market is expected to increase from USD 41.6 billion in 2022 to USD 98.2 billion in 2029, according to Azoth Analytics estimates. The market is being driven by the growing need for hands-free communication and audio streaming in cars, the increasing acceptance of smart devices and wireless connectivity solutions, and the increasing desirability of wearable technologies. The growing need among sectors for connected and energy-efficient devices is one of the main drivers of market growth. The demand for Bluetooth Low Energy in home automation systems has increased due to the smart home trend, while the growth of BLE-enabled wearables has been driven by the growing awareness of health and fitness.
Growing Need for a Wireless Network
The rapid growth of the global market for Bluetooth devices is mostly due to the rising demand for wireless networks around the world. Bluetooth technology emerges as a dynamic answer as customers and companies together look to save costs and simplify old wired setups. Wearables, smart home appliances, IOT apps, and audio accessories like speakers and headphones are just a few of the uses for Bluetooth devices' seamless wireless connectivity.
Many industries consider Bluetooth technology beneficial because it streamlines connectivity and reduces complexity. Bluetooth devices improve productivity in business environments by facilitating effective communication and collaboration. Additionally, the ease of Bluetooth audio solutions is driving a boom in demand in the consumer electronics sector.
Competition with Other Wireless Technologies
Modern wireless technologies that allow faster data transfers and reduced latency, such as Wi-Fi 6 and 5G, are beginning to expand into applications that were previously linked to Bluetooth. Bluetooth's market share may be restricted in particular applications by alternatives that perform better in situations requiring high-speed communication or widespread device connectivity. Furthermore, Zigbee and Z-Wave, two specialized wireless protocols, have been established in home automation and Internet of Things applications, challenging Bluetooth's domination in these fields where dependable communication, low power consumption, and mesh networking are essential.
As companies adopt wireless protocols customized to specific uses and investigate new technologies such as Ultra-Wideband (UWB) for accurate spatial awareness, Bluetooth needs to display its adaptability and sustain its competitive advantage in a wide range of applications.
Scope of the Report
- The report analyses the Global Bluetooth Devices Market by Value (USD Billion).
- The report analyses the Global Bluetooth Devices Market by Volume (Million Units).
- The report presents the analysis of the Global Bluetooth Devices Market for the historical period of 2019-2022, the estimated year 2023 and the forecast period of 2024-2029.
- The report analyses the Global Bluetooth Devices Market by Device Type (Wearables, Headphone, Speaker, PC Peripherals & Accessories, Other Devices).
- The report analyses the Bluetooth Devices Market by Version (Bluetooth 5.0, Bluetooth 4.0).
- The report analyses the Bluetooth Devices Market by Functionality (Audio Streaming, Data Transfer, Location Services, Device Networks).
- The report analyses the Bluetooth Devices Market by Sales Channel (Online, Offline).
- The report analyses the Bluetooth Devices Market by Region (Americas, Europe, Asia Pacific, Middle East & Africa).
- The report analyses the Bluetooth Devices Market by Country (United States, Canada, Brazil, Germany, United Kingdom, France, China, Japan, South Korea, India).
- The key insights of the report have been presented through the frameworks of SWOT and Porter's Five Forces Analysis.
- Also, the major opportunities, trends, drivers and challenges of the industry have been analyzed in the report.
- The report tracks competitive developments, strategies, mergers and acquisitions and new product development. The companies analysed in the report include Apple, Inc., Logitech International S.A., Panasonic Holdings Corp., Samsung Electronics Co. Ltd., Dell Technologies Inc., Sony Group Corp., GN Store Nord A/S, Huawei Technologies Co., Ltd., Xiaomi Corporation, Sennheiser Electronic GmbH and Co. KG.
Table of Contents
1. Market Background
- 1.1 Scope and Product Outlook
- 1.2 Executive Summary
- 1.3 Research Methodology
2. Strategic Recommendations
3. Global Bluetooth Devices Market: Historic and Forecast (2019-2029)
- 3.1 Impact Analysis of Macro Economic Factors on Bluetooth Devices Market
- 3.2 Global Bluetooth Devices Market: Top 5 wearable device companies by shipment volume
- 3.3 Global Bluetooth Devices Market: Bluetooth Low Energy IC Market Share
- 3.4 Global Bluetooth Devices Market: Major BLE SoC Supplier
- 3.5 Global Bluetooth Devices Market: Dashboard
- 3.6 Global Bluetooth Devices Market: Market Value Assessment, 2019-2029 (USD Billion)
- 3.7 Global Bluetooth Devices Market: Market Volume Assessment, 2019-2029 (in Units'M)
- 3.8 Average Price Analysis of Bluetooth Devices Globally
- 3.9 Impact of COVID-19 on the Bluetooth Devices Market
- 3.10 Global Bluetooth Devices Market Segmentation: By Device Type
- 3.10.1 Global Bluetooth Devices Market, By Device Type Overview
- 3.10.2 Global Bluetooth Devices Market Size, By Wearables, By Value, 2019H-2029F (USD Billion & CAGR)
- 3.10.3 Global Bluetooth Devices Market Size, By Headphone, By Value, 2019H-2029F (USD Billion & CAGR)
- 3.10.4 Global Bluetooth Devices Market Size, By Speaker, By Value, 2019H-2029F (USD Billion & CAGR)
- 3.10.5 Global Bluetooth Devices Market Size, By PC Peripherals & Accessories, By Value, 2019H-2029F (USD Billion & CAGR)
- 3.10.6 Global Bluetooth Devices Market Size, By Other Devices, By Value, 2019H-2029F (USD Billion & CAGR)
- 3.11 Global Bluetooth Devices Market Segmentation: By Version
- 3.11.1 Global Bluetooth Devices Market, By Version Overview
- 3.11.2 Global Bluetooth Devices Market Size, By Bluetooth 5.0, By Value, 2019H-2029F (USD Billion & CAGR)
- 3.11.3 Global Bluetooth Devices Market Size, By Bluetooth 4.0, By Value, 2019H-2029F (USD Billion & CAGR)
- 3.12 Global Bluetooth Devices Market Segmentation: By Functionality
- 3.12.1 Global Bluetooth Devices Market, By Functionality Overview
- 3.12.2 Global Bluetooth Devices Market Size, By Audio Streaming, By Value, 2019H-2029F (USD Billion & CAGR)
- 3.12.3 Global Bluetooth Devices Market Size, By Data Transfer, By Value, 2019H-2029F (USD Billion & CAGR)
- 3.12.4 Global Bluetooth Devices Market Size, By Location Services, By Value, 2019H-2029F (USD Billion & CAGR)
- 3.12.5 Global Bluetooth Devices Market Size, By Device Networks, By Value, 2019H-2029F (USD Billion & CAGR)
- 3.13 Global Bluetooth Devices Market Segmentation: By Sales Channel
- 3.13.1 Global Bluetooth Devices Market, By Sales Channel Overview
- 3.13.2 Global Bluetooth Devices Market Size, By Online, By Value, 2019H-2029F (USD Billion & CAGR)
- 3.13.3 Global Bluetooth Devices Market Size, By Offline, By Value, 2019H-2029F (USD Billion & CAGR)
4. Global Bluetooth Devices Market: Regional Analysis
- 4.1 Regional Coverage of the Study
- 4.2 Regional Snapshot
5. Americas Bluetooth Devices Market: Historic and Forecast (2019-2029)
- 5.1 Americas Bluetooth Devices Market: Snapshot
- 5.2 Americas Bluetooth Devices Market: Market Value Assessment, 2019-2029 (USD Billion & CAGR)
- 5.3 Americas Bluetooth Devices Market: Market Volume Assessment, 2019-2029 (in Units'M)
- 5.4 Americas Bluetooth Devices Market: Key Factors
- 5.5 Americas Bluetooth Devices Market: Segment Analysis
- 5.6 Americas Bluetooth Devices Market Segmentation: By Device Type
- 5.6.1 Americas Bluetooth Devices Market, By Device Type Overview
- 5.6.2 Americas Bluetooth Devices Market Size, By Wearables, By Value, 2019H-2029F (USD Billion & CAGR)
- 5.6.3 Americas Bluetooth Devices Market Size, By Headphone, By Value, 2019H-2029F (USD Billion & CAGR)
- 5.6.4 Americas Bluetooth Devices Market Size, By Speaker, By Value, 2019H-2029F (USD Billion & CAGR)
- 5.6.5 Americas Bluetooth Devices Market Size, By PC Peripherals & Accessories, By Value, 2019H-2029F (USD Billion & CAGR)
- 5.6.6 Americas Bluetooth Devices Market Size, By Other Devices, By Value, 2019H-2029F (USD Billion & CAGR)
- 5.7 Americas Bluetooth Devices Market Segmentation: By Version
- 5.7.1 Americas Bluetooth Devices Market, By Version Overview
- 5.7.2 Americas Bluetooth Devices Market Size, By Bluetooth 5.0, By Value, 2019H-2029F (USD Billion & CAGR)
- 5.7.3 Americas Bluetooth Devices Market Size, By Bluetooth 4.0, By Value, 2019H-2029F (USD Billion & CAGR)
- 5.8 Americas Bluetooth Devices Market Segmentation: By Functionality
- 5.8.1 Americas Bluetooth Devices Market, By Functionality Overview
- 5.8.2 Americas Bluetooth Devices Market Size, By Audio Streaming, By Value, 2019H-2029F (USD Billion & CAGR)
- 5.8.3 Americas Bluetooth Devices Market Size, By Data Transfer, By Value, 2019H-2029F (USD Billion & CAGR)
- 5.8.4 Americas Bluetooth Devices Market Size, By Location Services, By Value, 2019H-2029F (USD Billion & CAGR)
- 5.8.5 Americas Bluetooth Devices Market Size, By Device Networks, By Value, 2019H-2029F (USD Billion & CAGR)
- 5.9 Americas Bluetooth Devices Market Segmentation: By Sales Channel
- 5.9.1 Americas Bluetooth Devices Market, By Sales Channel Overview
- 5.9.2 Americas Bluetooth Devices Market Size, By Online, By Value, 2019H-2029F (USD Billion & CAGR)
- 5.9.3 Americas Bluetooth Devices Market Size, By Offline, By Value, 2019H-2029F (USD Billion & CAGR)
- 5.10 Americas Bluetooth Devices Market Segmentation: By Country
- 5.10.1 Americas Bluetooth Devices Market, By Country Overview
- 5.10.2 United States Bluetooth Devices Market: Market Size and CAGR, 2019-2029 (USD Billion & CAGR)
- 5.10.2.1 United States Bluetooth Devices Market, By Device Type
- 5.10.2.2 United States Bluetooth Devices Market, By Version
- 5.10.2.3 United States Bluetooth Devices Market, By Functionality
- 5.10.2.4 United States Bluetooth Devices Market, By Sales Channel
- 5.10.3 Canada Bluetooth Devices Market: Market Size and CAGR, 2019-2029 (USD Billion & CAGR)
- 5.10.3.1 Canada Bluetooth Devices Market, By Device Type
- 5.10.3.2 Canada Bluetooth Devices Market, By Version
- 5.10.3.3 Canada Bluetooth Devices Market, By Functionality
- 5.10.3.4 Canada Bluetooth Devices Market, By Sales Channel
- 5.10.4 Brazil Bluetooth Devices Market: Market Size and CAGR, 2019-2029 (USD Billion & CAGR)
- 5.10.4.1 Brazil Bluetooth Devices Market, By Device Type
- 5.10.4.2 Brazil Bluetooth Devices Market, By Version
- 5.10.4.3 Brazil Bluetooth Devices Market, By Functionality
- 5.10.4.4 Brazil Bluetooth Devices Market, By Sales Channel
- 5.10.5 Rest of Americas Bluetooth Devices Market: Market Size and CAGR, 2019-2029 (USD Billion & CAGR)
- 5.10.5.1 Rest of Americas Bluetooth Devices Market, By Device Type
- 5.10.5.2 Rest of Americas Bluetooth Devices Market, By Version
- 5.10.5.3 Rest of Americas Bluetooth Devices Market, By Functionality
- 5.10.5.4 Rest of Americas Bluetooth Devices Market, By Sales Channel
6. Europe Bluetooth Devices Market: Historic and Forecast (2019-2029)
- 6.1 Europe Bluetooth Devices Market: Snapshot
- 6.2 Europe Bluetooth Devices Market: Market Value Assessment, 2019-2029 (USD Billion & CAGR)
- 6.3 Europe Bluetooth Devices Market: Market Volume Assessment, 2019-2029 (in Units'M)
- 6.4 Europe Bluetooth Devices Market: Key Factors
- 6.5 Europe Bluetooth Devices Market: Segment Analysis
- 6.6 Europe Bluetooth Devices Market Segmentation: By Device Type
- 6.6.1 Europe Bluetooth Devices Market, By Device Type Overview
- 6.6.2 Europe Bluetooth Devices Market Size, By Wearables, By Value, 2019H-2029F (USD Billion & CAGR)
- 6.6.3 Europe Bluetooth Devices Market Size, By Headphone, By Value, 2019H-2029F (USD Billion & CAGR)
- 6.6.4 Europe Bluetooth Devices Market Size, By Speaker, By Value, 2019H-2029F (USD Billion & CAGR)
- 6.6.5 Europe Bluetooth Devices Market Size, By PC Peripherals & Accessories, By Value, 2019H-2029F (USD Billion & CAGR)
- 6.6.6 Europe Bluetooth Devices Market Size, By Other Devices, By Value, 2019H-2029F (USD Billion & CAGR)
- 6.7 Europe Bluetooth Devices Market Segmentation: By Version
- 6.7.1 Europe Bluetooth Devices Market, By Version Overview
- 6.7.2 Europe Bluetooth Devices Market Size, By Bluetooth 5.0, By Value, 2019H-2029F (USD Billion & CAGR)
- 6.7.3 Europe Bluetooth Devices Market Size, By Bluetooth 4.0, By Value, 2019H-2029F (USD Billion & CAGR)
- 6.8 Europe Bluetooth Devices Market Segmentation: By Functionality
- 6.8.1 Europe Bluetooth Devices Market, By Functionality Overview
- 6.8.2 Europe Bluetooth Devices Market Size, By Audio Streaming, By Value, 2019H-2029F (USD Billion & CAGR)
- 6.8.3 Europe Bluetooth Devices Market Size, By Data Transfer, By Value, 2019H-2029F (USD Billion & CAGR)
- 6.8.4 Europe Bluetooth Devices Market Size, By Location Services, By Value, 2019H-2029F (USD Billion & CAGR)
- 6.8.5 Europe Bluetooth Devices Market Size, By Device Networks, By Value, 2019H-2029F (USD Billion & CAGR)
- 6.9 Europe Bluetooth Devices Market Segmentation: By Sales Channel
- 6.9.1 Europe Bluetooth Devices Market, By Sales Channel Overview
- 6.9.2 Europe Bluetooth Devices Market Size, By Online, By Value, 2019H-2029F (USD Billion & CAGR)
- 6.9.3 Europe Bluetooth Devices Market Size, By Offline, By Value, 2019H-2029F (USD Billion & CAGR)
- 6.10 Europe Bluetooth Devices Market Segmentation: By Country
- 6.10.1 Europe Bluetooth Devices Market, By Country Overview
- 6.10.2 Germany Bluetooth Devices Market: Market Size and CAGR, 2019-2029 (USD Billion & CAGR)
- 6.10.2.1 Germany Bluetooth Devices Market, By Device Type
- 6.10.2.2 Germany Bluetooth Devices Market, By Version
- 6.10.2.3 Germany Bluetooth Devices Market, By Functionality
- 6.10.2.4 Germany Bluetooth Devices Market, By Sales Channel
- 6.10.3 United Kingdom Bluetooth Devices Market: Market Size and CAGR, 2019-2029 (USD Billion & CAGR)
- 6.10.3.1 United Kingdom Bluetooth Devices Market, By Device Type
- 6.10.3.2 United Kingdom Bluetooth Devices Market, By Version
- 6.10.3.3 United Kingdom Bluetooth Devices Market, By Functionality
- 6.10.3.4 United Kingdom Bluetooth Devices Market, By Sales Channel
- 6.10.4 France Bluetooth Devices Market: Market Size and CAGR, 2019-2029 (USD Billion & CAGR)
- 6.10.4.1 France Bluetooth Devices Market, By Device Type
- 6.10.4.2 France Bluetooth Devices Market, By Version
- 6.10.4.3 France Bluetooth Devices Market, By Functionality
- 6.10.4.4 France Bluetooth Devices Market, By Sales Channel
- 6.10.5 Rest of Europe Bluetooth Devices Market: Market Size and CAGR, 2019-2029 (USD Billion & CAGR)
- 6.10.5.1 Rest of Europe Bluetooth Devices Market, By Device Type
- 6.10.5.2 Rest of Europe Bluetooth Devices Market, By Version
- 6.10.5.3 Rest of Europe Bluetooth Devices Market, By Functionality
- 6.10.5.4 Rest of Europe Bluetooth Devices Market, By Sales Channel
7. Asia Pacific Bluetooth Devices Market: Historic and Forecast (2019-2029)
- 7.1 Asia Pacific Bluetooth Devices Market: Snapshot
- 7.2 Asia Pacific Bluetooth Devices Market: Market Value Assessment, 2019-2029 (USD Billion & CAGR)
- 7.3 Asia Pacific Bluetooth Devices Market: Market Volume Assessment, 2019-2029 (in Units'M)
- 7.4 Asia Pacific Bluetooth Devices Market: Key Factors
- 7.5 Asia Pacific Bluetooth Devices Market: Segment Analysis
- 7.6 Asia Pacific Bluetooth Devices Market Segmentation: By Device Type
- 7.6.1 Asia Pacific Bluetooth Devices Market, By Device Type Overview
- 7.6.2 Asia Pacific Bluetooth Devices Market Size, By Wearables, By Value, 2019H-2029F (USD Billion & CAGR)
- 7.6.3 Asia Pacific Bluetooth Devices Market Size, By Headphone, By Value, 2019H-2029F (USD Billion & CAGR)
- 7.6.4 Asia Pacific Bluetooth Devices Market Size, By Speaker, By Value, 2019H-2029F (USD Billion & CAGR)
- 7.6.5 Asia Pacific Bluetooth Devices Market Size, By PC Peripherals & Accessories, By Value, 2019H-2029F (USD Billion & CAGR)
- 7.6.6 Asia Pacific Bluetooth Devices Market Size, By Other Devices, By Value, 2019H-2029F (USD Billion & CAGR)
- 7.7 Asia Pacific Bluetooth Devices Market Segmentation: By Version
- 7.7.1 Asia Pacific Bluetooth Devices Market, By Version Overview
- 7.7.2 Asia Pacific Bluetooth Devices Market Size, By Bluetooth 5.0, By Value, 2019H-2029F (USD Billion & CAGR)
- 7.7.3 Asia Pacific Bluetooth Devices Market Size, By Bluetooth 4.0, By Value, 2019H-2029F (USD Billion & CAGR)
- 7.8 Asia Pacific Bluetooth Devices Market Segmentation: By Functionality
- 7.8.1 Asia Pacific Bluetooth Devices Market, By Functionality Overview
- 7.8.2 Asia Pacific Bluetooth Devices Market Size, By Audio Streaming, By Value, 2019H-2029F (USD Billion & CAGR)
- 7.8.3 Asia Pacific Bluetooth Devices Market Size, By Data Transfer, By Value, 2019H-2029F (USD Billion & CAGR)
- 7.8.4 Asia Pacific Bluetooth Devices Market Size, By Location Services, By Value, 2019H-2029F (USD Billion & CAGR)
- 7.8.5 Asia Pacific Bluetooth Devices Market Size, By Device Networks, By Value, 2019H-2029F (USD Billion & CAGR)
- 7.9 Asia Pacific Bluetooth Devices Market Segmentation: By Sales Channel
- 7.9.1 Asia Pacific Bluetooth Devices Market, By Sales Channel Overview
- 7.9.2 Asia Pacific Bluetooth Devices Market Size, By Online, By Value, 2019H-2029F (USD Billion & CAGR)
- 7.9.3 Asia Pacific Bluetooth Devices Market Size, By Offline, By Value, 2019H-2029F (USD Billion & CAGR)
- 7.10 Asia Pacific Bluetooth Devices Market Segmentation: By Country
- 7.10.1 Asia Pacific Bluetooth Devices Market, By Country Overview
- 7.10.2 China Bluetooth Devices Market: Market Size and CAGR, 2019-2029 (USD Billion & CAGR)
- 7.10.2.1 China Bluetooth Devices Market, By Device Type
- 7.10.2.2 China Bluetooth Devices Market, By Version
- 7.10.2.3 China Bluetooth Devices Market, By Functionality
- 7.10.2.4 China Bluetooth Devices Market, By Sales Channel
- 7.10.3 Japan Bluetooth Devices Market: Market Size and CAGR, 2019-2029 (USD Billion & CAGR)
- 7.10.3.1 Japan Bluetooth Devices Market, By Device Type
- 7.10.3.2 Japan Bluetooth Devices Market, By Version
- 7.10.3.3 Japan Bluetooth Devices Market, By Functionality
- 7.10.3.4 Japan Bluetooth Devices Market, By Sales Channel
- 7.10.4 South Korea Bluetooth Devices Market: Market Size and CAGR, 2019-2029 (USD Billion & CAGR)
- 7.10.4.1 South Korea Bluetooth Devices Market, By Device Type
- 7.10.4.2 South Korea Bluetooth Devices Market, By Version
- 7.10.4.3 South Korea Bluetooth Devices Market, By Functionality
- 7.10.4.4 South Korea Bluetooth Devices Market, By Sales Channel
- 7.10.5 India Bluetooth Devices Market: Market Size and CAGR, 2019-2029 (USD Billion & CAGR)
- 7.10.5.1 India Bluetooth Devices Market, By Device Type
- 7.10.5.2 India Bluetooth Devices Market, By Version
- 7.10.5.3 India Bluetooth Devices Market, By Functionality
- 7.10.5.4 India Bluetooth Devices Market, By Sales Channel
- 7.10.6 Rest of Asia Pacific Bluetooth Devices Market: Market Size and CAGR, 2019-2029 (USD Billion & CAGR)
- 7.10.6.1 Rest of Asia Pacific Bluetooth Devices Market, By Device Type
- 7.10.6.2 Rest of Asia Pacific Bluetooth Devices Market, By Version
- 7.10.6.3 Rest of Asia Pacific Bluetooth Devices Market, By Functionality
- 7.10.6.4 Rest of Asia Pacific Bluetooth Devices Market, By Sales Channel
8. Middle East & Africa Bluetooth Devices Market: Historic and Forecast (2019-2029)
- 8.1 Middle East & Africa Bluetooth Devices Market: Snapshot
- 8.2 Middle East & Africa Bluetooth Devices Market: Market Value Assessment, 2019-2029 (USD Billion & CAGR)
- 8.3 Middle East & Africa Bluetooth Devices Market: Market Volume Assessment, 2019-2029 (in Units M)
- 8.4 Middle East & Africa Bluetooth Devices Market: Key Factors
- 8.5 Middle East & Africa Bluetooth Devices Market: Segment Analysis
- 8.6 Middle East & Africa Bluetooth Devices Market Segmentation: By Device Type
- 8.6.1 Middle East & Africa Bluetooth Devices Market, By Device Type Overview
- 8.6.2 Middle East & Africa Bluetooth Devices Market Size, By Wearables, By Value, 2019H-2029F (USD Billion & CAGR)
- 8.6.3 Middle East & Africa Bluetooth Devices Market Size, By Headphone, By Value, 2019H-2029F (USD Billion & CAGR)
- 8.6.4 Middle East & Africa Bluetooth Devices Market Size, By Speaker, By Value, 2019H-2029F (USD Billion & CAGR)
- 8.6.5 Middle East & Africa Bluetooth Devices Market Size, By PC Peripherals & Accessories, By Value, 2019H-2029F (USD Billion & CAGR)
- 8.6.6 Middle East & Africa Bluetooth Devices Market Size, By Other Devices, By Value, 2019H-2029F (USD Billion & CAGR)
- 8.7 Middle East & Africa Bluetooth Devices Market Segmentation: By Version
- 8.7.1 Middle East & Africa Bluetooth Devices Market, By Version Overview
- 8.7.2 Middle East & Africa Bluetooth Devices Market Size, By Bluetooth 5.0, By Value, 2019H-2029F (USD Billion & CAGR)
- 8.7.3 Middle East & Africa Bluetooth Devices Market Size, By Bluetooth 4.0, By Value, 2019H-2029F (USD Billion & CAGR)
- 8.8 Middle East & Africa Bluetooth Devices Market Segmentation: By Functionality
- 8.8.1 Middle East & Africa Bluetooth Devices Market, By Functionality Overview
- 8.8.2 Middle East & Africa Bluetooth Devices Market Size, By Audio Streaming, By Value, 2019H-2029F (USD Billion & CAGR)
- 8.8.3 Middle East & Africa Bluetooth Devices Market Size, By Data Transfer, By Value, 2019H-2029F (USD Billion & CAGR)
- 8.8.4 Middle East & Africa Bluetooth Devices Market Size, By Location Services, By Value, 2019H-2029F (USD Billion & CAGR)
- 8.8.5 Middle East & Africa Bluetooth Devices Market Size, By Device Networks, By Value, 2019H-2029F (USD Billion & CAGR)
- 8.9 Middle East & Africa Bluetooth Devices Market Segmentation: By Sales Channel
- 8.9.1 Middle East & Africa Bluetooth Devices Market, By Sales Channel Overview
- 8.9.2 Middle East & Africa Bluetooth Devices Market Size, By Online, By Value, 2019H-2029F (USD Billion & CAGR)
- 8.9.3 Middle East & Africa Bluetooth Devices Market Size, By Offline, By Value, 2019H-2029F (USD Billion & CAGR)
9. Market Dynamics
- 9.1 Impact Assessment of Market Dynamics on the Global Bluetooth Devices Market
- 9.2 Drivers
- 9.3 Restraints
- 9.4 Trends
10. Industry Ecosystem Analysis
- 10.1 Value Chain Analysis
- 10.2 Porter's Five Forces Model
11. Competitive Positioning
- 11.1 Companies' Product Positioning
- 11.2 Market Position Matrix
- 11.3 Market Share Analysis of Bluetooth Devices Market
- 11.4 Company Profiles
- 11.4.1 Apple, Inc.
- 11.4.2 Logitech International S.A.
- 11.4.3 Panasonic Holdings Corp.
- 11.4.4 Samsung Electronics Co. Ltd.
- 11.4.5 Dell Technologies Inc.
- 11.4.6 Sony Group Corp.
- 11.4.7 GN Store Nord A/S
- 11.4.8 Huawei Technologies Co., Ltd.
- 11.4.9 Xiaomi Corporation
- 11.4.10 Sennheiser Electronic GmbH and Co. KG
