|
|
市場調査レポート
商品コード
1400508
企業向けクリーンエネルギーPPAの世界市場(2024年版):PPAタイプ別、技術タイプ別、地域別、国別の分析、市場考察、予測(2019年~2029年)Global Corporate Clean Energy PPA Market (2024 Edition): Analysis By PPA Type (Off-Site, On-Site), Technology Type (Solar PV, Wind, Others), By Region, By Country: Market Insights and Forecast (2019-2029) |
||||||

|
|||||||
|
|||||||

| 企業向けクリーンエネルギーPPAの世界市場(2024年版):PPAタイプ別、技術タイプ別、地域別、国別の分析、市場考察、予測(2019年~2029年) |
|
出版日: 2024年01月01日
発行: Azoth Analytics
ページ情報: 英文 180 Pages
納期: 即納可能
|

全表示
- 概要
- 図表
- 目次
世界の企業向けクリーンエネルギーPPAの市場規模は、2022年の54.01GWから2029年末までに2,283.52GWに達すると予測されています。2022年は企業向けPPAにとって変革の年であり、企業向け電力購入契約(PPA)を通じて36.7GWのクリーン電力取引が契約されました。米国、スペイン、インド、バングラデシュ、中国本土からの契約がもっとも多く、これらの地域がクリーンエネルギーへの企業のコミットメントを受け入れる道を開きました。
2022年、36ヶ国にまたがる160超の企業が企業向けPPA契約を発表し、2021年から約18%増加しました。世界全体では、2008年以来、148GWのクリーン電力取引が企業向けPPAを通じて行われています。このような企業PPAへの意欲は、昨年に証明されたように、2022年を通して、そして2023年にかけても高まり続けています。企業が持続可能性、経済性、評判などのさまざまな利益を活用しようとする中、企業向けPPAの増加は衰える気配を見せません。
当レポートでは、世界の企業向けクリーンエネルギーPPA市場について調査し、市場規模と予測、地域とセグメントの分析、主な動向と機会などの情報を提供しています。
目次
第1章 市場の背景
- 範囲と製品の見通し
- エグゼクティブサマリー
- 調査手法
第2章 戦略的推奨事項
第3章 世界の企業向けクリーンエネルギーPPA市場:実績と予測(2019年~2029年)
- 企業向けクリーンエネルギーPPA市場に対するマクロ経済要因の影響の分析
- 1人あたりのGDP:国別(2022年)
- 世界の発電量のシェア:地域別(1985年~2022年)
- 世界の電力生産:電源別(2021年)
- 1人あたりの発電量:国別(2022年)
- 化石燃料、原子力、再生可能エネルギー由来の1人あたりの電力量(2022年)
- 世界の電力の二酸化炭素強度(2022年)
- 世界の再生可能エネルギー由来の電力生産のシェア(2022年)
- 世界の太陽光発電由来の発電量のシェア(2022年)
- 世界の企業向けクリーンエネルギーPPA市場:ダッシュボード
- 世界の企業向けクリーンエネルギーPPA市場:市場規模とCAGR(2019年~2029年)
- 企業向けクリーンエネルギーPPA市場に対するCOVID-19の影響度
- 世界の企業向けクリーンエネルギーPPA市場セグメンテーション:PPAタイプ別
- 世界の企業向けクリーンエネルギーPPA市場:PPAタイプ別、概要
- 世界の企業向けクリーンエネルギーPPAの市場規模:オフサイトPPA(電力量)(2019年~2029年)
- 世界の企業向けクリーンエネルギーPPAの市場規模:オンサイトPPA(電力量)(2019年~2029年)
- 世界の企業向けクリーンエネルギーPPA市場セグメンテーション:技術タイプ別
- 世界の企業向けクリーンエネルギーPPA市場:技術タイプ別、概要
- 世界の企業向けクリーンエネルギーPPAの市場規模:太陽光発電(電力量)(2019年~2029年)
- 世界の企業向けクリーンエネルギーPPAの市場規模:風力(電力量)(2019年~2029年)
- 世界の企業向けクリーンエネルギーPPAの市場規模:その他(電力量)(2019年~2029年)
第4章 世界の企業向けクリーンエネルギーPPA市場、地域分析
- 研究の地域範囲
- 地域のスナップショット
第5章 北米の企業向けクリーンエネルギーPPA市場:実績と予測(2019年~2029年)
- 北米の企業向けクリーンエネルギーPPA市場:スナップショット
- 北米の企業向けクリーンエネルギーPPA市場:市場規模とCAGR(2019年~2029年)
- 北米の企業向けクリーンエネルギーPPA市場:主な要因
- 北米の企業向けクリーンエネルギーPPA市場セグメンテーション:PPAタイプ別
- 北米の企業向けクリーンエネルギーPPA市場セグメンテーション:技術タイプ別
- 北米の企業向けクリーンエネルギーPPA市場セグメンテーション:国別
- 米国の企業向けクリーンエネルギーPPA市場:市場規模とCAGR(2019年~2029年)
- カナダの企業向けクリーンエネルギーPPA市場:市場規模とCAGR(2019年~2029年)
第6章 欧州の企業向けクリーンエネルギーPPA市場:実績と予測(2019年~2029年)
- 欧州の企業向けクリーンエネルギーPPA市場:スナップショット
- 欧州の企業向けクリーンエネルギーPPA市場:市場規模とCAGR(2019年~2029年)
- 欧州の企業向けクリーンエネルギーPPA市場:主な要因
- 欧州の企業向けクリーンエネルギーPPA市場セグメンテーション:PPAタイプ別
- 欧州の企業向けクリーンエネルギーPPA市場セグメンテーション:技術タイプ別
- 欧州の企業向けクリーンエネルギーPPA市場:市場規模とCAGR(2019年~2029年)
- 英国の企業向けクリーンエネルギーPPA市場:市場規模とCAGR(2019年~2029年)
- フランスの企業向けクリーンエネルギーPPA市場:市場規模とCAGR(2019年~2029年)
- ドイツの企業向けクリーンエネルギーPPA市場:市場規模とCAGR(2019年~2029年)
- イタリアの企業向けクリーンエネルギーPPA市場:市場規模とCAGR(2019年~2029年)
- その他の欧州の企業向けクリーンエネルギーPPA市場:市場規模とCAGR(2019年~2029年)
第7章 アジア太平洋の企業向けクリーンエネルギーPPA市場:実績と予測(2019年~2029年)
- アジア太平洋の企業向けクリーンエネルギーPPA市場:スナップショット
- アジア太平洋の企業向けクリーンエネルギーPPA市場:市場規模とCAGR(2019年~2029年)
- アジア太平洋の企業向けクリーンエネルギーPPA市場:主な要因
- アジア太平洋の企業向けクリーンエネルギーPPA市場セグメンテーション:PPAタイプ別
- アジア太平洋の企業向けクリーンエネルギーPPA市場セグメンテーション:技術タイプ別
- アジア太平洋の企業向けクリーンエネルギーPPA市場:市場規模とCAGR(2019年~2029年)
- 中国の企業向けクリーンエネルギーPPA市場:市場規模とCAGR(2019年~2029年)
- 日本の企業向けクリーンエネルギーPPA市場:市場規模とCAGR(2019年~2029年)
- インドの企業向けクリーンエネルギーPPA市場:市場規模とCAGR(2019年~2029年)
- 韓国の企業向けクリーンエネルギーPPA市場:市場規模とCAGR(2019年~2029年)
- その他のアジア太平洋の企業向けクリーンエネルギーPPA市場:市場規模とCAGR(2019年~2029年)
第8章 その他の地域の企業向けクリーンエネルギーPPA市場:実績と予測(2019年~2029年)
- その他の地域の企業向けクリーンエネルギーPPA市場:スナップショット
- その他の地域の企業向けクリーンエネルギーPPA市場:市場規模とCAGR(2019年~2029年)
- その他の地域の企業向けクリーンエネルギーPPA市場セグメンテーション:PPAタイプ別
- その他の地域の企業向けクリーンエネルギーPPA市場セグメンテーション:技術タイプ別
第9章 市場力学
- 世界の企業向けクリーンエネルギーPPA市場に対する市場力学の影響の評価
- 促進要因
- 抑制要因
- 動向
第10章 産業エコシステム分析
- SWOT分析
List of Figures
List of Figures
- Figure 1: GDP Per Capita, By Countries, 2022
- Figure 2: Global Share of Electricity Production, By Region (1985-2022) (In %)
- Figure 3: Global Electricity Production, By Source, 2021 (In %)
- Figure 4: Per Capita Electricity Generation, By Country, 2022 (In KWh)
- Figure 5: Per capita electricity from fossil fuels, nuclear and renewables, 2022 (In %)
- Figure 6: Global Carbon intensity of electricity, 2022 (In GCo2)
- Figure 7: Global Share of electricity production from renewables, 2022 (In %)
- Figure 8: Global Share of Electricity Production from Solar, 2022 (In %)
- Figure 9: Global Share of Electricity Production from Wind, 2022 (In %)
- Figure 10: Global Corporate Clean Energy PPA Market Size, By Volume, 2019-2022 (In GW)
- Figure 11: Global Corporate Clean Energy PPA Market Size, By Volume, 2023-2029 (In GW)
- Figure 12: Global Corporate Clean Energy PPA CAGR, 2019-2022 and 2024-2029 (%)
- Figure 13: Global Corporate PPA Market Volume, 2010-2020 (In GW)
- Figure 14: Global Top 10 Corporate Offtakers, 2022
- Figure 15: Global Corporate Clean Energy PPA Market Size, By Off-Site PPA, By Volume, 2019H-2029F (In GW & CAGR)
- Figure 16: Global Corporate Clean Energy PPA Market Absolute Opportunity, By Off-Site PPA, 2019H-2029F (In GW)
- Figure 17: Global Corporate Clean Energy PPA Market Size, By On-Site PPA, By Volume, 2019H-2029F (In GW & CAGR)
- Figure 18: Global Corporate Clean Energy PPA Market Absolute Opportunity, By On-Site PPA, 2019H-2029F (In GW)
- Figure 19: Global Corporate Clean Energy PPA Market Size, By Solar PV, By Volume, 2019H-2029F (In GW & CAGR)
- Figure 20: Global Corporate Clean Energy PPA Market Absolute Opportunity, By Solar PV, 2019H-2029F (In GW)
- Figure 21: Global Corporate Clean Energy PPA Market Size, By Wind, By Volume, 2019H-2029F (In GW & CAGR)
- Figure 22: Global Corporate Clean Energy PPA Market Absolute Opportunity, By Wind, 2019H-2029F (In GW)
- Figure 23: Global Corporate Clean Energy PPA Market Size, By Others, By Volume, 2019H-2029F (In GW & CAGR)
- Figure 24: Global Corporate Clean Energy PPA Market Absolute Opportunity, By Others, 2019H-2029F (In GW)
- Figure 25: North America Corporate Clean Energy PPA Market Size, By Volume, 2019H-2029F (In GW)
- Figure 26: North America Corporate Clean Energy PPA Market Share, By PPA Type, 2022 (%)
- Figure 27: North America Corporate Clean Energy PPA Market, By Off-Site PPA, By Volume, 2019H-2029F (In GW & CAGR)
- Figure 28: North America Corporate Clean Energy PPA Market, By On-Site PPA, By Volume, 2019H-2029F (In GW & CAGR)
- Figure 29: North America Corporate Clean Energy PPA Market, By Solar PV, By Volume, 2019H-2029F (In GW & CAGR)
- Figure 30: North America Corporate Clean Energy PPA Market, By Wind, By Volume, 2019H-2029F (In GW & CAGR)
- Figure 31: North America Corporate Clean Energy PPA Market, By Others, By Volume, 2019H-2029F (In GW & CAGR)
- Figure 32: United States Corporate Clean Energy PPA Market, By Volume, 2019H-2029F (In GW & CAGR)
- Figure 33: United States Corporate Clean Energy PPA Market Value, By PPA Type, 2022 (In GW)
- Figure 34: United States Corporate Clean Energy PPA Market Share, By PPA Type, By Volume, 2022 (%)
- Figure 35: United States Corporate Clean Energy PPA Market Share, By Technology Type, By Volume, 2022 (%)
- Figure 36: Canada Corporate Clean Energy PPA Market, By Volume, 2019H-2029F (In GW & CAGR)
- Figure 37: Canada Corporate Clean Energy PPA Market Value, By PPA Type, 2022 (In GW)
- Figure 38: Canada Corporate Clean Energy PPA Market Share, By PPA Type, By Volume, 2022 (%)
- Figure 39: Canada Corporate Clean Energy PPA Market Share, By Technology Type, By Volume, 2022 (%)
- Figure 40: Europe Corporate Clean Energy PPA Market Size, By Volume, 2019H-2029F (In GW)
- Figure 41: Europe Corporate Clean Energy PPA Market Share, By PPA Type, 2022 (%)
- Figure 42: Europe Corporate Clean Energy PPA Market, By Off-Site PPA, By Volume, 2019H-2029F (In GW & CAGR)
- Figure 43: Europe Corporate Clean Energy PPA Market, By On-Site PPA, By Volume, 2019H-2029F (In GW & CAGR)
- Figure 44: Europe Corporate Clean Energy PPA Market, By Solar PV, By Volume, 2019H-2029F (In GW & CAGR)
- Figure 45: Europe Corporate Clean Energy PPA Market, By Wind, By Volume, 2019H-2029F (In GW & CAGR)
- Figure 46: Europe Corporate Clean Energy PPA Market, By Others, By Volume, 2019H-2029F (In GW & CAGR)
- Figure 47: United Kingdom Corporate Clean Energy PPA Market, By Volume, 2019H-2029F (In GW & CAGR)
- Figure 48: United Kingdom Corporate Clean Energy PPA Market Value, By PPA Type, 2022 (In GW)
- Figure 49: United Kingdom Corporate Clean Energy PPA Market Share, By PPA Type, By Volume, 2022 (%)
- Figure 50: United Kingdom Corporate Clean Energy PPA Market Share, By Technology Type, By Volume, 2022 (%)
- Figure 51: France Corporate Clean Energy PPA Market, By Volume, 2019H-2029F (In GW & CAGR)
- Figure 52: France Corporate Clean Energy PPA Market Value, By PPA Type, 2022 (In GW)
- Figure 53: France Corporate Clean Energy PPA Market Share, By PPA Type, By Volume, 2022 (%)
- Figure 54: France Corporate Clean Energy PPA Market Share, By Technology Type, By Volume, 2022 (%)
- Figure 55: Germany Corporate Clean Energy PPA Market, By Volume, 2019H-2029F (In GW & CAGR)
- Figure 56: Germany Corporate Clean Energy PPA Market Value, By PPA Type, 2022 (In GW)
- Figure 57: Germany Corporate Clean Energy PPA Market Share, By PPA Type, By Volume, 2022 (%)
- Figure 58: Germany Corporate Clean Energy PPA Market Share, By Technology Type, By Volume, 2022 (%)
- Figure 59: Italy Corporate Clean Energy PPA Market, By Volume, 2019H-2029F (In GW & CAGR)
- Figure 60: Italy Corporate Clean Energy PPA Market Value, By PPA Type, 2022 (In GW)
- Figure 61: Italy Corporate Clean Energy PPA Market Share, By PPA Type, By Volume, 2022 (%)
- Figure 62: Italy Corporate Clean Energy PPA Market Share, By Technology Type, By Volume, 2022 (%)
- Figure 63: Rest of Europe Corporate Clean Energy PPA Market, By Volume, 2019H-2029F (In GW & CAGR)
- Figure 64: Rest of Europe Corporate Clean Energy PPA Market Value, By PPA Type, 2022 (In GW)
- Figure 65: Rest of Europe Corporate Clean Energy PPA Market Share, By PPA Type, By Volume, 2022 (%)
- Figure 66: Rest of Europe Corporate Clean Energy PPA Market Share, By Technology Type, By Volume, 2022 (%)
- Figure 67: Asia Pacific Corporate Clean Energy PPA Market Size, By Volume, 2019H-2029F (In GW)
- Figure 68: Asia Pacific Corporate Clean Energy PPA Market Share, By PPA Type, 2022 (%)
- Figure 69: Asia Pacific Corporate Clean Energy PPA Market, By Off-Site PPA, By Volume, 2019H-2029F (In GW & CAGR)
- Figure 70: Asia Pacific Corporate Clean Energy PPA Market, By On-Site PPA, By Volume, 2019H-2029F (In GW & CAGR)
- Figure 71: Asia Pacific Corporate Clean Energy PPA Market, By Solar PV, By Volume, 2019H-2029F (In GW & CAGR)
- Figure 72: Asia Pacific Corporate Clean Energy PPA Market, By Wind, By Volume, 2019H-2029F (In GW & CAGR)
- Figure 73: Asia Pacific Corporate Clean Energy PPA Market, By Others, By Volume, 2019H-2029F (In GW & CAGR)
- Figure 74: China Corporate Clean Energy PPA Market, By Volume, 2019H-2029F (In GW & CAGR)
- Figure 75: China Corporate Clean Energy PPA Market Value, By PPA Type, 2022 (In GW)
- Figure 76: China Corporate Clean Energy PPA Market Share, By PPA Type, By Volume, 2022 (%)
- Figure 77: China Corporate Clean Energy PPA Market Share, By Technology Type, By Volume, 2022 (%)
- Figure 78: Japan Corporate Clean Energy PPA Market, By Volume, 2019H-2029F (In GW & CAGR)
- Figure 79: Japan Corporate Clean Energy PPA Market Value, By PPA Type, 2022 (In GW)
- Figure 80: Japan Corporate Clean Energy PPA Market Share, By PPA Type, By Volume, 2022 (%)
- Figure 81: Japan Corporate Clean Energy PPA Market Share, By Technology Type, By Volume, 2022 (%)
- Figure 82: India Corporate Clean Energy PPA Market, By Volume, 2019H-2029F (In GW & CAGR)
- Figure 83: India Corporate Clean Energy PPA Market Value, By PPA Type, 2022 (In GW)
- Figure 84: State installation of corporate renewable PPAs
- Figure 85: Solar corporate PPAs by leading developers
- Figure 86: Companies procuring renewable power through corporate renewable PPAs in India (April 2019 - August 2020)
- Figure 87: India Corporate Clean Energy PPA Market Share, By PPA Type, By Volume, 2022 (%)
- Figure 88: India Corporate Clean Energy PPA Market Share, By Technology Type, By Volume, 2022 (%)
- Figure 89: South Korea Corporate Clean Energy PPA Market, By Volume, 2019H-2029F (In GW & CAGR)
- Figure 90: South Korea Corporate Clean Energy PPA Market Value, By PPA Type, 2022 (In GW)
- Figure 91: South Korea Corporate Clean Energy PPA Market Share, By PPA Type, By Volume, 2022 (%)
- Figure 92: South Korea Corporate Clean Energy PPA Market Share, By Technology Type, By Volume, 2022 (%)
- Figure 93: Rest of Asia Pacific Corporate Clean Energy PPA Market, By Volume, 2019H-2029F (In GW & CAGR)
- Figure 94: Rest of Asia Pacific Corporate Clean Energy PPA Market Value, By PPA Type, 2022 (In GW)
- Figure 95: Rest of Asia Pacific Corporate Clean Energy PPA Market Share, By PPA Type, By Volume, 2022 (%)
- Figure 96: Rest of Asia Pacific Corporate Clean Energy PPA Market Share, By Technology Type, By Volume, 2022 (%)
- Figure 97: Rest of the World Corporate Clean Energy PPA Market Size, By Volume, 2019H-2029F (In GW)
- Figure 98: Rest of the World Corporate Clean Energy PPA Market Share, By PPA Type, 2022 (%)
- Figure 99: Rest of the World Corporate Clean Energy PPA Market, By Off-Site PPA, By Volume, 2019H-2029F (In GW & CAGR)
- Figure 100: Rest of the World Corporate Clean Energy PPA Market, By On-Site PPA, By Volume, 2019H-2029F (In GW & CAGR)
- Figure 101: Rest of the World Corporate Clean Energy PPA Market, By Solar PV, By Volume, 2019H-2029F (In GW & CAGR)
- Figure 102: Rest of the World Corporate Clean Energy PPA Market, By Wind, By Volume, 2019H-2029F (In GW & CAGR)
- Figure 103: Rest of the World Corporate Clean Energy PPA Market, By Others, By Volume, 2019H-2029F (In GW & CAGR)
List of Tables
Table A1: Global Impact of Macro Economic Factors, By Region
Table A2: United States Corporate Clean Energy PPA Market, By PPA Type, By Volume, 2019-2022 (In GW)
Table A3: United States Corporate Clean Energy PPA Market, By PPA Type, By Volume, 2023-2029 (In GW)
Table A4: United States Corporate Clean Energy PPA Market, By Technology Type, By Volume, 2019-2022 (In GW)
Table A5: United States Corporate Clean Energy PPA Market, By Technology Type, By Volume, 2023-2029 (In GW)
Table A6: Canada Corporate Clean Energy PPA Market, By PPA Type, By Volume, 2019-2022 (In GW)
Table A7: Canada Corporate Clean Energy PPA Market, By PPA Type, By Volume, 2023-2029 (In GW)
Table A8: Canada Corporate Clean Energy PPA Market, By Technology Type, By Volume, 2019-2022 (In GW)
Table A9: Canada Corporate Clean Energy PPA Market, By Technology Type, By Volume, 2023-2029 (In GW)
Table A10: United Kingdom Corporate Clean Energy PPA Market, By PPA Type, By Volume, 2019-2022 (In GW)
Table A11: United Kingdom Corporate Clean Energy PPA Market, By PPA Type, By Volume, 2023-2029 (In GW)
Table A12: United Kingdom Corporate Clean Energy PPA Market, By Technology Type, By Volume, 2019-2022 (In GW)
Table A13: United Kingdom Corporate Clean Energy PPA Market, By Technology Type, By Volume, 2023-2029 (In GW)
Table A14: France Corporate Clean Energy PPA Market, By PPA Type, By Volume, 2019-2022 (In GW)
Table A15: France Corporate Clean Energy PPA Market, By PPA Type, By Volume, 2023-2029 (In GW)
Table A16: France Corporate Clean Energy PPA Market, By Technology Type, By Volume, 2019-2022 (In GW)
Table A17: France Corporate Clean Energy PPA Market, By Technology Type, By Volume, 2023-2029 (In GW)
Table A18: Germany Corporate Clean Energy PPA Market, By PPA Type, By Volume, 2019-2022 (In GW)
Table A19: Germany Corporate Clean Energy PPA Market, By PPA Type, By Volume, 2023-2029 (In GW)
Table A20: Germany Corporate Clean Energy PPA Market, By Technology Type, By Volume, 2019-2022 (In GW)
Table A21: Germany Corporate Clean Energy PPA Market, By Technology Type, By Volume, 2023-2029 (In GW)
Table A22: Italy Corporate Clean Energy PPA Market, By PPA Type, By Volume, 2019-2022 (In GW)
Table A23: Italy Corporate Clean Energy PPA Market, By PPA Type, By Volume, 2023-2029 (In GW)
Table A24: Italy Corporate Clean Energy PPA Market, By Technology Type, By Volume, 2019-2022 (In GW)
Table A25: Italy Corporate Clean Energy PPA Market, By Technology Type, By Volume, 2023-2029 (In GW)
Table A26: Rest of Europe Corporate Clean Energy PPA Market, By PPA Type, By Volume, 2019-2022 (In GW)
Table A27: Rest of Europe Corporate Clean Energy PPA Market, By PPA Type, By Volume, 2023-2029 (In GW)
Table A28: Rest of Europe Corporate Clean Energy PPA Market, By Technology Type, By Volume, 2019-2022 (In GW)
Table A29: Rest of Europe Corporate Clean Energy PPA Market, By Technology Type, By Volume, 2023-2029 (In GW)
Table A30: China Corporate Clean Energy PPA Market, By PPA Type, By Volume, 2019-2022 (In GW)
Table A31: China Corporate Clean Energy PPA Market, By PPA Type, By Volume, 2023-2029 (In GW)
Table A32: China Corporate Clean Energy PPA Market, By Technology Type, By Volume, 2019-2022 (In GW)
Table A33: China Corporate Clean Energy PPA Market, By Technology Type, By Volume, 2023-2029 (In GW)
Table A34: Japan Corporate Clean Energy PPA Market, By PPA Type, By Volume, 2019-2022 (In GW)
Table A35: Japan Corporate Clean Energy PPA Market, By PPA Type, By Volume, 2023-2029 (In GW)
Table A36: Japan Corporate Clean Energy PPA Market, By Technology Type, By Volume, 2019-2022 (In GW)
Table A37: Japan Corporate Clean Energy PPA Market, By Technology Type, By Volume, 2023-2029 (In GW)
Table A38: India Corporate Clean Energy PPA Market, By PPA Type, By Volume, 2019-2022 (In GW)
Table A39: India Corporate Clean Energy PPA Market, By PPA Type, By Volume, 2023-2029 (In GW)
Table A40: India Corporate Clean Energy PPA Market, By Technology Type, By Volume, 2019-2022 (In GW)
Table A41: India Corporate Clean Energy PPA Market, By Technology Type, By Volume, 2023-2029 (In GW)
Table A42: South Korea Corporate Clean Energy PPA Market, By PPA Type, By Volume, 2019-2022 (In GW)
Table A43: South Korea Corporate Clean Energy PPA Market, By PPA Type, By Volume, 2023-2029 (In GW)
Table A44: South Korea Corporate Clean Energy PPA Market, By Technology Type, By Volume, 2019-2022 (In GW)
Table A45: South Korea Corporate Clean Energy PPA Market, By Technology Type, By Volume, 2023-2029 (In GW)
Table A46: Rest of Asia Pacific Corporate Clean Energy PPA Market, By PPA Type, By Volume, 2019-2022 (In GW)
Table A47: Rest of Asia Pacific Corporate Clean Energy PPA Market, By PPA Type, By Volume, 2023-2029 (In GW)
Table A48: Rest of Asia Pacific Corporate Clean Energy PPA Market, By Technology Type, By Volume, 2019-2022 (In GW)
Table A49: Rest of Asia Pacific Corporate Clean Energy PPA Market, By Technology Type, By Volume, 2023-2029 (In GW)
Executive Summary
Azoth Analytics has released a research report titled "Global Corporate Clean Energy PPA Market (2024 Edition)" which provides a complete analysis of the Global Corporate Clean Energy Power Purchase Agreement (PPA) industry in terms of market volume segmentation by PPA Type (Off-Site PPA, On-Site PPA) and Technology Type (Solar PV, Wind, and Others), By Region and By Country for the historical period of 2019-2022, the estimates of 2023 and the forecast period of 2024-2029.
The research report covers a detailed analysis of the global market volume by regions (North America, Europe, Asia Pacific, and Rest of the World) and 10 countries (United States, Canada, United Kingdom, Germany, France, Italy, China, India, Japan, South Korea). Additionally, the research report presents data including market volume, yearly growth and potential analysis, investment opportunities and demand forecast. The research report also assesses growth indicators, restraints, supply and demand risk, and other important statistics, as well as a full assessment of current and future market volume trends that are relevant to the market volume evolution.
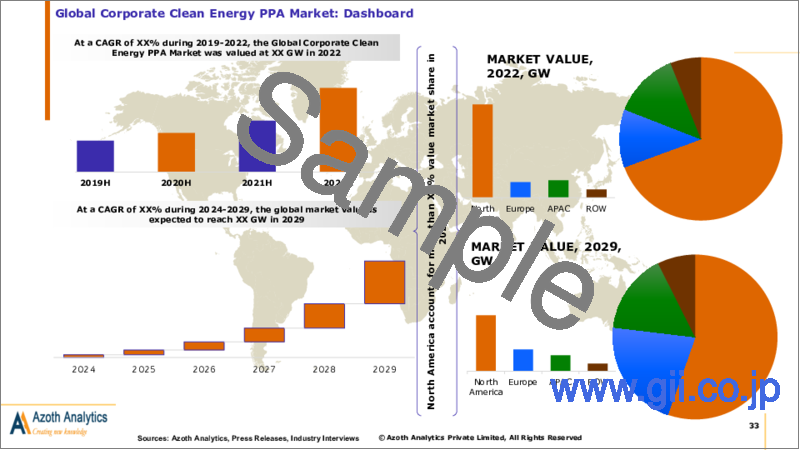
The Global Corporate Clean Energy PPA Market volume is expected to generate 2283.52 GW by the end of 2029, up from 54.01 GW in 2022. 2022 was a transformative year for Corporate PPAs, with 36.7 GW of clean power deals being contracted through Corporate Power Purchase Agreements (PPAs). With the highest number of deals emerging from the United States, Spain, India, Bangladesh and mainland China, these jurisdictions paved the way in embracing the corporate commitment to clean energy.
The year 2022 witnessed an impressive surge in Corporate PPA deals, with more than 160 corporations, across 36 countries announcing Corporate PPA deals in 2022 - a growth of nearly 18% from 2021. Globally, 148GW of clean power deals have emerged through Corporate PPAs since 2008. This appetite for Corporate PPAs, evidenced by the past year, has continued to grow throughout 2022 and into 2023. As corporations look to take advantage of a range of sustainability, economic and reputational benefits, the rise of Corporate PPAs shows no sign of slowing down.
Scope of the Report
- The report analyses the Corporate Clean Energy PPA Market by Volume (GW).
- The report presents the analysis of the Corporate Clean Energy PPA Market volume for the historical period of 2019-2022, the estimated year 2023 and the forecast period of 2024-2029.
- The report analyses the corporate clean energy PPA market at the global level, regional level (North America, Europe, Asia Pacific, Rest of the World) and country level (United States, Canada, United Kingdom, Germany, France, Italy, China, India, Japan, South Korea).
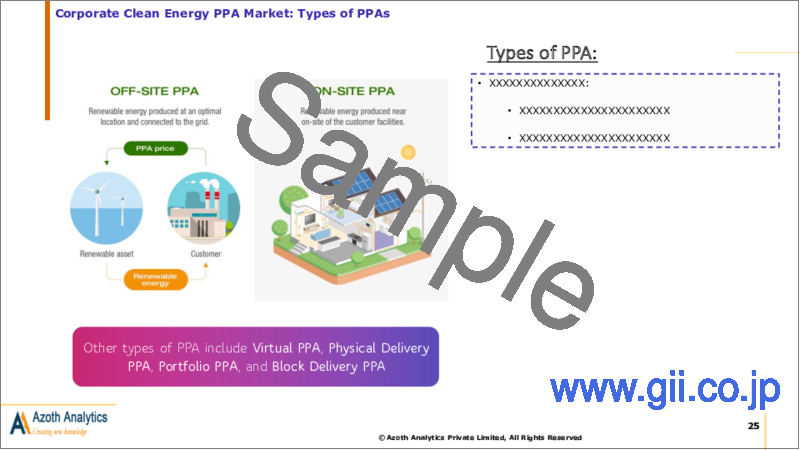
- The report analyses the Corporate Clean Energy PPA Market volume by PPA Type (Off-Site, On-Site).
- The report analyses the Corporate Clean Energy PPA Market volume by Technology Type (Solar PV, Wind and Others).
- The key insights of the report have been presented through the frameworks of SWOT Analysis. Also, the attractiveness of the market volume has been presented by region, by country, by PPA Type, and by Technology type.
- Also, the major opportunities, trends, drivers and challenges of the industry have been analysed in the report.
Table of Contents
1. Market Background
- 1.1 Scope and Product Outlook
- 1.2 Executive Summary
- 1.3 Research Methodology
2. Strategic Recommendations
3. Global Corporate Clean Energy PPA Market: Historic and Forecast (2019-2029)
- 3.1 Impact Analysis of Macro Economic Factors on Corporate Clean Energy PPA Market
- 3.2 GDP Per Capita, By Country (2022)
- 3.3 Global Share of Electricity Production, By Region (1985-2022)
- 3.4 Global Electricity Production, By Source (2021)
- 3.5 Per Capita Electricity Generation, By Country (2022)
- 3.6 Per capita electricity from fossil fuels, nuclear and renewables (2022)
- 3.7 Global Carbon intensity of electricity (2022)
- 3.8 Global Share of electricity production from renewables (2022)
- 3.9 Global Share of Electricity Production from Solar (2022)
- 3.10 Global Corporate Clean Energy PPA Market: Dashboard
- 3.11 Global Corporate Clean Energy PPA Market: Market Size and CAGR, 2019-2029 (In GW & CAGR)
- 3.12 Degree of Impact of COVID-19 on Corporate Clean Energy PPA Market
- 3.13 Global Corporate Clean Energy PPA Market Segmentation: By PPA Type
- 3.13.1 Global Corporate Clean Energy PPA Market, By PPA Type Overview
- 3.13.2 Global Corporate Clean Energy PPA Market Size, By Off-Site PPA, By Volume, 2019H-2029F (In GW & CAGR)
- 3.13.3 Global Corporate Clean Energy PPA Market Size, By On-Site PPA, By Volume, 2019H-2029F (In GW & CAGR)
- 3.14 Global Corporate Clean Energy PPA Market Segmentation: By Technology Type
- 3.14.1 Global Corporate Clean Energy PPA Market, By Technology Type Overview
- 3.14.2 Global Corporate Clean Energy PPA Market Size, By Solar PV, By Volume, 2019H-2029F (In GW & CAGR)
- 3.14.3 Global Corporate Clean Energy PPA Market Size, By Wind, By Volume, 2019H-2029F (In GW & CAGR)
- 3.14.4 Global Corporate Clean Energy PPA Market Size, By Others, By Volume, 2019H-2029F (In GW & CAGR)
4. Global Corporate Clean Energy PPA Market, Region Analysis
- 4.1 Regional Coverage of the Study
- 4.2 Regional Snapshot
5. North America Corporate Clean Energy PPA Market: Historic and Forecast (2019-2029)
- 5.1 North America Corporate Clean Energy PPA Market: Snapshot
- 5.2 North America Corporate Clean Energy PPA Market: Market Size and CAGR, 2019-2029 (In GW & CAGR)
- 5.3 North America Corporate Clean Energy PPA Market: Key Factors
- 5.4 North America Corporate Clean Energy PPA Market Segmentation: By PPA Type
- 5.4.1 North America Corporate Clean Energy PPA Market, By PPA Type Overview
- 5.4.2 North America Corporate Clean Energy PPA Market Size, By Off-Site PPA, By Volume, 2019H-2029F (In GW & CAGR)
- 5.4.3 North America Corporate Clean Energy PPA Market Size, By On-Site PPA, By Volume, 2019H-2029F (In GW & CAGR)
- 5.5 North America Corporate Clean Energy PPA Market Segmentation: By Technology Type
- 5.5.1 North America Corporate Clean Energy PPA Market, By Technology Type Overview
- 5.5.2 North America Corporate Clean Energy PPA Market Size, By Solar PV, By Volume, 2019H-2029F (In GW & CAGR)
- 5.5.3 North America Corporate Clean Energy PPA Market Size, By Wind, By Volume, 2019H-2029F (In GW & CAGR)
- 5.5.4 North America Corporate Clean Energy PPA Market Size, By Others, By Volume, 2019H-2029F (In GW & CAGR)
- 5.6 North America Corporate Clean Energy PPA Market Segmentation: By Country
- 5.6.1 United States Corporate Clean Energy PPA Market: Market Size and CAGR, 2019-2029 (In GW & CAGR)
- 5.6.1.1 United States Corporate Clean Energy PPA Market, By PPA Type
- 5.6.1.2 United States Corporate Clean Energy PPA Market, By Technology Type
- 5.6.2 Canada Corporate Clean Energy PPA Market: Market Size and CAGR, 2019-2029 (In GW & CAGR)
- 5.6.2.1 Canada Corporate Clean Energy PPA Market, By PPA Type
- 5.6.2.2 Canada Corporate Clean Energy PPA Market, By Technology Type
- 5.6.1 United States Corporate Clean Energy PPA Market: Market Size and CAGR, 2019-2029 (In GW & CAGR)
6. Europe Corporate Clean Energy PPA Market: Historic and Forecast (2019-2029)
- 6.1 Europe Corporate Clean Energy PPA Market: Snapshot
- 6.2 Europe Corporate Clean Energy PPA Market: Market Size and CAGR, 2019-2029 (In GW & CAGR)
- 6.3 Europe Corporate Clean Energy PPA Market: Key Factors
- 6.4 Europe Corporate Clean Energy PPA Market Segmentation: By PPA Type
- 6.4.1 Europe Corporate Clean Energy PPA Market, By PPA Type Overview
- 6.4.2 Europe Corporate Clean Energy PPA Market Size, By Off-Site PPA, By Volume, 2019H-2029F (In GW & CAGR)
- 6.4.3 Europe Corporate Clean Energy PPA Market Size, By On-Site PPA, By Volume, 2019H-2029F (In GW & CAGR)
- 6.5 Europe Corporate Clean Energy PPA Market Segmentation: By Technology Type
- 6.5.1 Europe Corporate Clean Energy PPA Market, By Technology Type Overview
- 6.5.2 Europe Corporate Clean Energy PPA Market Size, By Solar PV, By Volume, 2019H-2029F (In GW & CAGR)
- 6.5.3 Europe Corporate Clean Energy PPA Market Size, By Wind, By Volume, 2019H-2029F (In GW & CAGR)
- 6.5.4 Europe Corporate Clean Energy PPA Market Size, By Others, By Volume, 2019H-2029F (In GW & CAGR)
- 6.6 Europe Corporate Clean Energy PPA Market: Market Size and CAGR, 2019-2029 (In GW & CAGR)
- 6.6.1 United Kingdom Corporate Clean Energy PPA Market: Market Size and CAGR, 2019-2029 (In GW & CAGR)
- 6.6.1.1 United Kingdom Corporate Clean Energy PPA Market, By PPA Type
- 6.6.1.2 United Kingdom Corporate Clean Energy PPA Market, By Technology Type
- 6.6.2 France Corporate Clean Energy PPA Market: Market Size and CAGR, 2019-2029 (In GW & CAGR)
- 6.6.2.1 France Corporate Clean Energy PPA Market, By PPA Type
- 6.6.2.2 France Corporate Clean Energy PPA Market, By Technology Type
- 6.6.3 Germany Corporate Clean Energy PPA Market: Market Size and CAGR, 2019-2029 (In GW & CAGR)
- 6.6.3.1 Germany Corporate Clean Energy PPA Market, By PPA Type
- 6.6.3.2 Germany Corporate Clean Energy PPA Market, By Technology Type
- 6.6.4 Italy Corporate Clean Energy PPA Market: Market Size and CAGR, 2019-2029 (In GW & CAGR)
- 6.6.4.1 Italy Corporate Clean Energy PPA Market, By PPA Type
- 6.6.4.2 Italy Corporate Clean Energy PPA Market, By Technology Type
- 6.6.5 Rest of Europe Corporate Clean Energy PPA Market: Market Size and CAGR, 2019-2029 (In GW & CAGR)
- 6.6.5.1 Rest of Europe Corporate Clean Energy PPA Market, By PPA Type
- 6.6.5.2 Rest of Europe Corporate Clean Energy PPA Market, By Technology Type
- 6.6.1 United Kingdom Corporate Clean Energy PPA Market: Market Size and CAGR, 2019-2029 (In GW & CAGR)
7. Asia Pacific Corporate Clean Energy PPA Market: Historic and Forecast (2019-2029)
- 7.1 Asia Pacific Corporate Clean Energy PPA Market: Snapshot
- 7.2 Asia Pacific Corporate Clean Energy PPA Market: Market Size and CAGR, 2019-2029 (In GW & CAGR)
- 7.3 Asia Pacific Corporate Clean Energy PPA Market: Key Factors
- 7.4 Asia Pacific Corporate Clean Energy PPA Market Segmentation: By PPA Type
- 7.4.1 Asia Pacific Corporate Clean Energy PPA Market, By PPA Type Overview
- 7.4.2 Asia Pacific Corporate Clean Energy PPA Market Size, By Off-Site PPA, By Volume, 2019H-2029F (In GW & CAGR)
- 7.4.3 Asia Pacific Corporate Clean Energy PPA Market Size, By On-Site PPA, By Volume, 2019H-2029F (In GW & CAGR)
- 7.5 Asia Pacific Corporate Clean Energy PPA Market Segmentation: By Technology Type
- 7.5.1 Asia Pacific Corporate Clean Energy PPA Market, By Technology Type Overview
- 7.5.2 Asia Pacific Corporate Clean Energy PPA Market Size, By Solar PV, By Volume, 2019H-2029F (In GW & CAGR)
- 7.5.3 Asia Pacific Corporate Clean Energy PPA Market Size, By Wind, By Volume, 2019H-2029F (In GW & CAGR)
- 7.5.4 Asia Pacific Corporate Clean Energy PPA Market Size, By Others, By Volume, 2019H-2029F (In GW & CAGR)
- 7.6 Asia Pacific Corporate Clean Energy PPA Market: Market Size and CAGR, 2019-2029 (In GW & CAGR)
- 7.6.1 China Corporate Clean Energy PPA Market: Market Size and CAGR, 2019-2029 (In GW & CAGR)
- 7.6.1.1 China Corporate Clean Energy PPA Market, By PPA Type
- 7.6.1.2 China Corporate Clean Energy PPA Market, By Technology Type
- 7.6.2 Japan Corporate Clean Energy PPA Market: Market Size and CAGR, 2019-2029 (In GW & CAGR)
- 7.6.2.1 Japan Corporate Clean Energy PPA Market, By PPA Type
- 7.6.2.2 Japan Corporate Clean Energy PPA Market, By Technology Type
- 7.6.3 India Corporate Clean Energy PPA Market: Market Size and CAGR, 2019-2029 (In GW & CAGR)
- 7.6.3.1 India Corporate Clean Energy PPA Market, By PPA Type
- 7.6.3.2 India Corporate Clean Energy PPA Market, By Technology Type
- 7.6.4 South Korea Corporate Clean Energy PPA Market: Market Size and CAGR, 2019-2029 (In GW & CAGR)
- 7.6.4.1 South Korea Corporate Clean Energy PPA Market, By PPA Type
- 7.6.4.2 South Korea Corporate Clean Energy PPA Market, By Technology Type
- 7.6.5 Rest of Asia Pacific Corporate Clean Energy PPA Market: Market Size and CAGR, 2019-2029 (In GW & CAGR)
- 7.6.5.1 Rest of Asia Pacific Corporate Clean Energy PPA Market, By PPA Type
- 7.6.5.2 Rest of Asia Pacific Corporate Clean Energy PPA Market, By Technology Type
- 7.6.1 China Corporate Clean Energy PPA Market: Market Size and CAGR, 2019-2029 (In GW & CAGR)
8. Rest of the World Corporate Clean Energy PPA Market: Historic and Forecast (2019-2029)
- 8.1 Rest of the World Corporate Clean Energy PPA Market: Snapshot
- 8.2 Rest of the World Corporate Clean Energy PPA Market: Market Size and CAGR, 2019-2029 (In GW & CAGR)
- 8.3 Rest of the World Corporate Clean Energy PPA Market Segmentation: By PPA Type
- 8.3.1 Rest of the World Corporate Clean Energy PPA Market, By PPA Type Overview
- 8.3.2 Rest of the World Corporate Clean Energy PPA Market Size, By Off-Site PPA, By Volume, 2019H-2029F (In GW & CAGR)
- 8.3.3 Rest of the World Corporate Clean Energy PPA Market Size, By On-Site PPA, By Volume, 2019H-2029F (In GW & CAGR)
- 8.4 Rest of the World Corporate Clean Energy PPA Market Segmentation: By Technology Type
- 8.4.1 Rest of the World Corporate Clean Energy PPA Market, By Technology Type Overview
- 8.4.2 Rest of the World Hostel OTA Market Size, By Solar PV, By Volume, 2019H-2029F (In GW & CAGR)
- 8.4.3 Rest of the World Hostel OTA Market Size, By Wind, By Volume, 2019H-2029F (In GW & CAGR)
- 8.4.4 Rest of the World Hostel OTA Market Size, By Others, By Volume, 2019H-2029F (In GW & CAGR)
9. Market Dynamics
- 9.1 Impact Assessment of Market Dynamics on Global Corporate Clean Energy PPA Market
- 9.2 Drivers
- 9.3 Restraints
- 9.4 Trends
10. Industry Ecosystem Analysis
- 10.1 SWOT Analysis
