|
|
市場調査レポート
商品コード
1400501
高所作業車(MEWP)の世界市場:金額、数量、製品タイプ別、推進力別、高さ別、エンドユーザー別、地域別、国別の分析、市場考察、予測Global Mobile Elevated Work Platform Market : Analysis By Value and Volume, Product Type, Propulsion, By Height, By End-user, By Region, By Country: Market Insights and Forecast |
||||||
|
|
|||||||
|
|||||||


| 高所作業車(MEWP)の世界市場:金額、数量、製品タイプ別、推進力別、高さ別、エンドユーザー別、地域別、国別の分析、市場考察、予測 |
|
出版日: 2024年01月01日
発行: Azoth Analytics
ページ情報: 英文 320 Pages
納期: 即納可能
|

- 全表示
- 概要
- 図表
- 目次
世界の高所作業車(MEWP)の市場規模は、2022年の14億8,100万米ドルから2029年に26億2,600万米ドルに達する見込みです。予測期間の2024年~2029年には、CAGR8.6%の成長が予測されています。今後数年間は収益の伸びが鈍化しますが、需要は高水準で推移すると予測されます。
2021年の大幅な増加の後、MEWPレンタル企業は予測期間にさらに投資を増やすことができます。世界の高所作業車(MEWP)市場は、シザーリフト、ブームリフト、その他の高所作業車を含むMEWPの需要により、顕著な売上成長を示しています。MEWPは、製造施設、物流倉庫、商業ビルなど、さまざまな部門のメンテナンス活動に不可欠です。定期的な点検とメンテナンスの必要性が、MEWPの売上を後押ししています。
インフラ開発と建設は、市場の拡大を推進する2つの主因です。世界人口の拡大と都市化は、新しい道路、橋梁、建物、その他の必要不可欠なインフラの需要を押し上げています。MEWPは、高所の作業場への生産的で安全なアクセスを提供し、建設作業員による設置、メンテナンス、点検などの作業をより簡単かつ迅速に完了させるため、こうしたプロジェクトには欠かせないものとなっています。MEWPのニーズは、世界の建設活動の拡大に合わせて増加することが予測され、今日の建設機器に必要なツールとしての地位を強めています。
MEWPのニーズは、新規建設プロジェクトと既存インフラの保守・改修の両方によってもたらされます。高所作業車への継続的な要求は、老朽化した建物や橋梁、その他の構造物の定期的なメンテナンスや点検の必要性から生じています。政府と民間企業が既存のインフラの近代化と維持に投資を続けるかぎり、市場は世界の建設と開発のシナリオの継続的かつ変化するニーズから利益を得ることが予測されます。
しかし、企業には買い切りよりもレンタルや安価な選択肢があるため、経済的な障壁が市場拡大を制限しており、これが高所作業車を必要とする部門におけるMEWPの全体的な消費と普及に影響を与えています。特に競合企業の低価格製品やその他のアクセス手段と比較した場合、MEWPメーカーが潜在的な消費者に自社製品の利益が初期支出を上回ることを納得させることは困難となる可能性があります。
当レポートでは、世界の高所作業車(MEWP)市場について調査し、市場規模と予測、地域とセグメントの分析、主な動向と機会などの情報を提供しています。
目次
第1章 市場の背景
- 範囲と製品の見通し
- エグゼクティブサマリー
- 調査手法
第2章 戦略的推奨事項
第3章 世界の高所作業車(MEWP)市場:実績と予測(2019年~2029年)
- 高所作業車(MEWP)市場に対するマクロ経済要因の影響の分析
- 1人あたりのGDP
- MEWPフリートの規模:地域別
- 米国のMEWPレンタル市場とフリート規模
- 欧州のMEWPレンタル市場
- 欧州のMEWPフリートの規模と収益
- 中国のMEWPレンタル市場
- アジアで成長する日本のレンタル企業
- MEWP製品の主な競合
- 世界の高所作業車(MEWP)市場:ダッシュボード
- 世界の高所作業車(MEWP)市場:市場金額の評価(2019年~2029年)
- 世界の高所作業車(MEWP)市場:市場数量の評価(2019年~2029年)
- 世界の高所作業車(MEWP)市場:近年の動向
- 世界の高所作業車(MEWP)の平均価格分析
- 高所作業車(MEWP)市場に対するCOVID-19の影響
- 世界の高所作業車(MEWP)市場セグメンテーション:製品タイプ別
- 世界の高所作業車(MEWP)市場:製品タイプ別、概要
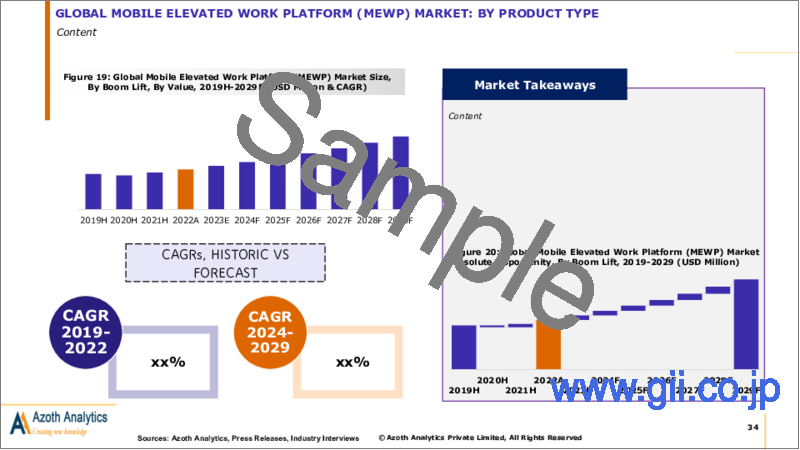
- 世界の高所作業車(MEWP)の市場規模:ブームリフト(金額)(2019年~2029年)
- 世界の高所作業車(MEWP)の市場規模:シザーリフト(金額)(2019年~2029年)
- 世界の高所作業車(MEWP)の市場規模:垂直マストリフト(金額)(2019年~2029年)
- 世界の高所作業車(MEWP)市場セグメンテーション:推進力別
- 世界の高所作業車(MEWP)市場:推進力別、概要
- 世界の高所作業車(MEWP)の市場規模:エンジン駆動(金額)(2019年~2029年)
- 世界の高所作業車(MEWP)の市場規模:電気(金額)(2019年~2029年)
- 世界の高所作業車(MEWP)の市場規模:ハイブリッド(金額)(2019年~2029年)
- 世界の高所作業車(MEWP)市場セグメンテーション:高さ別
- 世界の高所作業車(MEWP)市場:高さ別、概要
- 世界の高所作業車(MEWP)の市場規模:10メートル未満(金額)(2019年~2029年)
- 世界の高所作業車(MEWP)の市場規模:10~20メートル(金額)(2019年~2029年)
- 世界の高所作業車(MEWP)の市場規模:20メートル超(金額)(2019年~2029年)
- 世界の高所作業車(MEWP)市場セグメンテーション:エンドユーザー別
- 世界の高所作業車(MEWP)市場:エンドユーザー別、概要
- 世界の高所作業車(MEWP)の市場規模:レンタル企業(金額)(2019年~2029年)
- 世界の高所作業車(MEWP)の市場規模:建設・鉱業(金額)(2019年~2029年)
- 世界の高所作業車(MEWP)の市場規模:輸送・ロジスティクス(金額)(2019年~2029年)
- 世界の高所作業車(MEWP)の市場規模:製造(金額)(2019年~2029年)
- 世界の高所作業車(MEWP)の市場規模:その他のエンドユーザー(金額)(2019年~2029年)
第4章 世界の高所作業車(MEWP)市場:地域の分析
- 研究の地域範囲
- 地域のスナップショット
第5章 南北アメリカの高所作業車(MEWP)市場:実績と予測(2019年~2029年)
- 南北アメリカの高所作業車(MEWP)市場:スナップショット
- 南北アメリカの高所作業車(MEWP)市場:市場金額の評価(2019年~2029年)
- 南北アメリカの高所作業車(MEWP)市場:市場数量の評価(2019年~2029年)
- 南北アメリカの高所作業車(MEWP)市場:主な要因
- 南北アメリカの高所作業車(MEWP)市場:セグメント分析
- 南北アメリカの高所作業車(MEWP)市場セグメンテーション:製品タイプ別
- 南北アメリカの高所作業車(MEWP)市場セグメンテーション:推進力別
- 南北アメリカの高所作業車(MEWP)市場セグメンテーション:高さ別
- 南北アメリカの高所作業車(MEWP)市場セグメンテーション:エンドユーザー別
- 南北アメリカの高所作業車(MEWP)市場セグメンテーション:国別
- 南北アメリカの高所作業車(MEWP)市場:国別、概要
- 米国の高所作業車(MEWP)市場:市場規模とCAGR(2019年~2029年)
- カナダの高所作業車(MEWP)市場:市場規模とCAGR(2019年~2029年)
- その他の南北アメリカの高所作業車(MEWP)市場:市場規模とCAGR(2019年~2029年)
第6章 欧州の高所作業車(MEWP)市場:実績と予測(2019年~2029年)
- 欧州の高所作業車(MEWP)市場:スナップショット
- 欧州の高所作業車(MEWP)市場:市場金額の評価(2019年~2029年)
- 欧州の高所作業車(MEWP)市場:市場数量の評価(2019年~2029年)
- 欧州の高所作業車(MEWP)市場:主な要因
- 欧州の高所作業車(MEWP)市場:セグメント分析
- 欧州の高所作業車(MEWP)市場セグメンテーション:製品タイプ別
- 欧州の高所作業車(MEWP)市場セグメンテーション:推進力別
- 欧州の高所作業車(MEWP)市場セグメンテーション:高さ別
- 欧州の高所作業車(MEWP)市場セグメンテーション:エンドユーザー別
- 欧州の高所作業車(MEWP)市場セグメンテーション:国別
- 欧州の高所作業車(MEWP)市場:国別、概要
- ドイツの高所作業車(MEWP)市場:市場規模とCAGR(2019年~2029年)
- フランスの高所作業車(MEWP)市場:市場規模とCAGR(2019年~2029年)
- 英国の高所作業車(MEWP)市場:市場規模とCAGR(2019年~2029年)
- イタリアの高所作業車(MEWP)市場:市場規模とCAGR(2019年~2029年)
- その他の欧州の高所作業車(MEWP)市場:市場規模とCAGR(2019年~2029年)
第7章 アジア太平洋の高所作業車(MEWP)市場:実績と予測(2019年~2029年)
- アジア太平洋の高所作業車(MEWP)市場:スナップショット
- アジア太平洋の高所作業車(MEWP)市場:市場金額の評価(2019年~2029年)
- アジア太平洋の高所作業車(MEWP)市場:市場数量の評価(2019年~2029年)
- アジア太平洋の高所作業車(MEWP)市場:主な要因
- アジア太平洋の高所作業車(MEWP)市場:セグメント分析
- アジア太平洋の高所作業車(MEWP)市場セグメンテーション:製品タイプ別
- アジア太平洋の高所作業車(MEWP)市場セグメンテーション:推進力別
- アジア太平洋の高所作業車(MEWP)市場セグメンテーション:高さ別
- アジア太平洋の高所作業車(MEWP)市場セグメンテーション:エンドユーザー別
- アジア太平洋の高所作業車(MEWP)市場セグメンテーション:国別
- アジア太平洋の高所作業車(MEWP)市場:国別、概要
- 中国の高所作業車(MEWP)市場:市場規模とCAGR(2019年~2029年)
- 日本の高所作業車(MEWP)市場:市場規模とCAGR(2019年~2029年)
- 韓国の高所作業車(MEWP)市場:市場規模とCAGR(2019年~2029年)
- インドの高所作業車(MEWP)市場:市場規模とCAGR(2019年~2029年)
- その他のアジア太平洋の高所作業車(MEWP)市場:市場規模とCAGR(2019年~2029年)
第8章 中東・アフリカの高所作業車(MEWP)市場:実績と予測(2019年~2029年)
- 中東・アフリカの高所作業車(MEWP)市場:スナップショット
- 中東・アフリカの高所作業車(MEWP)市場:市場金額の評価(2019年~2029年)
- 中東・アフリカの高所作業車(MEWP)市場:市場数量の評価(2019年~2029年)
- 中東・アフリカの高所作業車(MEWP)市場:主な要因
- 中東・アフリカの高所作業車(MEWP)市場:セグメント分析
- 中東・アフリカの高所作業車(MEWP)市場セグメンテーション:製品タイプ別
- 中東・アフリカの高所作業車(MEWP)市場セグメンテーション:推進力別
- 中東・アフリカの高所作業車(MEWP)市場セグメンテーション:高さ別
- 中東・アフリカの高所作業車(MEWP)市場セグメンテーション:エンドユーザー別
第9章 市場力学
- 世界の高所作業車(MEWP)市場に対する市場力学の影響の評価
- 促進要因
- 抑制要因
- 動向
第10章 産業エコシステム分析
- バリューチェーン分析
- ポーターのファイブフォース分析モデル
第11章 競合ポジショニング
- 企業の製品ポジショニング
- 市場ポジションマトリクス
- 高所作業車(MEWP)市場の市場シェア分析
- 企業プロファイル
- Haulotte Group
- Terex Corporation
- Tadano Ltd.
- TVH
- Linamar Corporation
- JLG Industries, Inc.
- Snorkel International, Inc.
- Mtandt Group
- Zhejiang Dingli Machinery Co, Ltd.
- MEC Aerial Work Platforms
List of Figures
List of Figures
- Figure 1: Global GDP per Capita (in USD), 2019-2022
- Figure 2: Global GDP per Capita (in 000'USD), 2023
- Figure 3: GDP per Capita by Key Country (in 000'USD), 2023
- Figure 4: MEWP Fleet Sizes by Region, 2019
- Figure 5: U.S. MEWP Fleet Size, 2019-2022 (in units)
- Figure 6: U.S. MEWP Rental Market, 2019-2022 (in USD'Bn)
- Figure 7: European MEWP rental market (Euro'Mn)- 2022
- Figure 8: European MEWP Fleet Size and Revenue per Unit- 2021
- Figure 9: China MEWP Fleet Size, 2021-2022 (in units)
- Figure 10: China MEWP Rental Revenue, 2020-2022 (in Yen'Mn)
- Figure 11: Growth in MEWP Rental Rates, 2019-2022 (in %)
- Figure 12: Global Mobile Elevated Work Platform (MEWP) Market Size, By Value, 2019-2022 (USD Million)
- Figure 13: Global Mobile Elevated Work Platform (MEWP) Market Size, By Value, 2023-2029 (USD Million)
- Figure 14: Global Mobile Elevated Work Platform (MEWP) Market CAGR (%), By Value, 2019-2022, 2024-2029
- Figure 15: Global Mobile Elevated Work Platform (MEWP) Market Size, By Volume, 2019-2022 (000' Units)
- Figure 16: Global Mobile Elevated Work Platform (MEWP) Market Size, By Volume, 2023-2029 (000' Units)
- Figure 17: Global Mobile Elevated Work Platform (MEWP) Market CAGR (%), By Volume, 2019-2022, 2024-2029
- Figure 18: Average Mobile Elevated Work Platform (MEWP) Price, By Region, 2022 (USD/Unit)
- Figure 19: Global Mobile Elevated Work Platform (MEWP) Market Size, By Boom Lift, By Value, 2019H-2029F (USD Million & CAGR)
- Figure 20: Global Mobile Elevated Work Platform (MEWP) Market Absolute Opportunity, By Boom Lift, 2019-2029 (USD Million)
- Figure 21: Global Mobile Elevated Work Platform (MEWP) Market Size, By Scissor Lift, By Value, 2019H-2029F (USD Million & CAGR)
- Figure 22: Global Mobile Elevated Work Platform (MEWP) Market Absolute Opportunity, By Scissor Lift, 2019-2029 (USD Million)
- Figure 23: Global Mobile Elevated Work Platform (MEWP) Market Size, By Vertical Mast Lift, By Value, 2019H-2029F (USD Million & CAGR)
- Figure 24: Global Mobile Elevated Work Platform (MEWP) Market Absolute Opportunity, By Vertical Mast Lift, 2019-2029 (USD Million)
- Figure 25: Global Mobile Elevated Work Platform (MEWP) Market Size, By Engine-powered, By Value, 2019H-2029F (USD Million & CAGR)
- Figure 26: Global Mobile Elevated Work Platform (MEWP) Market Absolute Opportunity, By Engine-powered, 2019-2029 (USD Million)
- Figure 27: Global Mobile Elevated Work Platform (MEWP) Market Size, By Electric, By Value, 2019H-2029F (USD Million & CAGR)
- Figure 28: Global Mobile Elevated Work Platform (MEWP) Market Absolute Opportunity, By Electric, 2019-2029 (USD Million)
- Figure 29: Global Mobile Elevated Work Platform (MEWP) Market Size, By Hybrid, By Value, 2019H-2029F (USD Million & CAGR)
- Figure 30: Global Mobile Elevated Work Platform (MEWP) Market Absolute Opportunity, By Hybrid, 2019-2029 (USD Million)
- Figure 31: Global Mobile Elevated Work Platform (MEWP) Market Size, By <10 Meter, By Value, 2019H-2029F (USD Million & CAGR)
- Figure 32: Global Mobile Elevated Work Platform (MEWP) Market Absolute Opportunity, By <10 Meter, 2019-2029 (USD Million)
- Figure 33: Global Mobile Elevated Work Platform (MEWP) Market Size, By 10 to 20 Meter, By Value, 2019H-2029F (USD Million & CAGR)
- Figure 34: Global Mobile Elevated Work Platform (MEWP) Market Absolute Opportunity, By 10 to 20 Meter, 2019-2029 (USD Million)
- Figure 35: Global Mobile Elevated Work Platform (MEWP) Market Size, By >20 Meter, By Value, 2019H-2029F (USD Million & CAGR)
- Figure 36: Global Mobile Elevated Work Platform (MEWP) Market Absolute Opportunity, By >20 Meter, 2019-2029 (USD Million)
- Figure 37: Global Mobile Elevated Work Platform (MEWP) Market Size, By Rental Companies, By Value, 2019H-2029F (USD Million & CAGR)
- Figure 38: Global Mobile Elevated Work Platform (MEWP) Market Absolute Opportunity, By Rental Companies, 2019-2029 (USD Million)
- Figure 39: Global Mobile Elevated Work Platform (MEWP) Market Size, By Construction & Mining, By Value, 2019H-2029F (USD Million & CAGR)
- Figure 40: Global Mobile Elevated Work Platform (MEWP) Market Absolute Opportunity, By Construction & Mining, 2019-2029 (USD Million)
- Figure 41: Global Mobile Elevated Work Platform (MEWP) Market Size, By Transportation and Logistics, By Value, 2019H-2029F (USD Million & CAGR)
- Figure 42: Global Mobile Elevated Work Platform (MEWP) Market Absolute Opportunity, By Transportation and Logistics, 2019-2029 (USD Million)
- Figure 43: Global Mobile Elevated Work Platform (MEWP) Market Size, By Manufacturing, By Value, 2019H-2029F (USD Million & CAGR)
- Figure 44: Global Mobile Elevated Work Platform (MEWP) Market Absolute Opportunity, By Manufacturing, 2019-2029 (USD Million)
- Figure 45: Global Mobile Elevated Work Platform (MEWP) Market Size, Other End-users, By Value, 2019H-2029F (USD Million & CAGR)
- Figure 46: Global Mobile Elevated Work Platform (MEWP) Market Absolute Opportunity, By Other End-users, 2019-2029 (USD Million)
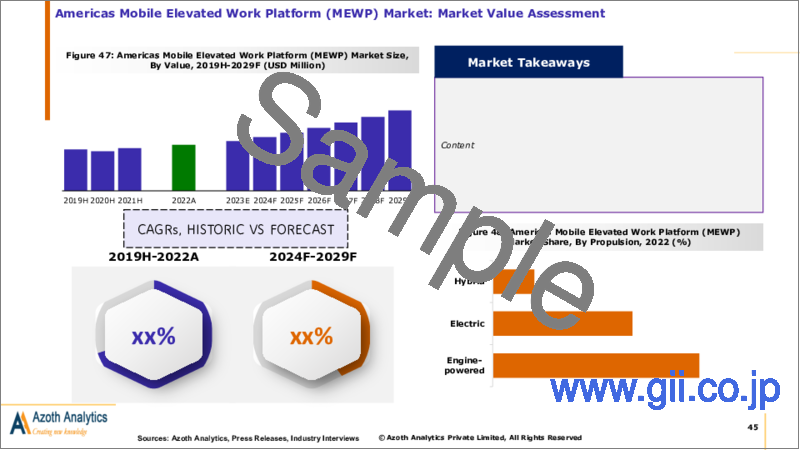
- Figure 47: Americas Mobile Elevated Work Platform (MEWP) Market Size, By Value, 2019H-2029F (USD Million)
- Figure 48: Americas Mobile Elevated Work Platform (MEWP) Market Share, By Propulsion, 2022 (%)
- Figure 49: Americas Mobile Elevated Work Platform (MEWP) Market Size, By Volume, 2019-2022 (000' Units)
- Figure 50: Americas Mobile Elevated Work Platform (MEWP) Market Size, By Volume, 2023-2029 (000' Units)
- Figure 51: Americas Mobile Elevated Work Platform (MEWP) Market, By Boom Lift, By Value, 2019H-2029F (USD Million & CAGR)
- Figure 52: Americas Mobile Elevated Work Platform (MEWP) Market, By Scissor Lift, By Value, 2019H-2029F (USD Million & CAGR)
- Figure 53: Americas Mobile Elevated Work Platform (MEWP) Market, By Vertical Mast Lift, By Value, 2019H-2029F (USD Million & CAGR)
- Figure 54: Americas Mobile Elevated Work Platform (MEWP) Market, By Engine-powered, By Value, 2019H-2029F (USD Million & CAGR)
- Figure 55: Americas Mobile Elevated Work Platform (MEWP) Market, By Electric, By Value, 2019H-2029F (USD Million & CAGR)
- Figure 56: Americas Mobile Elevated Work Platform (MEWP) Market, By Hybrid, By Value, 2019H-2029F (USD Million & CAGR)
- Figure 57: Americas Mobile Elevated Work Platform (MEWP) Market, By <10 Meter, By Value, 2019H-2029F (USD Million & CAGR)
- Figure 58: Americas Mobile Elevated Work Platform (MEWP) Market, By 10 to 20 Meter, By Value, 2019H-2029F (USD Million & CAGR)
- Figure 59: Americas Mobile Elevated Work Platform (MEWP) Market, By >20 Meter, By Value, 2019H-2029F (USD Million & CAGR)
- Figure 60: Americas Mobile Elevated Work Platform (MEWP) Market, By Rental Companies, By Value, 2019H-2029F (USD Million & CAGR)
- Figure 61: Americas Mobile Elevated Work Platform (MEWP) Market, By Construction & Mining, By Value, 2019H-2029F (USD Million & CAGR)
- Figure 62: Americas Mobile Elevated Work Platform (MEWP) Market, By Transportation and Logistics, By Value, 2019H-2029F (USD Million & CAGR)
- Figure 63: Americas Mobile Elevated Work Platform (MEWP) Market, By Manufacturing, By Value, 2019H-2029F (USD Million & CAGR)
- Figure 64: Americas Mobile Elevated Work Platform (MEWP) Market, By Other End-users, By Value, 2019H-2029F (USD Million & CAGR)
- Figure 65: United States Mobile Elevated Work Platform (MEWP) Market, By Value, 2019-2029 (USD Million & CAGR)
- Figure 66: United States Mobile Elevated Work Platform (MEWP) Market Value, By Propulsion, 2022 (USD Million)
- Figure 67: United States Mobile Elevated Work Platform (MEWP) Market Share, By Product Type, By Value, 2022 (%)
- Figure 68: United States Mobile Elevated Work Platform (MEWP) Market Share, By Propulsion, 2022 (%)
- Figure 69: United States Mobile Elevated Work Platform (MEWP) Market Share, By Height, By Value, 2022 (%)
- Figure 70: United States Mobile Elevated Work Platform (MEWP) Market Share, By End-user, 2022 (%)
- Figure 71: Canada Mobile Elevated Work Platform (MEWP) Market, By Value, 2019-2029 (USD Million & CAGR)
- Figure 72: Canada Mobile Elevated Work Platform (MEWP) Market Value, By Propulsion, 2022 (USD Million)
- Figure 73: Canada Mobile Elevated Work Platform (MEWP) Market Share, By Product Type, By Value, 2022 (%)
- Figure 74: Canada Mobile Elevated Work Platform (MEWP) Market Share, By Propulsion, 2022 (%)
- Figure 75: Canada Mobile Elevated Work Platform (MEWP) Market Share, By Height, By Value, 2022 (%)
- Figure 76: Canada Mobile Elevated Work Platform (MEWP) Market Share, By End-user, 2022 (%)
- Figure 77: Rest of Americas Mobile Elevated Work Platform (MEWP) Market, By Value, 2019-2029 (USD Million & CAGR)
- Figure 78: Rest of Americas Mobile Elevated Work Platform (MEWP) Market Value, By Propulsion, 2022 (USD Million)
- Figure 79: Rest of Americas Mobile Elevated Work Platform (MEWP) Market Share, By Product Type, By Value, 2022 (%)
- Figure 80: Rest of Americas Mobile Elevated Work Platform (MEWP) Market Share, By Propulsion, 2022 (%)
- Figure 81: Rest of Americas Mobile Elevated Work Platform (MEWP) Market Share, By Height, 2022 (%)
- Figure 82: Rest of Americas Mobile Elevated Work Platform (MEWP) Market Share, By End-user, 2022 (%)
- Figure 83: Europe Mobile Elevated Work Platform (MEWP) Market Size, By Value, 2019H-2029F (USD Million)
- Figure 84: Europe Mobile Elevated Work Platform (MEWP) Market Share, By Propulsion, 2022 (%)
- Figure 85: Europe Mobile Elevated Work Platform (MEWP) Market Size, By Volume, 2019-2022 (000' Units)
- Figure 86: Europe Mobile Elevated Work Platform (MEWP) Market Size, By Volume, 2023-2029 (000' Units)
- Figure 87: Europe Mobile Elevated Work Platform (MEWP) Market, By Boom Lift, By Value, 2019H-2029F (USD Million & CAGR)
- Figure 88: Europe Mobile Elevated Work Platform (MEWP) Market, By Scissor Lift, By Value, 2019H-2029F (USD Million & CAGR)
- Figure 89: Europe Mobile Elevated Work Platform (MEWP) Market, By Vertical Mast Lift, By Value, 2019H-2029F (USD Million & CAGR)
- Figure 90: Europe Mobile Elevated Work Platform (MEWP) Market, By Engine-powered, By Value, 2019H-2029F (USD Million & CAGR)
- Figure 91: Europe Mobile Elevated Work Platform (MEWP) Market, By Electric, By Value, 2019H-2029F (USD Million & CAGR)
- Figure 92: Europe Mobile Elevated Work Platform (MEWP) Market, By Hybrid, By Value, 2019H-2029F (USD Million & CAGR)
- Figure 93: Europe Mobile Elevated Work Platform (MEWP) Market, By <10 Meter, By Value, 2019H-2029F (USD Million & CAGR)
- Figure 94: Europe Mobile Elevated Work Platform (MEWP) Market, By 10 to 20 Meter, By Value, 2019H-2029F (USD Million & CAGR)
- Figure 95: Europe Mobile Elevated Work Platform (MEWP) Market, By >20 Meter, By Value, 2019H-2029F (USD Million & CAGR)
- Figure 96: Europe Mobile Elevated Work Platform (MEWP) Market, By Rental Companies, By Value, 2019H-2029F (USD Million & CAGR)
- Figure 97: Europe Mobile Elevated Work Platform (MEWP) Market, Construction & Mining, By Value, 2019H-2029F (USD Million & CAGR)
- Figure 98: Europe Mobile Elevated Work Platform (MEWP) Market, By Transportation and Logistics, By Value, 2019H-2029F (USD Million & CAGR)
- Figure 99: Europe Mobile Elevated Work Platform (MEWP) Market, By Manufacturing, By Value, 2019H-2029F (USD Million & CAGR)
- Figure 100: Europe Mobile Elevated Work Platform (MEWP) Market, By Other End-users, By Value, 2019H-2029F (USD Million & CAGR)
- Figure 101: Germany Mobile Elevated Work Platform (MEWP) Market, By Value, 2019-2029 (USD Million & CAGR)
- Figure 102: Germany Mobile Elevated Work Platform (MEWP) Market Value, By Propulsion, 2022 (USD Million)
- Figure 103: Germany Mobile Elevated Work Platform (MEWP) Market Share, By Product Type, By Value, 2022 (%)
- Figure 104: Germany Mobile Elevated Work Platform (MEWP) Market Share, By Propulsion, 2022 (%)
- Figure 105: Germany Mobile Elevated Work Platform (MEWP) Market Share, By Height, By Value, 2022 (%)
- Figure 106: Germany Mobile Elevated Work Platform (MEWP) Market Share, By End-user, 2022 (%)
- Figure 107: France Mobile Elevated Work Platform (MEWP) Market, By Value, 2019-2029 (USD Million & CAGR)
- Figure 108: France Mobile Elevated Work Platform (MEWP) Market Value, By Propulsion, 2022 (USD Million)
- Figure 109: France Mobile Elevated Work Platform (MEWP) Market Share, By Product Type, By Value, 2022 (%)
- Figure 110: France Mobile Elevated Work Platform (MEWP) Market Share, By Propulsion, 2022 (%)
- Figure 111: France Mobile Elevated Work Platform (MEWP) Market Share, By Height, By Value, 2022 (%)
- Figure 112: France Mobile Elevated Work Platform (MEWP) Market Share, By End-user, 2022 (%)
- Figure 113: United Kingdom Mobile Elevated Work Platform (MEWP) Market, By Value, 2019-2029 (USD Million & CAGR)
- Figure 114: United Kingdom Mobile Elevated Work Platform (MEWP) Market Value, By Propulsion, 2022 (USD Million)
- Figure 115: United Kingdom Mobile Elevated Work Platform (MEWP) Market Share, By Product Type, By Value, 2022 (%)
- Figure 116: United Kingdom Mobile Elevated Work Platform (MEWP) Market Share, By Propulsion, 2022 (%)
- Figure 117: United Kingdom Mobile Elevated Work Platform (MEWP) Market Share, By Height, By Value, 2022 (%)
- Figure 118: United Kingdom Mobile Elevated Work Platform (MEWP) Market Share, By End-user, 2022 (%)
- Figure 119: Italy Mobile Elevated Work Platform (MEWP) Market, By Value, 2019-2029 (USD Million & CAGR)
- Figure 120: Italy Mobile Elevated Work Platform (MEWP) Market Value, By Propulsion, 2022 (USD Million)
- Figure 121: Italy Mobile Elevated Work Platform (MEWP) Market Share, By Product Type, By Value, 2022 (%)
- Figure 122: Italy Mobile Elevated Work Platform (MEWP) Market Share, By Propulsion, 2022 (%)
- Figure 123: Italy Mobile Elevated Work Platform (MEWP) Market Share, By Height, By Value, 2022 (%)
- Figure 124: Italy Mobile Elevated Work Platform (MEWP) Market Share, By End-user, 2022 (%)
- Figure 125: Rest of Europe Mobile Elevated Work Platform (MEWP) Market, By Value, 2019-2029 (USD Million & CAGR)
- Figure 126: Rest of Europe Mobile Elevated Work Platform (MEWP) Market Value, By Propulsion, 2022 (USD Million)
- Figure 127: Rest of Europe Mobile Elevated Work Platform (MEWP) Market Share, By Product Type, By Value, 2022 (%)
- Figure 128: Rest of Europe Mobile Elevated Work Platform (MEWP) Market Share, By Propulsion, 2022 (%)
- Figure 129: Rest of Europe Mobile Elevated Work Platform (MEWP) Market Share, By Height, By Value, 2022 (%)
- Figure 130: Rest of Europe Mobile Elevated Work Platform (MEWP) Market Share, By End-user, 2022 (%)
- Figure 131: Asia Pacific Mobile Elevated Work Platform (MEWP) Market Size, By Value, 2019H-2029F (USD Million)
- Figure 132: Asia Pacific Mobile Elevated Work Platform (MEWP) Market Share, By Propulsion, 2022 (%)
- Figure 133: Asia Pacific Mobile Elevated Work Platform (MEWP) Market Size, By Volume, 2019-2022 (000' Units)
- Figure 134: Asia Pacific Mobile Elevated Work Platform (MEWP) Market Size, By Volume, 2023-2029 (000' Units)
- Figure 135: Asia Pacific Mobile Elevated Work Platform (MEWP) Market, By Boom Lift, By Value, 2019H-2029F (USD Million & CAGR)
- Figure 136: Asia Pacific Mobile Elevated Work Platform (MEWP) Market, By Scissor Lift, By Value, 2019H-2029F (USD Million & CAGR)
- Figure 137: Asia Pacific Mobile Elevated Work Platform (MEWP) Market, By Vertical Mast Lift, By Value, 2019H-2029F (USD Million & CAGR)
- Figure 138: Asia Pacific Mobile Elevated Work Platform (MEWP) Market, By Engine-powered, By Value, 2019H-2029F (USD Million & CAGR)
- Figure 139: Asia Pacific Mobile Elevated Work Platform (MEWP) Market, By Electric, By Value, 2019H-2029F (USD Million & CAGR)
- Figure 140: Asia Pacific Mobile Elevated Work Platform (MEWP) Market, By Hybrid, By Value, 2019H-2029F (USD Million & CAGR)
- Figure 141: Asia Pacific Mobile Elevated Work Platform (MEWP) Market, By <10 Meter, By Value, 2019H-2029F (USD Million & CAGR)
- Figure 142: Asia Pacific Mobile Elevated Work Platform (MEWP) Market, By 10 to 20 Meter, By Value, 2019H-2029F (USD Million & CAGR)
- Figure 143: Asia Pacific Mobile Elevated Work Platform (MEWP) Market, By >20 Meter, By Value, 2019H-2029F (USD Million & CAGR)
- Figure 144: Asia Pacific Mobile Elevated Work Platform (MEWP) Market, By Rental Companies, By Value, 2019H-2029F (USD Million & CAGR)
- Figure 145: Asia Pacific Mobile Elevated Work Platform (MEWP) Market, Construction & Mining, By Value, 2019H-2029F (USD Million & CAGR)
- Figure 146: Asia Pacific Mobile Elevated Work Platform (MEWP) Market, By Transportation and Logistics, By Value, 2019H-2029F (USD Million & CAGR)
- Figure 147: Asia Pacific Mobile Elevated Work Platform (MEWP) Market, By Manufacturing, By Value, 2019H-2029F (USD Million & CAGR)
- Figure 148: Asia Pacific Mobile Elevated Work Platform (MEWP) Market, By Other End-users, By Value, 2019H-2029F (USD Million & CAGR)
- Figure 149: China Mobile Elevated Work Platform (MEWP) Market, By Value, 2019-2029 (USD Million & CAGR)
- Figure 150: China Mobile Elevated Work Platform (MEWP) Market Value, By Propulsion, 2022 (USD Million)
- Figure 151: China Mobile Elevated Work Platform (MEWP) Market Share, By Product Type, By Value, 2022 (%)
- Figure 152: China Mobile Elevated Work Platform (MEWP) Market Share, By Propulsion, 2022 (%)
- Figure 153: China Mobile Elevated Work Platform (MEWP) Market Share, By Height, By Value, 2022 (%)
- Figure 154: China Mobile Elevated Work Platform (MEWP) Market Share, By End-user, 2022 (%)
- Figure 155: Japan Mobile Elevated Work Platform (MEWP) Market, By Value, 2019-2029 (USD Million & CAGR)
- Figure 156: Japan Mobile Elevated Work Platform (MEWP) Market Value, By Propulsion, 2022 (USD Million)
- Figure 157: Japan Mobile Elevated Work Platform (MEWP) Market Share, By Product Type, By Value, 2022 (%)
- Figure 158: Japan Mobile Elevated Work Platform (MEWP) Market Share, By Propulsion, 2022 (%)
- Figure 159: Japan Mobile Elevated Work Platform (MEWP) Market Share, By Height, By Value, 2022 (%)
- Figure 160: Japan Mobile Elevated Work Platform (MEWP) Market Share, By End-user, 2022 (%)
- Figure 161: South Korea Mobile Elevated Work Platform (MEWP) Market, By Value, 2019-2029 (USD Million & CAGR)
- Figure 162: South Korea Mobile Elevated Work Platform (MEWP) Market Value, By Propulsion, 2022 (USD Million)
- Figure 163: South Korea Mobile Elevated Work Platform (MEWP) Market Share, By Product Type, By Value, 2022 (%)
- Figure 164: South Korea Mobile Elevated Work Platform (MEWP) Market Share, By Propulsion, 2022 (%)
- Figure 165: South Korea Mobile Elevated Work Platform (MEWP) Market Share, By Height, By Value, 2022 (%)
- Figure 166: South Korea Mobile Elevated Work Platform (MEWP) Market Share, By End-user, 2022 (%)
- Figure 167: India Mobile Elevated Work Platform (MEWP) Market, By Value, 2019-2029 (USD Million & CAGR)
- Figure 168: India Mobile Elevated Work Platform (MEWP) Market Value, By Propulsion, 2022 (USD Million)
- Figure 169: India Mobile Elevated Work Platform (MEWP) Market Share, By Product Type, By Value, 2022 (%)
- Figure 170: India Mobile Elevated Work Platform (MEWP) Market Share, By Propulsion, 2022 (%)
- Figure 171: India Mobile Elevated Work Platform (MEWP) Market Share, By Height, By Value, 2022 (%)
- Figure 172: India Mobile Elevated Work Platform (MEWP) Market Share, By End-user, 2022 (%)
- Figure 173: Rest of Asia Pacific Mobile Elevated Work Platform (MEWP) Market, By Value, 2019-2029 (USD Million & CAGR)
- Figure 174: Rest of Asia Pacific Mobile Elevated Work Platform (MEWP) Market Value, By Propulsion, 2022 (USD Million)
- Figure 175: Rest of Asia Pacific Mobile Elevated Work Platform (MEWP) Market Share, By Product Type, By Value, 2022 (%)
- Figure 176: Rest of Asia Pacific Mobile Elevated Work Platform (MEWP) Market Share, By Propulsion, 2022 (%)
- Figure 177: Rest of Asia Pacific Mobile Elevated Work Platform (MEWP) Market Share, By Height, By Value, 2022 (%)
- Figure 178: Rest of Americas Mobile Elevated Work Platform (MEWP) Market Share, By End-user, 2022 (%)
- Figure 179: Middle east & Africa Mobile Elevated Work Platform (MEWP) Market Size, By Value, 2019H-2029F (USD Million)
- Figure 180: Middle east & Africa Mobile Elevated Work Platform (MEWP) Market Share, By Propulsion, 2022 (%)
- Figure 181: Middle East & Africa Mobile Elevated Work Platform (MEWP) Market Size, By Volume, 2019-2022 (000' Units)
- Figure 182: Middle East & Africa Mobile Elevated Work Platform (MEWP) Market Size, By Volume, 2023-2029 (000' Units)
- Figure 183: Middle east & Africa Mobile Elevated Work Platform (MEWP) Market, By Boom Lift, By Value, 2019H-2029F (USD Million & CAGR)
- Figure 184: Middle east & Africa Mobile Elevated Work Platform (MEWP) Market, By Scissor Lift, By Value, 2019H-2029F (USD Million & CAGR)
- Figure 185: Middle East & Africa Mobile Elevated Work Platform (MEWP) Market, By Vertical Mast Lift, By Value, 2019H-2029F (USD Million & CAGR)
- Figure 186: Middle east & Africa Mobile Elevated Work Platform (MEWP) Market, By Engine-powered, By Value, 2019H-2029F (USD Million & CAGR)
- Figure 187: Middle East & Africa Mobile Elevated Work Platform (MEWP) Market, By Electric, By Value, 2019H-2029F (USD Million & CAGR)
- Figure 188: Middle East & Africa Mobile Elevated Work Platform (MEWP) Market, By Hybrid, By Value, 2019H-2029F (USD Million & CAGR)
- Figure 189: Middle East & Africa Mobile Elevated Work Platform (MEWP) Market, By <10 Meter, By Value, 2019H-2029F (USD Million & CAGR)
- Figure 190: Middle East & Africa Mobile Elevated Work Platform (MEWP) Market, By 10 to 20 Meter, By Value, 2019H-2029F (USD Million & CAGR)
- Figure 191: Middle East & Africa Mobile Elevated Work Platform (MEWP) Market, By >20 Meter, By Value, 2019H-2029F (USD Million & CAGR)
- Figure 192: Middle east & Africa Mobile Elevated Work Platform (MEWP) Market, By Rental Companies, By Value, 2019H-2029F (USD Million & CAGR)
- Figure 193: Middle east & Africa Mobile Elevated Work Platform (MEWP) Market, Construction & Mining, By Value, 2019H-2029F (USD Million & CAGR)
- Figure 194: Middle east & Africa Mobile Elevated Work Platform (MEWP) Market, By Transportation and Logistics, By Value, 2019H-2029F (USD Million & CAGR)
- Figure 195: Middle east & Africa Mobile Elevated Work Platform (MEWP) Market, By Manufacturing, By Value, 2019H-2029F (USD Million & CAGR)
- Figure 196: Middle East & Africa Mobile Elevated Work Platform (MEWP) Market, By Other End-users, By Value, 2019H-2029F (USD Million & CAGR)
- Figure 197: Global Impact of Drivers and Restraints
- Figure 198: Market Share of Prominent Companies of Mobile Elevated Work Platform (MEWP) Market, 2022 (%)
- Figure 199: Haulotte Group Revenues, 2020-2022 (USD Million)
- Figure 200: Haulotte Group, Revenue By Business Segment, 2022 (%)
- Figure 201: Haulotte Group, Revenue By Geographic Segment, 2022 (%)
- Figure 202: Terex Corporation Revenues, 2020-2022 (USD Million)
- Figure 203: Terex Corporation Revenue By Customer Group, 2022 (%)
- Figure 204: Terex Corporation Revenue By Geographic Segment, 2022 (%)
- Figure 205: Tadano Ltd. Revenues, 2020-2022 (USD Million)
- Figure 206: Tadano Ltd. Revenue By Business Segment, 2022 (%)
- Figure 207: Tadano Ltd. Revenue By Geographic Segment, 2022 (%)
- Figure 208: TVH Revenues, 2020-2022 (USD Million)
- Figure 209: TVH Revenue By Business Segment, 2022 (%)
- Figure 210: TVH Revenue By Geographic Segment, 2022 (%)
- Figure 211: Linamar Corporation Revenues, 2020-2022 (USD Million)
- Figure 212: Linamar Corporation Revenue By Business Segment, 2022 (%)
- Figure 213: Linamar Corporation Revenue By Geographic Segment, 2022 (%)
List of Tables
Table A1: Global Impact of Macro Economic Factors, By Region
Table A2: Japanese rental companies growing in Asia
Table A3: Primary Competitors of MEWP Product
Table A4: The world's biggest Top 10 access equipment manufacturers- 2023
Table A5: United States Mobile Elevated Work Platform (MEWP) Market, By Product Type, By Value, 2019-2022 (USD Million)
Table A6: United States Mobile Elevated Work Platform (MEWP) Market, By Product Type, By Value, 2023-2029 (USD Million)
Table A7: United States Mobile Elevated Work Platform (MEWP) Market, By Propulsion, By Value, 2019-2022 (USD Million)
Table A8: United States Mobile Elevated Work Platform (MEWP) Market, By Propulsion, By Value, 2023-2029 (USD Million)
Table A9: United States Mobile Elevated Work Platform (MEWP) Market, By Height, By Value, 2019-2022 (USD Million)
Table A10: United States Mobile Elevated Work Platform (MEWP) Market, By Height, By Value, 2023-2029 (USD Million)
Table A11: United States Mobile Elevated Work Platform (MEWP) Market, By End-user, By Value, 2019-2022 (USD Million)
Table A12: United States Mobile Elevated Work Platform (MEWP) Market, By End-user, By Value, 2023-2029 (USD Million)
Table A13: Canada Mobile Elevated Work Platform (MEWP) Market, By Product Type, By Value, 2019-2022 (USD Million)
Table A14: Canada Mobile Elevated Work Platform (MEWP) Market, By Product Type, By Value, 2023-2029 (USD Million)
Table A15: Canada Mobile Elevated Work Platform (MEWP) Market, By Propulsion, By Value, 2019-2022 (USD Million)
Table A16: Canada Mobile Elevated Work Platform (MEWP) Market, By Propulsion, By Value, 2023-2029 (USD Million)
Table A17: Canada Mobile Elevated Work Platform (MEWP) Market, By Height, By Value, 2019-2022 (USD Million)
Table A18: Canada Mobile Elevated Work Platform (MEWP) Market, By Height, By Value, 2023-2029 (USD Million)
Table A19: Canada Mobile Elevated Work Platform (MEWP) Market, By End-user, By Value, 2019-2022 (USD Million)
Table A20: Canada Mobile Elevated Work Platform (MEWP) Market, By End-user, By Value, 2023-2029 (USD Million)
Table A21: Rest of Americas Mobile Elevated Work Platform (MEWP) Market, By Product Type, By Value, 2019-2022 (USD Million)
Table A22: Rest of Americas Mobile Elevated Work Platform (MEWP) Market, By Product Type, By Value, 2023-2029 (USD Million)
Table A23: Rest of Americas Mobile Elevated Work Platform (MEWP) Market, By Propulsion, By Value, 2019-2022 (USD Million)
Table A24: Rest of Americas Mobile Elevated Work Platform (MEWP) Market, By Propulsion, By Value, 2023-2029 (USD Million)
Table A25: Rest of Americas Mobile Elevated Work Platform (MEWP) Market, By Height, By Value, 2019-2022 (USD Million)
Table A26: Rest of Americas Mobile Elevated Work Platform (MEWP) Market, By Height, By Value, 2019-2022 (USD Million)
Table A27: Rest of Americas Mobile Elevated Work Platform (MEWP) Market, By End-user, By Value, 2019-2022 (USD Million)
Table A28: Rest of Americas Mobile Elevated Work Platform (MEWP) Market, By End-user, By Value, 2023-2029 (USD Million)
Table A29: Germany Mobile Elevated Work Platform (MEWP) Market, By Product Type, By Value, 2019-2022 (USD Million)
Table A30: Germany Mobile Elevated Work Platform (MEWP) Market, By Product Type, By Value, 2023-2029 (USD Million)
Table A31: Germany Mobile Elevated Work Platform (MEWP) Market, By Propulsion, By Value, 2019-2022 (USD Million)
Table A32: Germany Mobile Elevated Work Platform (MEWP) Market, By Propulsion, By Value, 2023-2029 (USD Million)
Table A33: Germany Mobile Elevated Work Platform (MEWP) Market, By Height, By Value, 2019-2022 (USD Million)
Table A34: Germany Mobile Elevated Work Platform (MEWP) Market, By Height, By Value, 2023-2029 (USD Million)
Table A35: Germany Mobile Elevated Work Platform (MEWP) Market, By End-user, By Value, 2019-2022 (USD Million)
Table A36: Germany Mobile Elevated Work Platform (MEWP) Market, By End-user, By Value, 2023-2029 (USD Million)
Table A37: France Mobile Elevated Work Platform (MEWP) Market, By Product Type, By Value, 2019-2022 (USD Million)
Table A38: France Mobile Elevated Work Platform (MEWP) Market, By Product Type, By Value, 2023-2029 (USD Million)
Table A39: France Mobile Elevated Work Platform (MEWP) Market, By Propulsion, By Value, 2019-2022 (USD Million)
Table A40: France Mobile Elevated Work Platform (MEWP) Market, By Propulsion, By Value, 2023-2029 (USD Million)
Table A41: France Mobile Elevated Work Platform (MEWP) Market, By Height, By Value, 2019-2022 (USD Million)
Table A42: France Mobile Elevated Work Platform (MEWP) Market, By Height, By Value, 2023-2029 (USD Million)
Table A43: France Mobile Elevated Work Platform (MEWP) Market, By End-user, By Value, 2019-2022 (USD Million)
Table A44: France Mobile Elevated Work Platform (MEWP) Market, By End-user, By Value, 2023-2029 (USD Million)
Table A45: United Kingdom Mobile Elevated Work Platform (MEWP) Market, By Product Type, By Value, 2019-2022 (USD Million)
Table A46: United Kingdom Mobile Elevated Work Platform (MEWP) Market, By Product Type, By Value, 2023-2029 (USD Million)
Table A47: United Kingdom Mobile Elevated Work Platform (MEWP) Market, By Propulsion, By Value, 2019-2022 (USD Million)
Table A48: United Kingdom Mobile Elevated Work Platform (MEWP) Market, By Propulsion, By Value, 2023-2029 (USD Million)
Table A49: United Kingdom Mobile Elevated Work Platform (MEWP) Market, By Height, By Value, 2019-2022 (USD Million)
Table A50: United Kingdom Mobile Elevated Work Platform (MEWP) Market, By Height, By Value, 2023-2029 (USD Million)
Table A51: United Kingdom Mobile Elevated Work Platform (MEWP) Market, By End-user, By Value, 2019-2022 (USD Million)
Table A52: United Kingdom Elevated Work Platform (MEWP) Market, By End-user, By Value, 2023-2029 (USD Million)
Table A53: Italy Mobile Elevated Work Platform (MEWP) Market, By Product Type, By Value, 2019-2022 (USD Million)
Table A54: Italy Mobile Elevated Work Platform (MEWP) Market, By Product Type, By Value, 2023-2029 (USD Million)
Table A55: Italy Mobile Elevated Work Platform (MEWP) Market, By Propulsion, By Value, 2019-2022 (USD Million)
Table A56: Italy Mobile Elevated Work Platform (MEWP) Market, By Propulsion, By Value, 2023-2029 (USD Million)
Table A57: Italy Mobile Elevated Work Platform (MEWP) Market, By Height, By Value, 2019-2022 (USD Million)
Table A58: Italy Mobile Elevated Work Platform (MEWP) Market, By Height, By Value, 2023-2029 (USD Million)
Table A59: Italy Mobile Elevated Work Platform (MEWP) Market, By End-user, By Value, 2019-2022 (USD Million)
Table A60: Italy Mobile Elevated Work Platform (MEWP) Market, By End-user, By Value, 2023-2029 (USD Million)
Table A61: Rest of Europe Mobile Elevated Work Platform (MEWP) Market, By Product Type, By Value, 2019-2022 (USD Million)
Table A62: Rest of Europe Mobile Elevated Work Platform (MEWP) Market, By Product Type, By Value, 2023-2029 (USD Million)
Table A63: Rest of Europe Mobile Elevated Work Platform (MEWP) Market, By Propulsion, By Value, 2019-2022 (USD Million)
Table A64: Rest of Europe Mobile Elevated Work Platform (MEWP) Market, By Propulsion, By Value, 2023-2029 (USD Million)
Table A65: Rest of Europe Mobile Elevated Work Platform (MEWP) Market, By Height, By Value, 2019-2022 (USD Million)
Table A66: Rest of Europe Mobile Elevated Work Platform (MEWP) Market, By Height, By Value, 2023-2029 (USD Million)
Table A67: Rest of Europe Mobile Elevated Work Platform (MEWP) Market, By End-user, By Value, 2019-2022 (USD Million)
Table A68: Rest of Europe Mobile Elevated Work Platform (MEWP) Market, By End-user, By Value, 2023-2029 (USD Million)
Table A69: China Mobile Elevated Work Platform (MEWP) Market, By Product Type, By Value, 2019-2022 (USD Million)
Table A70: China Mobile Elevated Work Platform (MEWP) Market, By Product Type, By Value, 2023-2029 (USD Million)
Table A71: China Mobile Elevated Work Platform (MEWP) Market, By Propulsion, By Value, 2019-2022 (USD Million)
Table A72: China Mobile Elevated Work Platform (MEWP) Market, By Propulsion, By Value, 2023-2029 (USD Million)
Table A73: China Mobile Elevated Work Platform (MEWP) Market, By Height, By Value, 2019-2022 (USD Million)
Table A74: China Mobile Elevated Work Platform (MEWP) Market, By Height, By Value, 2023-2029 (USD Million)
Table A75: China Mobile Elevated Work Platform (MEWP) Market, By End-user, By Value, 2019-2022 (USD Million)
Table A76: China Mobile Elevated Work Platform (MEWP) Market, By End-user, By Value, 2023-2029 (USD Million)
Table A77: Japan Mobile Elevated Work Platform (MEWP) Market, By Product Type, By Value, 2019-2022 (USD Million)
Table A78: Japan Mobile Elevated Work Platform (MEWP) Market, By Product Type, By Value, 2023-2029 (USD Million)
Table A79: Japan Mobile Elevated Work Platform (MEWP) Market, By Propulsion, By Value, 2019-2022 (USD Million)
Table A80: Japan Mobile Elevated Work Platform (MEWP) Market, By Propulsion, By Value, 2023-2029 (USD Million)
Table A81: Japan Mobile Elevated Work Platform (MEWP) Market, By Height, By Value, 2019-2022 (USD Million)
Table A82: Japan Mobile Elevated Work Platform (MEWP) Market, By Height, By Value, 2023-2029 (USD Million)
Table A83: Japan Mobile Elevated Work Platform (MEWP) Market, By End-user, By Value, 2019-2022 (USD Million)
Table A84: Japan Mobile Elevated Work Platform (MEWP) Market, By End-user, By Value, 2023-2029 (USD M
Executive Summary
Azoth Analytics has released a research report titled "Global Mobile Elevated Work Platform (MEWP) Market (2024 Edition)" which provides a complete analysis of the Global Mobile Elevated Work Platform (MEWP) industry in terms of value (USD Billion) and Volume (Units). The market has been comprehensively segmented by Product Type (Boom Lift, Scissor Lift, Vertical Mast Lift), Propulsion (Engine-powered, Electric, Hybrid), Height (<10 Meter, 10 to 20 Meter, >20 Meter) and by End-user (Rental Companies, Construction & Mining, Transportation and Logistics, Manufacturing, Other End-users). The market has been analyzed for the historical period of 2019-2022, estimates of 2023 and the forecast period of 2024-2029.
The research study also assesses market growth indicators, restraints, sales growth and demand risk, and other important statistics, as well as a full assessment of current and future market trends that are relevant to the market's evolution. During the forecast period, 2024-2029, the Global Mobile Elevated Work Platform (MEWP) Market is expected to expand at a CAGR of 8.6%. Global Mobile Elevated Work Platform (MEWP) market is expected to grow at an extraordinary rate driven by significant expenditures from industry players. The Global Mobile Elevated Work Platform (MEWP) market is expected to increase from USD 1481 million in 2022 to USD 2626 million in 2029, according to Azoth Analytics estimates.
Sales are expected to surpass x thousand units in 2023, with a stunning 8.9% CAGR during the forecast period. Demand is expected to remain high, though revenue growth is expected to slow down over the next few years.
After a significant increase in 2021, MEWP rental companies can further increase investment in the forecast period. The global Mobile Elevated Work Platform (MEWP) market has been experiencing notable sales growth driven by the demand for MEWPs, including scissor lifts, boom lifts, and other elevated work platforms. MEWPs are essential for maintenance activities across various sectors, including manufacturing facilities, logistics warehouses, and commercial buildings. The need for regular inspections and upkeep drives the sales of MEWPs.
The development of infrastructure and construction are two key factors propelling the global Mobile Elevated Work Platform (MEWP) market's expansion. Global population expansion and urbanization are driving up demand for new roads, bridges, buildings, and other essential infrastructure. MEWPs are essential to these projects because they offer productive and secure access to elevated work locations, which facilitates the easier and faster completion of activities like installation, maintenance, and inspection by construction workers. The need for MEWPs is expected to increase in pace with the global expansion of construction activities, strengthening their place as a necessary tool in today's construction instruments.
The need for MEWPs is driven by both new construction projects and the maintenance and renovation of existing infrastructure. An ongoing requirement for elevated work platforms comes from the necessity for routine maintenance and inspections of ageing buildings, bridges, and other structures. The MEWP market is expected to earn benefits from the continuous and changing needs of the worldwide construction and development scenario as long as governments and private businesses continue to invest in modernizing and maintaining existing infrastructure.
However, financial barriers limit market expansion because companies have the option of rental or less expensive options over complete purchase, which affects the general consumption and penetration of MEWPs in sectors that need elevated work platforms. It can be difficult for MEWP manufacturers to convince potential consumers that the benefits of their products exceed the initial expenditure, particularly when compared with competitors' lower-cost products or other access alternatives.
Scope of the Report:
- The report analyses the Global Mobile Elevated Work Platform (MEWP) Market by Value (USD Million).
- The report analyses the Global Mobile Elevated Work Platform (MEWP) Market by Volume (000' Units).
- The report presents the analysis of the Global Mobile Elevated Work Platform (MEWP) Market for the historical period of 2019-2022, the estimated year 2023 and the forecast period of 2024-2029.
- The report analyses the Global Mobile Elevated Work Platform (MEWP) Market by Product Type (Boom Lift, Scissor Lift, Vertical Mast Lift).
- The report analyses the Mobile Elevated Work Platform (MEWP) Market by Propulsion (Engine-powered, Electric, Hybrid).
- The report analyses the Mobile Elevated Work Platform (MEWP) Market by Height (<10 Meter, 10 to 20 Meter, >20 Meter).
- The report analyses the Mobile Elevated Work Platform (MEWP) Market by End-user (Rental Companies, Construction and Mining, Transportation and Logistics, Manufacturing, Other End-users).
- The report analyses the Mobile Elevated Work Platform (MEWP) Market by Region (Americas, Europe, Asia Pacific, Middle East & Africa).
- The report analyses the Mobile Elevated Work Platform (MEWP) Market by Country (United States, Canada, Germany, France, United Kingdom, Italy, China, Japan, South Korea, India).
- The key insights of the report have been presented through the frameworks of SWOT and Porter's Five Forces Analysis.
- Also, the major opportunities, trends, drivers and challenges of the industry have been analyzed in the report.
- The report tracks competitive developments, strategies, mergers and acquisitions and new product development. The companies analysed in the report include Haulotte Group, Tadano Ltd., Terex Corporation, TVH, Linamar Corporation, JLG Industries, Inc., Snorkel International, Inc., Mtandt Limited, Zhejiang Dingli Machinery Co, Ltd., MEC Aerial Work Platforms.
Table of Contents
1. Market Background
- 1.1 Scope and Product Outlook
- 1.2 Executive Summary
- 1.3 Research Methodology
2. Strategic Recommendations
3. Global Mobile Elevated Work Platform (MEWP) Market: Historic and Forecast (2019-2029)
- 3.1 Impact Analysis of Macro Economic Factors on Mobile Elevated Work Platform (MEWP) Market
- 3.2 GDP per Capita
- 3.3 MEWP Fleet Sizes by Region
- 3.4 U.S. MEWP Rental Market and Fleet Size
- 3.5 European MEWP rental market
- 3.6 European MEWP Fleet Size and Revenue
- 3.7 China MEWP Rental Market
- 3.8 Japanese rental companies growing in Asia
- 3.9 Primary Competitors of MEWP Product
- 3.10 Global Mobile Elevated Work Platform (MEWP) Market: Dashboard
- 3.11 Global Mobile Elevated Work Platform (MEWP) Market: Market Value Assessment, 2019-2029 (USD Million)
- 3.12 Global Mobile Elevated Work Platform (MEWP) Market: Market Volume Assessment, 2019-2029 (000' Units)
- 3.13 Global Mobile Elevated Work Platform (MEWP) Market: Recent Developments
- 3.14 Average Price Analysis of Mobile Elevated Work Platform (MEWP) Globally
- 3.15 Impact of COVID-19 on Mobile Elevated Work Platform (MEWP) Market
- 3.16 Global Mobile Elevated Work Platform (MEWP) Market Segmentation: By Product Type
- 3.16.1 Global Mobile Elevated Work Platform (MEWP) Market, By Product Type Overview
- 3.16.2 Global Mobile Elevated Work Platform (MEWP) Market Size, By Boom Lift, By Value, 2019H-2029F (USD Million & CAGR)
- 3.16.3 Global Mobile Elevated Work Platform (MEWP) Market Size, By Scissor Lift, By Value, 2019H-2029F (USD Million & CAGR)
- 3.16.4 Global Mobile Elevated Work Platform (MEWP) Market Size, By Vertical Mast Lift, By Value, 2019H-2029F (USD Million & CAGR)
- 3.17 Global Mobile Elevated Work Platform (MEWP) Market Segmentation: By Propulsion
- 3.17.1 Global Mobile Elevated Work Platform (MEWP) Market, By Propulsion Overview
- 3.17.2 Global Mobile Elevated Work Platform (MEWP) Market Size, By Engine-powered, By Value, 2019H-2029F (USD Million & CAGR)
- 3.17.3 Global Mobile Elevated Work Platform (MEWP) Market Size, By Electric, By Value, 2019H-2029F (USD Million & CAGR)
- 3.17.4 Global Mobile Elevated Work Platform (MEWP) Market Size, By Hybrid, By Value, 2019H-2029F (USD Million & CAGR)
- 3.18 Global Mobile Elevated Work Platform (MEWP) Market Segmentation: By Height
- 3.18.1 Global Mobile Elevated Work Platform (MEWP) Market, By Height Overview
- 3.18.2 Global Mobile Elevated Work Platform (MEWP) Market Size, By <10 Meter, By Value, 2019H-2029F (USD Million & CAGR)
- 3.18.3 Global Mobile Elevated Work Platform (MEWP) Market Size, By 10 to 20 Meter, By Value, 2019H-2029F (USD Million & CAGR)
- 3.18.4 Global Mobile Elevated Work Platform (MEWP) Market Size, By >20 Meter, By Value, 2019H-2029F (USD Million & CAGR)
- 3.19 Global Mobile Elevated Work Platform (MEWP) Market Segmentation: By End-user
- 3.19.1 Global Mobile Elevated Work Platform (MEWP) Market, By End-user Overview
- 3.19.2 Global Mobile Elevated Work Platform (MEWP) Market Size, By Rental Companies, By Value, 2019H-2029F (USD Million & CAGR)
- 3.19.3 Global Mobile Elevated Work Platform (MEWP) Market Size, By Construction & Mining, By Value, 2019H-2029F (USD Million & CAGR)
- 3.19.4 Global Mobile Elevated Work Platform (MEWP) Market Size, By Transportation and Logistics, By Value, 2019H-2029F (USD Million & CAGR)
- 3.19.5 Global Mobile Elevated Work Platform (MEWP) Market Size, By Manufacturing, By Value, 2019H-2029F (USD Million & CAGR)
- 3.19.6 Global Mobile Elevated Work Platform (MEWP) Market Size, By Other End-users, By Value, 2019H-2029F (USD Million & CAGR)
4. Global Mobile Elevated Work Platform (MEWP) Market: Regional Analysis
- 4.1 Regional Coverage of the Study
- 4.2 Regional Snapshot
5. Americas Mobile Elevated Work Platform (MEWP) Market: Historic and Forecast (2019-2029)
- 5.1 Americas Mobile Elevated Work Platform (MEWP) Market: Snapshot
- 5.2 Americas Mobile Elevated Work Platform (MEWP) Market: Market Value Assessment, 2019-2029 (USD Million & CAGR)
- 5.3 Americas Mobile Elevated Work Platform (MEWP) Market: Market Volume Assessment, 2019-2029 (000' Units)
- 5.4 Americas Mobile Elevated Work Platform (MEWP) Market: Key Factors
- 5.5 Americas Mobile Elevated Work Platform (MEWP) Market: Segment Analysis
- 5.6 Americas Mobile Elevated Work Platform (MEWP) Market Segmentation: By Product Type
- 5.6.1 Americas Mobile Elevated Work Platform (MEWP) Market, By Product Type Overview
- 5.6.2 Americas Mobile Elevated Work Platform (MEWP) Market Size, By Boom Lift, By Value, 2019H-2029F (USD Million & CAGR)
- 5.6.3 Americas Mobile Elevated Work Platform (MEWP) Market Size, By Scissor Lift, By Value, 2019H-2029F (USD Million & CAGR)
- 5.6.4 Americas Mobile Elevated Work Platform (MEWP) Market Size, By Vertical Mast Lift, By Value, 2019H-2029F (USD Million & CAGR)
- 5.7 Americas Mobile Elevated Work Platform (MEWP) Market Segmentation: By Propulsion
- 5.7.1 Americas Mobile Elevated Work Platform (MEWP) Market, By Propulsion Overview
- 5.7.2 Americas Mobile Elevated Work Platform (MEWP) Market Size, By Engine-powered, By Value, 2019H-2029F (USD Million & CAGR)
- 5.7.3 Americas Mobile Elevated Work Platform (MEWP) Market Size, By Electric, By Value, 2019H-2029F (USD Million & CAGR)
- 5.7.4 Americas Mobile Elevated Work Platform (MEWP) Market Size, By Hybrid, By Value, 2019H-2029F (USD Million & CAGR)
- 5.8 Americas Mobile Elevated Work Platform (MEWP) Market Segmentation: By Height
- 5.8.1 Americas Mobile Elevated Work Platform (MEWP) Market, By Height Overview
- 5.8.2 Americas Mobile Elevated Work Platform (MEWP) Market Size, By <10 Meter, By Value, 2019H-2029F (USD Million & CAGR)
- 5.8.3 Americas Mobile Elevated Work Platform (MEWP) Market Size, By 10 to 20 Meter, By Value, 2019H-2029F (USD Million & CAGR)
- 5.8.4 Americas Mobile Elevated Work Platform (MEWP) Market Size, By >20 Meter, By Value, 2019H-2029F (USD Million & CAGR)
- 5.9 Americas Mobile Elevated Work Platform (MEWP) Market Segmentation: By End-user
- 5.9.1 Americas Mobile Elevated Work Platform (MEWP) Market, By End-user Overview
- 5.9.2 Americas Mobile Elevated Work Platform (MEWP) Market Size, By Rental Companies, By Value, 2019H-2029F (USD Million & CAGR)
- 5.9.3 Americas Mobile Elevated Work Platform (MEWP) Market Size, By Construction & Mining, By Value, 2019H-2029F (USD Million & CAGR)
- 5.9.4 mericas Mobile Elevated Work Platform (MEWP) Market Size, By Transportation and Logistics, By Value, 2019H-2029F (USD Million & CAGR)
- 5.9.5 Americas Mobile Elevated Work Platform (MEWP) Market Size, By Manufacturing, By Value, 2019H-2029F (USD Million & CAGR)
- 5.9.6 Americas Mobile Elevated Work Platform (MEWP) Market Size, By Other End-users, By Value, 2019H-2029F (USD Million & CAGR)
- 5.10 Americas Mobile Elevated Work Platform (MEWP) Market Segmentation: By Country
- 5.10.1 Americas Mobile Elevated Work Platform (MEWP) Market, By Country Overview
- 5.10.2 United States Mobile Elevated Work Platform (MEWP) Market: Market Size and CAGR, 2019-2029 (USD Million & CAGR)
- 5.10.2.1 United States Mobile Elevated Work Platform (MEWP) Market, By Product Type
- 5.10.2.2 United States Mobile Elevated Work Platform (MEWP) Market, By Propulsion
- 5.10.2.3 United States Mobile Elevated Work Platform (MEWP) Market, By Height
- 5.10.2.4 United States Mobile Elevated Work Platform (MEWP) Market, By End-user
- 5.10.3 Canada Mobile Elevated Work Platform (MEWP) Market: Market Size and CAGR, 2019-2029 (USD Million & CAGR)
- 5.10.3.1 Canada Mobile Elevated Work Platform (MEWP) Market, By Product Type
- 5.10.3.2 Canada Mobile Elevated Work Platform (MEWP) Market, By Propulsion
- 5.10.3.3 Canada Mobile Elevated Work Platform (MEWP) Market, By Height
- 5.10.3.4 Canada Mobile Elevated Work Platform (MEWP) Market, By End-user
- 5.10.4 Rest of Americas Mobile Elevated Work Platform (MEWP) Market: Market Size and CAGR, 2019-2029 (USD Million & CAGR)
- 5.10.4.1 Rest of Americas Mobile Elevated Work Platform (MEWP) Market, By Product Type
- 5.10.4.2 Rest of Americas Mobile Elevated Work Platform (MEWP) Market, By Propulsion
- 5.10.4.3 Rest of Americas Mobile Elevated Work Platform (MEWP) Market, By Height
- 5.10.4.4 Rest of Americas Mobile Elevated Work Platform (MEWP) Market, By End-user
6. Europe Mobile Elevated Work Platform (MEWP) Market: Historic and Forecast (2019-2029)
- 6.1 Europe Mobile Elevated Work Platform (MEWP) Market: Snapshot
- 6.2 Europe Mobile Elevated Work Platform (MEWP) Market: Market Value Assessment, 2019-2029 (USD Million & CAGR)
- 6.3 Europe Mobile Elevated Work Platform (MEWP) Market: Market Volume Assessment, 2019-2029 (000' Units)
- 6.4 Europe Mobile Elevated Work Platform (MEWP) Market: Key Factors
- 6.5 Europe Mobile Elevated Work Platform (MEWP) Market: Segment Analysis
- 6.6 Europe Mobile Elevated Work Platform (MEWP) Market Segmentation: By Product Type
- 6.6.1 Europe Mobile Elevated Work Platform (MEWP) Market, By Product Type Overview
- 6.6.2 Europe Mobile Elevated Work Platform (MEWP) Market Size, By Boom Lift, By Value, 2019H-2029F (USD Million & CAGR)
- 6.6.3 Europe Mobile Elevated Work Platform (MEWP) Market Size, By Scissor Lift, By Value, 2019H-2029F (USD Million & CAGR)
- 6.6.4 Europe Mobile Elevated Work Platform (MEWP) Market Size, By Vertical Mast Lift, By Value, 2019H-2029F (USD Million & CAGR)
- 6.7 Europe Mobile Elevated Work Platform (MEWP) Market Segmentation: By Propulsion
- 6.7.1 Europe Mobile Elevated Work Platform (MEWP) Market, By Propulsion Overview
- 6.7.2 Europe Mobile Elevated Work Platform (MEWP) Market Size, By Engine-powered, By Value, 2019H-2029F (USD Million & CAGR)
- 6.7.3 Europe Mobile Elevated Work Platform (MEWP) Market Size, By Electric, By Value, 2019H-2029F (USD Million & CAGR)
- 6.7.4 Europe Mobile Elevated Work Platform (MEWP) Market Size, By Hybrid, By Value, 2019H-2029F (USD Million & CAGR)
- 6.8 Europe Mobile Elevated Work Platform (MEWP) Market Segmentation: By Height
- 6.8.1 Europe Mobile Elevated Work Platform (MEWP) Market, By Height Overview
- 6.8.2 Europe Mobile Elevated Work Platform (MEWP) Market Size, By <10 Meter, By Value, 2019H-2029F (USD Million & CAGR)
- 6.8.3 Europe Mobile Elevated Work Platform (MEWP) Market Size, By 10 to 20 Meter, By Value, 2019H-2029F (USD Million & CAGR)
- 6.8.4 Europe Mobile Elevated Work Platform (MEWP) Market Size, By >20 Meter, By Value, 2019H-2029F (USD Million & CAGR)
- 6.9 Europe Mobile Elevated Work Platform (MEWP) Market Segmentation: By End-user
- 6.9.1 Europe Mobile Elevated Work Platform (MEWP) Market, By End-user Overview
- 6.9.2 Europe Mobile Elevated Work Platform (MEWP) Market Size, By Rental Companies, By Value, 2019H-2029F (USD Million & CAGR)
- 6.9.3 Europe Mobile Elevated Work Platform (MEWP) Market Size, By Construction & Mining, By Value, 2019H-2029F (USD Million & CAGR)
- 6.9.4 Europe Mobile Elevated Work Platform (MEWP) Market Size, By Transportation and Logistics, By Value, 2019H-2029F (USD Million & CAGR)
- 6.9.5 Europe Mobile Elevated Work Platform (MEWP) Market Size, By Manufacturing, By Value, 2019H-2029F (USD Million & CAGR)
- 6.9.6 Europe Mobile Elevated Work Platform (MEWP) Market Size, By Other End-users, By Value, 2019H-2029F (USD Million & CAGR)
- 6.10 Europe Mobile Elevated Work Platform (MEWP) Market Segmentation: By Country
- 6.10.1 Europe Mobile Elevated Work Platform (MEWP) Market, By Country Overview
- 6.10.2 Germany Mobile Elevated Work Platform (MEWP) Market: Market Size and CAGR, 2019-2029 (USD Million & CAGR)
- 6.10.2.1 Germany Mobile Elevated Work Platform (MEWP) Market, By Product Type
- 6.10.2.2 Germany Mobile Elevated Work Platform (MEWP) Market, By Propulsion
- 6.10.2.3 Germany Mobile Elevated Work Platform (MEWP) Market, By Height
- 6.10.2.4 Germany Mobile Elevated Work Platform (MEWP) Market, By End-user
- 6.10.3 France Mobile Elevated Work Platform (MEWP) Market: Market Size and CAGR, 2019-2029 (USD Million & CAGR)
- 6.10.3.1 France Mobile Elevated Work Platform (MEWP) Market, By Product Type
- 6.10.3.2 France Mobile Elevated Work Platform (MEWP) Market, By Propulsion
- 6.10.3.3 France Mobile Elevated Work Platform (MEWP) Market, By Height
- 6.10.3.4 France Mobile Elevated Work Platform (MEWP) Market, By End-user
- 6.10.4 United Kingdom Mobile Elevated Work Platform (MEWP) Market: Market Size and CAGR, 2019-2029 (USD Million & CAGR)
- 6.10.4.1 United Kingdom Mobile Elevated Work Platform (MEWP) Market, By Product Type
- 6.10.4.2 United Kingdom Mobile Elevated Work Platform (MEWP) Market, By Propulsion
- 6.10.4.3 United Kingdom Mobile Elevated Work Platform (MEWP) Market, By Height
- 6.10.4.4 United Kingdom Mobile Elevated Work Platform (MEWP) Market, By End-user
- 6.10.5 Italy Mobile Elevated Work Platform (MEWP) Market: Market Size and CAGR, 2019-2029 (USD Million & CAGR)
- 6.10.5.1 Italy Mobile Elevated Work Platform (MEWP) Market, By Product Type
- 6.10.5.2 Italy Mobile Elevated Work Platform (MEWP) Market, By Propulsion
- 6.10.5.3 Italy Mobile Elevated Work Platform (MEWP) Market, By Height
- 6.10.5.4 Italy Mobile Elevated Work Platform (MEWP) Market, By End-user
- 6.10.6 Rest of Europe Mobile Elevated Work Platform (MEWP) Market: Market Size and CAGR, 2019-2029 (USD Million & CAGR)
- 6.10.6.1 Rest of Europe Mobile Elevated Work Platform (MEWP) Market, By Product Type
- 6.10.6.2 Rest of Europe Mobile Elevated Work Platform (MEWP) Market, By Propulsion
- 6.10.6.3 Rest of Europe Mobile Elevated Work Platform (MEWP) Market, By Height
- 6.10.6.4 Rest of Europe Mobile Elevated Work Platform (MEWP) Market, By End-user
7. Asia Pacific Mobile Elevated Work Platform (MEWP) Market: Historic and Forecast (2019-2029)
- 7.1 Asia Pacific Mobile Elevated Work Platform (MEWP) Market: Snapshot
- 7.2 Asia Pacific Mobile Elevated Work Platform (MEWP) Market: Market Value Assessment, 2019-2029 (USD Million & CAGR)
- 7.3 Asia Pacific Mobile Elevated Work Platform (MEWP) Market: Market Volume Assessment, 2019-2029 (000' Units)
- 7.4 Asia Pacific Mobile Elevated Work Platform (MEWP) Market: Key Factors
- 7.5 Asia Pacific Mobile Elevated Work Platform (MEWP) Market: Segment Analysis
- 7.6 Asia Pacific Mobile Elevated Work Platform (MEWP) Market Segmentation: By Product Type
- 7.6.1 Asia Pacific Mobile Elevated Work Platform (MEWP) Market, By Product Type Overview
- 7.6.2 Asia Pacific Mobile Elevated Work Platform (MEWP) Market Size, By Boom Lift, By Value, 2019H-2029F (USD Million & CAGR)
- 7.6.3 Asia Pacific Mobile Elevated Work Platform (MEWP) Market Size, By Scissor Lift, By Value, 2019H-2029F (USD Million & CAGR)
- 7.6.4 Asia Pacific Mobile Elevated Work Platform (MEWP) Market Size, By Vertical Mast Lift, By Value, 2019H-2029F (USD Million & CAGR)
- 7.7 Asia Pacific Mobile Elevated Work Platform (MEWP) Market Segmentation: By Propulsion
- 7.7.1 Asia Pacific Mobile Elevated Work Platform (MEWP) Market, By Propulsion Overview
- 7.7.2 Asia Pacific Mobile Elevated Work Platform (MEWP) Market Size, By Engine-powered, By Value, 2019H-2029F (USD Million & CAGR)
- 7.7.3 Asia Pacific Mobile Elevated Work Platform (MEWP) Market Size, By Electric, By Value, 2019H-2029F (USD Million & CAGR)
- 7.7.4 Asia Pacific Mobile Elevated Work Platform (MEWP) Market Size, By Hybrid, By Value, 2019H-2029F (USD Million & CAGR)
- 7.8 Asia Pacific Mobile Elevated Work Platform (MEWP) Market Segmentation: By Height
- 7.8.1 Asia Pacific Mobile Elevated Work Platform (MEWP) Market, By Height Overview
- 7.8.2 Asia Pacific Mobile Elevated Work Platform (MEWP) Market Size, By <10 Meter, By Value, 2019H-2029F (USD Million & CAGR)
- 7.8.3 Asia Pacific Mobile Elevated Work Platform (MEWP) Market Size, By 10 to 20 Meter, By Value, 2019H-2029F (USD Million & CAGR)
- 7.8.4 Asia Pacific Mobile Elevated Work Platform (MEWP) Market Size, By >20 Meter, By Value, 2019H-2029F (USD Million & CAGR)
- 7.9 Asia Pacific Mobile Elevated Work Platform (MEWP) Market Segmentation: By End-user
- 7.9.1 Asia Pacific Mobile Elevated Work Platform (MEWP) Market, By End-user Overview
- 7.9.2 Asia Pacific Mobile Elevated Work Platform (MEWP) Market Size, By Rental Companies, By Value, 2019H-2029F (USD Million & CAGR)
- 7.9.3 Asia Pacific Mobile Elevated Work Platform (MEWP) Market Size, By Construction & Mining, By Value, 2019H-2029F (USD Million & CAGR)
- 7.9.4 Asia Pacific Mobile Elevated Work Platform (MEWP) Market Size, By Transportation and Logistics, By Value, 2019H-2029F (USD Million & CAGR)
- 7.9.5 Asia Pacific Mobile Elevated Work Platform (MEWP) Market Size, By Manufacturing, By Value, 2019H-2029F (USD Million & CAGR)
- 7.9.6 Asia Pacific Mobile Elevated Work Platform (MEWP) Market Size, By Other End-users, By Value, 2019H-2029F (USD Million & CAGR)
- 7.10 Asia Pacific Mobile Elevated Work Platform (MEWP) Market Segmentation: By Country
- 7.10.1 Asia Pacific Mobile Elevated Work Platform (MEWP) Market, By Country Overview
- 7.10.2 China Mobile Elevated Work Platform (MEWP) Market: Market Size and CAGR, 2019-2029 (USD Million & CAGR)
- 7.10.2.1 China Mobile Elevated Work Platform (MEWP) Market, By Product Type
- 7.10.2.2 China Mobile Elevated Work Platform (MEWP) Market, By Propulsion
- 7.10.2.3 China Mobile Elevated Work Platform (MEWP) Market, By Height
- 7.10.2.4 China Mobile Elevated Work Platform (MEWP) Market, By End-user
- 7.10.3 Japan Mobile Elevated Work Platform (MEWP) Market: Market Size and CAGR, 2019-2029 (USD Million & CAGR)
- 7.10.3.1 Japan Mobile Elevated Work Platform (MEWP) Market, By Product Type
- 7.10.3.2 Japan Mobile Elevated Work Platform (MEWP) Market, By Propulsion
- 7.10.3.3 Japan Mobile Elevated Work Platform (MEWP) Market, By Height
- 7.10.3.4 Japan Mobile Elevated Work Platform (MEWP) Market, By End-user
- 7.10.4 South Korea Mobile Elevated Work Platform (MEWP) Market: Market Size and CAGR, 2019-2029 (USD Million & CAGR)
- 7.10.4.1 South Korea Mobile Elevated Work Platform (MEWP) Market, By Product Type
- 7.10.4.2 South Korea Mobile Elevated Work Platform (MEWP) Market, By Propulsion
- 7.10.4.3 South Korea Mobile Elevated Work Platform (MEWP) Market, By Height
- 7.10.4.4 South Korea Mobile Elevated Work Platform (MEWP) Market, By End-user
- 7.10.5 India Mobile Elevated Work Platform (MEWP) Market: Market Size and CAGR, 2019-2029 (USD Million & CAGR)
- 7.10.5.1 India Mobile Elevated Work Platform (MEWP) Market, By Product Type
- 7.10.5.2 India Mobile Elevated Work Platform (MEWP) Market, By Propulsion
- 7.10.5.3 India Mobile Elevated Work Platform (MEWP) Market, By Height
- 7.10.5.4 India Mobile Elevated Work Platform (MEWP) Market, By End-user
- 7.10.6 Rest of Asia Pacific Mobile Elevated Work Platform (MEWP) Market: Market Size and CAGR, 2019-2029 (USD Million & CAGR)
- 7.10.6.1 Rest of Asia Pacific Mobile Elevated Work Platform (MEWP) Market, By Product Type
- 7.10.6.2 Rest of Asia Pacific Mobile Elevated Work Platform (MEWP) Market, By Propulsion
- 7.10.6.3 Rest of Asia Pacific Mobile Elevated Work Platform (MEWP) Market, By Height
- 7.10.6.4 Rest of Asia Pacific Mobile Elevated Work Platform (MEWP) Market, By End-user
8. Middle East & Africa Mobile Elevated Work Platform (MEWP) Market: Historic and Forecast (2019-2029)
- 8.1 Middle East & Africa Mobile Elevated Work Platform (MEWP) Market: Snapshot
- 8.2 Middle East & Africa Mobile Elevated Work Platform (MEWP) Market: Market Value Assessment, 2019-2029 (USD Million & CAGR)
- 8.3 Middle East & Africa Mobile Elevated Work Platform (MEWP) Market: Market Volume Assessment, 2019-2029 (000' Units)
- 8.4 Middle East & Africa Mobile Elevated Work Platform (MEWP) Market: Key Factors
- 8.5 Middle East & Africa Mobile Elevated Work Platform (MEWP) Market: Segment Analysis
- 8.6 Middle East & Africa Mobile Elevated Work Platform (MEWP) Market Segmentation: By Product Type
- 8.6.1 Middle East & Africa Mobile Elevated Work Platform (MEWP) Market, By Product Type Overview
- 8.6.2 Middle East & Africa Mobile Elevated Work Platform (MEWP) Market Size, By Boom Lift, By Value, 2019H-2029F (USD Million & CAGR)
- 8.6.3 Middle East & Africa Mobile Elevated Work Platform (MEWP) Market Size, By Scissor Lift, By Value, 2019H-2029F (USD Million & CAGR)
- 8.6.4 Middle East & Africa Mobile Elevated Work Platform (MEWP) Market Size, By Vertical Mast Lift, By Value, 2019H-2029F (USD Million & CAGR)
- 8.7 Middle East & Africa Mobile Elevated Work Platform (MEWP) Market Segmentation: By Propulsion
- 8.7.1 Middle East & Africa Mobile Elevated Work Platform (MEWP) Market, By Propulsion Overview
- 8.7.2 Middle East & Africa Mobile Elevated Work Platform (MEWP) Market Size, By Engine-powered, By Value, 2019H-2029F (USD Million & CAGR)
- 8.7.3 Middle East & Africa Mobile Elevated Work Platform (MEWP) Market Size, By Electric, By Value, 2019H-2029F (USD Million & CAGR)
- 8.7.4 Middle East & Africa Mobile Elevated Work Platform (MEWP) Market Size, By Hybrid, By Value, 2019H-2029F (USD Million & CAGR)
- 8.8 Middle East & Africa Mobile Elevated Work Platform (MEWP) Market Segmentation: By Height
- 8.8.1 Middle East & Africa Mobile Elevated Work Platform (MEWP) Market, By Height Overview
- 8.8.2 Middle East & Africa Mobile Elevated Work Platform (MEWP) Market Size, By <10 Meter, By Value, 2019H-2029F (USD Million & CAGR)
- 8.8.3 Middle East & Africa Mobile Elevated Work Platform (MEWP) Market Size, By 10 to 20 Meter, By Value, 2019H-2029F (USD Million & CAGR)
- 8.8.4 Middle East & Africa Mobile Elevated Work Platform (MEWP) Market Size, By >20 Meter, By Value, 2019H-2029F (USD Million & CAGR)
- 8.9 Middle East & Africa Mobile Elevated Work Platform (MEWP) Market Segmentation: By End-user
- 8.9.1 Middle East & Africa Mobile Elevated Work Platform (MEWP) Market, By End-user Overview
- 8.9.2 Middle East & Africa Mobile Elevated Work Platform (MEWP) Market Size, By Rental Companies, By Value, 2019H-2029F (USD Million & CAGR)
- 8.9.3 Middle East & Africa Mobile Elevated Work Platform (MEWP) Market Size, By Construction & Mining, By Value, 2019H-2029F (USD Million & CAGR)
- 8.9.4 Middle East & Africa Mobile Elevated Work Platform (MEWP) Market Size, By Transportation and Logistics, By Value, 2019H-2029F (USD Million & CAGR)
- 8.9.5 Middle East & Africa Mobile Elevated Work Platform (MEWP) Market Size, By Manufacturing, By Value, 2019H-2029F (USD Million & CAGR)
- 8.9.6 Middle East & Africa Mobile Elevated Work Platform (MEWP) Market Size, By Other End-users, By Value, 2019H-2029F (USD Million & CAGR)
9. Market Dynamics
- 9.1 Impact Assessment of Market Dynamics on Global Mobile Elevated Work Platform (MEWP) Market
- 9.2 Drivers
- 9.3 Restraints
- 9.4 Trends
10. Industry Ecosystem Analysis
- 10.1 Value Chain Analysis
- 10.2 Porter's Five Forces Model
11. Competitive Positioning
- 11.1 Companies' Product Positioning
- 11.2 Market Position Matrix
- 11.3 Market Share Analysis of Mobile Elevated Work Platform (MEWP) Market
- 11.4 Company Profiles
- 11.4.1 Haulotte Group
- 11.4.2 Terex Corporation
- 11.4.3 Tadano Ltd.
- 11.4.4 TVH
- 11.4.5 Linamar Corporation
- 11.4.6 JLG Industries, Inc.
- 11.4.7 Snorkel International, Inc.
- 11.4.8 Mtandt Group
- 11.4.9 Zhejiang Dingli Machinery Co, Ltd.
- 11.4.10 MEC Aerial Work Platforms
