|
|
市場調査レポート
商品コード
1300104
芯地の世界市場(2023年版)- 金額、数量、価格、タイプ、材料、用途別の分析:市場考察、予測(2019年~2029年)Global Interlining Fabric Market (2023 Edition) - Analysis By Value, Volume, Pricing, Type (Fusible, Non-Fusible), Material (Polyester, Cotton, Nylon, Others), Applications: Market Insights and Forecast (2019-2029) |
||||||
|
|
|||||||
|
|||||||


| 芯地の世界市場(2023年版)- 金額、数量、価格、タイプ、材料、用途別の分析:市場考察、予測(2019年~2029年) |
|
出版日: 2023年07月01日
発行: Azoth Analytics
ページ情報: 英文 260 Pages
納期: 即納可能
|

- 全表示
- 概要
- 図表
- 目次
世界の芯地の市場規模は、2022年の29億米ドルから2029年末までに40億米ドルに達すると予測されています。市場は、テキスタイル・アパレル業界の拡大、機能性テキスタイルの需要の増加、芯地製造における技術の進歩などによって安定した成長を示しています。
当レポートでは、世界の芯地市場について調査し、市場規模と予測、地域とセグメントの分析、主な動向と機会などの情報を提供しています。
目次
第1章 市場の背景
- 範囲と製品の見通し
- エグゼクティブサマリー
- 調査手法
第2章 戦略的推奨事項
- カスタマイズの提供への注力
- ファッションデザイナーやメーカーとの提携
第3章 世界の芯地市場:実績と予測
- 芯地市場に対するマクロ経済要因の影響の分析(2019年~2029年)
- テキスタイル生産の上位10か国
- 欧州のテキスタイル・衣料品製造業界への投資
- 世界の芯地市場:ダッシュボード
- 世界の芯地市場:市場規模とCAGR(2019年~2029年)
- 世界の芯地市場:市場規模とCAGR(2019年~2029年)
- 芯地の平均販売価格の評価
- 世界の芯地市場に対するCOVID-19の影響
- 世界の芯地市場セグメンテーション:タイプ別
- 世界の芯地市場セグメンテーション:材料別
- 世界の芯地市場セグメンテーション:用途別
第4章 芯地市場、地域分析
- 研究の地域の範囲
- 地域のスナップショット
第5章 南北アメリカの芯地市場:実績と予測(2019年~2029年)
- 南北アメリカの芯地市場:スナップショット
- 南北アメリカの芯地市場:市場規模とCAGR(2019年~2029年)
- 南北アメリカの芯地市場:市場規模とCAGR(2019年~2029年)
- 南北アメリカの芯地の平均販売価格の評価
- 南北アメリカの芯地市場:主な要因
- 南北アメリカの芯地市場セグメンテーション:タイプ別
- 南北アメリカの芯地市場セグメンテーション:材料別
- 南北アメリカの芯地市場セグメンテーション:用途別
- 南北アメリカの芯地市場セグメンテーション:国別
- 米国の芯地市場:市場規模とCAGR(2019年~2029年)
- カナダの芯地市場:市場規模とCAGR(2019年~2029年)
- ブラジルの芯地市場:市場規模とCAGR(2019年~2029年)
- その他の南北アメリカの地域の芯地市場:市場規模とCAGR(2019年~2029年)
第6章 欧州の芯地市場:実績と予測(2019年~2029年)
- 欧州の芯地市場:スナップショット
- 欧州の芯地市場:市場規模とCAGR(2019年~2029年)
- 欧州の芯地市場:市場規模とCAGR(2019年~2029年)
- 欧州の芯地の平均販売価格の評価
- 欧州の芯地市場:主な要因
- 欧州の芯地市場セグメンテーション:タイプ別
- 欧州の芯地市場セグメンテーション:材料別
- 欧州の芯地市場セグメンテーション:用途別
- 欧州の芯地市場セグメンテーション:国別
- 英国の芯地市場:市場規模とCAGR(2019年~2029年)
- ドイツの芯地市場:市場規模とCAGR(2019年~2029年)
- フランスの芯地市場:市場規模とCAGR(2019年~2029年)
- その他の欧州の芯地市場:市場規模とCAGR(2019年~2029年)
第7章 アジア太平洋の芯地市場:実績と予測(2019年~2029年)
- アジア太平洋の芯地市場:スナップショット
- アジア太平洋の芯地市場:市場規模とCAGR(2019年~2029年)
- アジア太平洋の芯地市場:市場規模とCAGR(2019年~2029年)
- アジア太平洋の芯地の平均販売価格の評価
- アジア太平洋の芯地市場:主な要因
- アジア太平洋の芯地市場セグメンテーション:タイプ別
- アジア太平洋の芯地市場セグメンテーション:材料別
- アジア太平洋の芯地市場セグメンテーション:用途別
- アジア太平洋の芯地市場セグメンテーション:国別
- 中国の芯地市場:市場規模とCAGR(2019年~2029年)
- インドの芯地市場:市場規模とCAGR(2019年~2029年)
- 日本の芯地市場:市場規模とCAGR(2019年~2029年)
- 韓国の芯地市場:市場規模とCAGR(2019年~2029年)
- その他のアジア太平洋太平洋芯地市場:市場規模とCAGR(2019年~2029年)
第8章 中東・アフリカの芯地市場:実績と予測(2019年~2029年)
- 中東・アフリカの芯地市場:スナップショット
- 中東・アフリカの芯地市場:市場規模とCAGR(2019年~2029年)
- 中東・アフリカの芯地市場:市場規模とCAGR(2019年~2029年)
- 中東・アフリカの芯地の平均販売価格の評価
- 中東・アフリカの芯地市場:主な要因
- 中東・アフリカの芯地市場セグメンテーション:タイプ別
- 中東・アフリカの芯地市場セグメンテーション:材料別
- 中東・アフリカの芯地市場セグメンテーション:用途別
第9章 市場力学
- 芯地市場に対する市場力学の影響の評価
- 促進要因
- 抑制要因
- 動向
第10章 業界エコシステム分析
- マクロ経済要因の評価
- バリューチェーン分析
- ポーターのファイブフォース分析
第11章 競合ポジショニング
- 企業の製品ポジショニング
- 市場ポジションマトリックス
- 芯地市場の市場シェア分析
- 企業プロファイル
- Chargeurs
- Freudenberg
- Wendler Interlining Group
- Kufner Holding GmbH
- Veratex Lining Ltd.
- Edmund Bell & Company
- Block Bindings and Interlinings Ltd.
- H&V
- NH Textil Group
- Japan Vilene Company
List of Figures
List of Figures
- Figure 1: Investment in Textile & Clothing Manufacturing Industry in European Region, 2017-2021, (billion Euros)
- Figure 2: Global Interlining Fabric Market Size, By Value, 2019-2022 (USD Million)
- Figure 3: Global Interlining Fabric Market Size, By Value, 2024-2029 (USD Million)
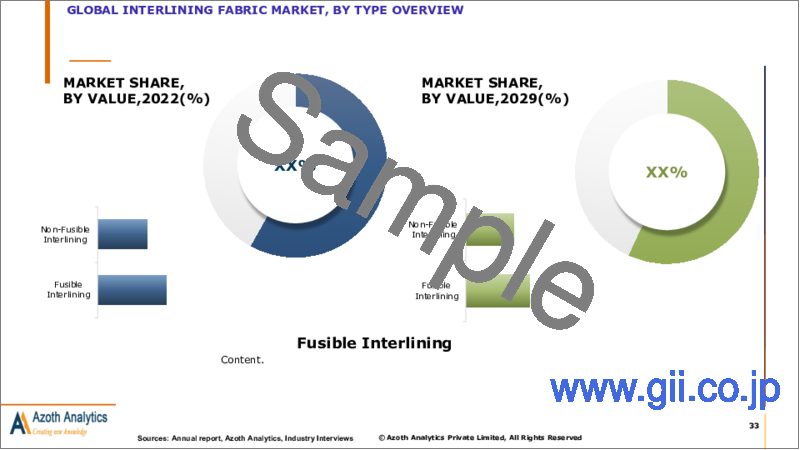
- Figure 4: Global Interlining Fabric Market Share, By Type, 2022 (%)
- Figure 5: Global Interlining Fabric Market Size, By Volume, 2019-2022 (Million sq. mtr.)
- Figure 6: Global Interlining Fabric Market Size, By Volume, 2024-2029 (Million sq. mtr.)
- Figure 7: Global Interlining Fabric Market Size, By Fusible Interlining, By Value, 2019H-2029F (USD MILLION & CAGR)
- Figure 8: Global Interlining Fabric Market Size, By Fusible Interlining, By Value, 2019H-2029F (USD MILLION & CAGR)
- Figure 9: Global Interlining Fabric Market Absolute Opportunity, By Fusible Interlining, 2019-2029 (USD Million)
- Figure 10: Global Interlining Fabric Market Size, By Non-Fusible Interlining, By Value, 2019H-2029F (USD MILLION & CAGR)
- Figure 11: Global Interlining Fabric Market Absolute Opportunity, By Non-Fusible Interlining, 2019-2029 (USD Million)
- Figure 12: Global Interlining Fabric Market Size, By Polyester, By Value, 2019H-2029F (USD MILLION & CAGR)
- Figure 13: Global Interlining Fabric Market Absolute Opportunity, By Non-Fusible Interlining, 2019-2029 (USD Million)
- Figure 14: Global Interlining Fabric Market Size, By Cotton, By Value, 2019H-2029F (USD MILLION & CAGR)
- Figure 15: Global Interlining Fabric Market Absolute Opportunity, By Cotton, 2019-2029 (USD Million)
- Figure 16: Global Interlining Fabric Market Size, By Nylon, By Value, 2019H-2029F (USD MILLION & CAGR)
- Figure 17: Global Interlining Fabric Market Absolute Opportunity, By Nylon, 2019-2029 (USD Million)
- Figure 18: Global Interlining Fabric Market Size, By Other Material, By Value, 2019H-2029F (USD MILLION & CAGR)
- Figure 19: Global Interlining Fabric Market Absolute Opportunity, By Other Material, 2019-2029 (USD Million)
- Figure 20: Global Interlining Fabric Market Size, By Clothing, By Value, 2019H-2029F (USD MILLION & CAGR)
- Figure 21: Global Interlining Fabric Market Absolute Opportunity, By Clothing, 2019-2029 (USD Million)
- Figure 22: Global Interlining Fabric Market Size, By Bags, By Value, 2019H-2029F (USD MILLION & CAGR)
- Figure 23: Global Interlining Fabric Market Absolute Opportunity, By Bags, 2019-2029 (USD Million)
- Figure 24: Global Interlining Fabric Market Size, By Shoes, By Value, 2019H-2029F (USD MILLION & CAGR)
- Figure 25: Global Interlining Fabric Market Absolute Opportunity, By Shoes, 2019-2029 (USD Million)
- Figure 26: Global Interlining Fabric Market Size, By Other Applications, By Value, 2019H-2029F (USD MILLION & CAGR)
- Figure 27: Global Interlining Fabric Market Absolute Opportunity, By Other Applications, 2019-2029 (USD Million)
- Figure 28: Americas Interlining Fabric Market Size, By Value, 2019H-2029F (USD Million)
- Figure 29: Americas Interlining Fabric Market Share, By Type, 2022 (%)
- Figure 30: Americas Interlining Fabric Market Size, By Volume, 2019H-2022A (Million sq. mtr.)
- Figure 31: Americas Interlining Fabric Market Size, By Volume, 2023E-2029F (Million sq. mtr.)
- Figure 32: Price of Interlining Fabric in Americas, 2019H-2029F (USD/ Sq. mtr.)
- Figure 33: Americas Interlining Fabric Market, By Fusible Interlining, By Value, 2019H-2029F (USD MILLION & CAGR)
- Figure 34: Americas Interlining Fabric Market, By Non-Fusible Interlining, By Value, 2019H-2029F (USD MILLION & CAGR)
- Figure 35: Americas Interlining Fabric Market, By Polyester, By Value, 2019H-2029F (USD MILLION & CAGR)
- Figure 36: Americas Interlining Fabric Market, By Cotton, By Value, 2019H-2029F (USD MILLION & CAGR)
- Figure 37: Americas Interlining Fabric Market, By Nylon, By Value, 2019H-2029F (USD MILLION & CAGR)
- Figure 38: Americas Interlining Fabric Market, By Other Material, By Value, 2019H-2029F (USD MILLION & CAGR)
- Figure 39: Americas Interlining Fabric Market, By Clothing, By Value, 2019H-2029F (USD MILLION & CAGR)
- Figure 40: Americas Interlining Fabric Market, By Bags, By Value, 2019H-2029F (USD MILLION & CAGR)
- Figure 41: Americas Interlining Fabric Market, By Shoes, By Value, 2019H-2029F (USD MILLION & CAGR
- Figure 42: Americas Interlining Fabric Market, By Other Applications, By Value, 2019H-2029F (USD MILLION & CAGR)
- Figure 43: United States Interlining Fabric Market, By Value, 2019-2029 (USD MILLION & CAGR)
- Figure 44: United States Interlining Fabric Market Value, By Material, 2022 (USD Million)
- Figure 45: United States Interlining Fabric Market Share, By Type, By Value, 2022 (%)
- Figure 46: United States Interlining Fabric Market Share, By Material, By Value, 2022 (%)
- Figure 47: United States Interlining Fabric Market Share, By Applications, 2022 (%)
- Figure 48: Canada Interlining Fabric Market, By Value, 2019-2029 (USD MILLION & CAGR)
- Figure 49: Canada Interlining Fabric Market Value, By Material, 2022 (USD Million)
- Figure 50: Canada Interlining Fabric Market Share, By Type, By Value, 2022 (%)
- Figure 51: Canada Interlining Fabric Market Share, By Material, By Value, 222 (%)
- Figure 52: Canada Interlining Fabric Market Share, By Applications, 2022 (%
- Figure 53: Brazil Interlining Fabric Market, By Value, 2019-2029 (USD MILLION & CAGR)
- Figure 54: Brazil Interlining Fabric Market Value, By Material, 2022 (USD Million)
- Figure 55: Brazil Interlining Fabric Market Share, By Type, By Value, 2022 (%)
- Figure 56: Brazil Interlining Fabric Market Share, By Material, By Value, 2022 (%)
- Figure 57: Brazil Interlining Fabric Market Share, By Applications, 2022 (%)
- Figure 58: Rest of Americas Interlining Fabric Market, By Value, 2019-2029 (USD MILLION & CAGR)
- Figure 59: Rest of Americas Interlining Fabric Market Value, By Material, 2022 (USD Million)
- Figure 60: Rest of Americas Interlining Fabric Market Share, By Type, By Value, 2022 (%)
- Figure 61: Rest of Americas Interlining Fabric Market Share, By Material, By Value, 2022 (%)
- Figure 62: Rest of Americas Interlining Fabric Market Share, By Applications, 2022 (%)
- Figure 63: Europe Interlining Fabric Market Size, By Value, 2019H-2029F (USD Million)
- Figure 64: Europe Interlining Fabric Market Share, By Type, 2022 (%)
- Figure 65: Europe Interlining Fabric Market Size, By Volume, 2019H-2022A (Million sq. mtr.)
- Figure 66: Europe Interlining Fabric Market Size, By Volume, 2023E-2029F (Million sq. mtr.)
- Figure 67: Price of Interlining Fabric in Europe, 2019H-2029F (USD/ Sq. mtr.)
- Figure 68: Europe Interlining Fabric Market, By Fusible Interlining, By Value, 2019H-2029F (USD MILLION & CAGR)
- Figure 69: Europe Interlining Fabric Market, By Non-Fusible Interlining, By Value, 2019H-2029F (USD MILLION & CAGR)
- Figure 70: Europe Interlining Fabric Market, By Polyester, By Value, 2019H-2029F (USD MILLION & CAGR)
- Figure 71: Europe Interlining Fabric Market, By Cotton, By Value, 2019H-2029F (USD MILLION & CAGR)
- Figure 72: Europe Interlining Fabric Market, By Nylon, By Value, 2019H-2029F (USD MILLION & CAGR)
- Figure 73: Europe Interlining Fabric Market, By Others., By Value, 2019H-2029F (USD MILLION & CAGR)
- Figure 74: Europe Interlining Fabric Market, By Clothing, By Value, 2019H-2029F (USD MILLION & CAGR)
- Figure 75: Europe Interlining Fabric Market, By Bags, By Value, 2019H-2029F (USD MILLION & CAGR)
- Figure 76: Europe Interlining Fabric Market, By Shoes, By Value, 2019H-2029F (USD MILLION & CAGR)
- Figure 77: Europe Interlining Fabric Market, By Other Applications, By Value, 2019H-2029F (USD MILLION & CAGR)
- Figure 78: United Kingdom Interlining Fabric Market, By Value, 2019-2029 (USD MILLION & CAGR)
- Figure 79: United Kingdom Interlining Fabric Market Value, By Material, 2022 (USD Million)
- Figure 80: United Kingdom Interlining Fabric Market Share, By Type, By Value, 2022 (%)
- Figure 81: United Kingdom Interlining Fabric Market Share, By Material, By Value, 2022 (%)
- Figure 82: United Kingdom Interlining Fabric Market Share, By Applications, 2022 (%)
- Figure 83: Germany Interlining Fabric Market, By Value, 2019-2029 (USD MILLION & CAGR)
- Figure 84: Germany Interlining Fabric Market Value, By Material, 2022 (USD Million)
- Figure 85: Germany Interlining Fabric Market Share, By Type, By Value, 2022 (%
- Figure 86: Germany Interlining Fabric Market Share, By Material, By Value, 2022 (%)
- Figure 87: Germany Interlining Fabric Market Share, By Applications, 2022 (%)
- Figure 88: France Interlining Fabric Market, By Value, 2019-2029 (USD MILLION & CAGR)
- Figure 89: France Interlining Fabric Market Value, By Material, 2022 (USD Million)
- Figure 90: France Interlining Fabric Market Share, By Type, By Value, 2022 (%)
- Figure 91: France Interlining Fabric Market Share, By Material, By Value, 2022 (%)
- Figure 92: France Interlining Fabric Market Share, By Applications, 2022 (%)
- Figure 93: Rest of Europe Interlining Fabric Market, By Value, 2019-2029 (USD MILLION & CAGR)
- Figure 94: Rest of Europe Interlining Fabric Market Value, By Material, 2022 (USD Million)
- Figure 95: Rest of Europe Interlining Fabric Market Share, By Type, By Value, 2022 (%)
- Figure 96: Rest of Europe Interlining Fabric Market Share, By Material, By Value, 2022 (%)
- Figure 97: Rest of Europe Interlining Fabric Market Share, By Applications, 2022 (%)
- Figure 98: Asia Pacific Interlining Fabric Market Size, By Value, 2019H-229F (USD Million)
- Figure 99: Asia Pacific Interlining Fabric Market Share, By Type, 2022 (%
- Figure 100: Asia Pacific Interlining Fabric Market Size, By Volume, 2019H-2022A (Million sq. mtr.)
- Figure 101: Asia Pacific Interlining Fabric Market Size, By Volume, 2023E-2029F (Million sq. mtr.)
- Figure 102: Price of Interlining Fabric in Asia Pacific, 2019H-2029F (USD/ Sq. mtr.)
- Figure 103: Asia Pacific Interlining Fabric Market, By Fusible Interlining, By Value, 2019H-2029F (USD MILLION & CAGR)
- Figure 104: Asia Pacific Interlining Fabric Market, By Non-Fusible Interlining, By Value, 2019H-2029F (USD MILLION & CAGR)
- Figure 105: Asia Pacific Interlining Fabric Market, By Polyester, By Value, 2019H-2029F (USD MILLION & CAGR)
- Figure 106: Asia Pacific Interlining Fabric Market, By Cotton, By Value, 2019H-2029F (USD MILLION & CAGR)
- Figure 107: Asia Pacific Interlining Fabric Market, By Nylon, By Value, 2019H-2029F (USD MILLION & CAGR)
- Figure 108: Asia Pacific Interlining Fabric Market, By Other Material, By Value, 2019H-2029F (USD MILLION & CAGR)
- Figure 109: Asia Pacific Interlining Fabric Market, By Clothing, By Value, 2019H-2029F (USD MILLION & CAGR)
- Figure 110: Asia Pacific Interlining Fabric Market, By Bags, By Value, 2019H-2029F (USD MILLION & CAGR)
- Figure 111: Asia Pacific Interlining Fabric Market, By Shoes, By Value, 2019H-2029F (USD MILLION & CAGR)
- Figure 112: Asia Pacific Interlining Fabric Market, By Others Applications, By Value, 2019H-2029F (USD MILLION & CAGR)
- Figure 113: China Interlining Fabric Market, By Value, 2019-2029 (USD MILLION & CAGR)
- Figure 114: China Interlining Fabric Market Value, By Material, 2022 (USD Million)
- Figure 115: China Interlining Fabric Market Share, By Type, By Value, 2022 (%)
- Figure 116: China Interlining Fabric Market Share, By Material, By Value, 2022 (%)
- Figure 117: China Interlining Fabric Market Share, By Applications, 2022 (%)
- Figure 118: India Interlining Fabric Market, By Value, 2019-2029 (USD MILLION & CAGR)
- Figure 119: India Interlining Fabric Market Value, By Material, 2022 (USD Million)
- Figure 120: India Interlining Fabric Market Share, By Type, By Value, 2022 (%)
- Figure 121: India Interlining Fabric Market Share, By Material, By Value, 2022 (%)
- Figure 122: India Interlining Fabric Market Share, By Applications, 2022 (%)
- Figure 123: Japan Interlining Fabric Market, By Value, 2019-2029 (USD MILLION & CAGR)
- Figure 124: Japan Interlining Fabric Market Value, By Material, 2022 (USD Million)
- Figure 125: Japan Interlining Fabric Market Share, By Type, By Value, 2022 (%)
- Figure 126: Japan Interlining Fabric Market Share, By Material, By Value, 2022 (%)
- Figure 127: Japan Interlining Fabric Market Share, By Applications, 2022 (%)
- Figure 128: South Korea Interlining Fabric Market, By Value, 2019-2029 (USD MILLION & CAGR)
- Figure 129: South Korea Interlining Fabric Market Value, By Material, 2022 (USD Million)
- Figure 130: South Korea Interlining Fabric Market Share, By Type, By Value, 2022 (%)
- Figure 131: South Korea Interlining Fabric Market Share, By Material, By Value, 2022 (%)
- Figure 132: South Korea Interlining Fabric Market Share, By Applications, 2022 (%)
- Figure 133: Rest of Asia Pacific Interlining Fabric Market, By Value, 2019-2029 (USD MILLION & CAGR)
- Figure 134: Rest of Asia Pacific Interlining Fabric Market Value, By Material, 2022 (USD Million)
- Figure 135: Rest of Asia Pacific Interlining Fabric Market Share, By Type, By Value, 2022 (%)
- Figure 136: Rest of Asia Pacific Interlining Fabric Market Share, By Material, By Value, 2022 (%)
- Figure 137: Rest of Asia Pacific Interlining Fabric Market Share, By Applications, 2022 (%)
- Figure 138: Middle East & Africa Interlining Fabric Market Size, By Value, 2019H-2029F (USD Million)
- Figure 139: Middle East & Africa Interlining Fabric Market Share, By Type, 2022 (%)
- Figure 140: Middle East & Africa Interlining Fabric Market Size, By Volume, 2019H-2022A (Million sq. mtr.)
- Figure 141: Middle East & Africa Interlining Fabric Market Size, By Volume, 2023E-2029F (Million sq. mtr.)
- Figure 142: Price of Interlining Fabric in Middle East & Africa, 2019H-2029F (USD/ Sq. mtr.)
- Figure 143: Middle East & Africa Interlining Fabric Market, By Fusible Interlining, By Value, 2019H-2029F (USD MILLION & CAGR)
- Figure 144: Middle East & Africa Interlining Fabric Market, By Non-Fusible Interlining, By Value, 2019H-2029F (USD MILLION & CAGR)
- Figure 145: Middle East & Africa Interlining Fabric Market, By Polyester, By Value, 2019H-2029F (USD MILLION & CAGR)
- Figure 146: Middle East & Africa Interlining Fabric Market, By Cotton, By Value, 2019H-2029F (USD MILLION & CAGR)
- Figure 147: Middle East & Africa Interlining Fabric Market, By Nylon, By Value, 2019H-2029F (USD MILLION & CAGR)
- Figure 148: Middle East & Africa Interlining Fabric Market, By Others, By Value, 2019H-2029F (USD MILLION & CAGR)
- Figure 149: Middle East & Africa Interlining Fabric Market, By Clothing, By Value, 2019H-2029F (USD MILLION & CAGR)
- Figure 150: Middle East & Africa Interlining Fabric Market, By Bags, By Value, 2019H-2029F (USD MILLION & CAGR)
- Figure 151: Middle East & Africa Interlining Fabric Market, By Shoes, By Value, 2019H-2029F (USD MILLION & CAGR)
- Figure 152: Middle East & Africa Interlining Fabric Market, By Clothing, By Value, 2019H-2029F (USD MILLION & CAGR)
- Figure 153: Global Impact of Drivers and Restraints
- Figure 154: Market Share of Prominent Companies of Interlining Fabric Market, 2021 (%)
- Figure 155: Chargeurs Revenues, 2020-2022 (USD Million)
- Figure 156: Chargeurs Revenues, By Geographic Segments, 2022 (%)
- Figure 157: Chargeurs Revenues , By Business Segments, 2022 (%)
- Figure 158: Freudenberg Revenues, 2020-2022 (USD Million)
- Figure 159: Freudenberg Revenues, By Geographic Segments, 2022 (%)
- Figure 15 Freudenberg Revenues , By Geographic Segments, 2021 (%)
List of Tables
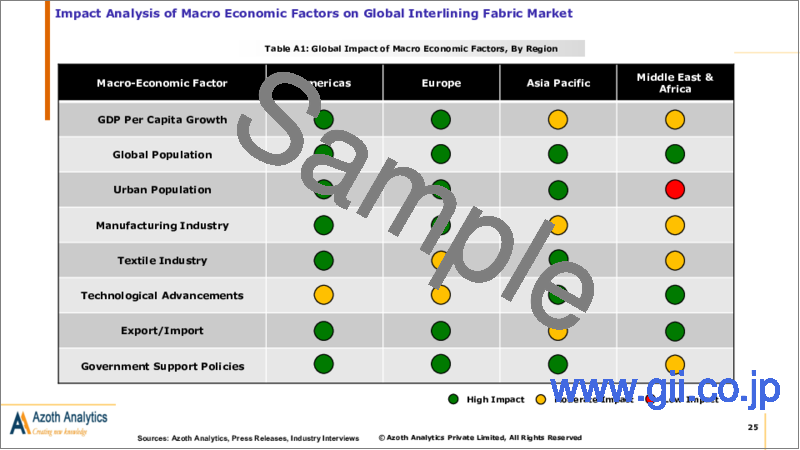
Table A1: Global Impact of Macro Economic Factors, By Region
Table A2: Top 10 Largest Textile Producing Countries, 2020
Table A3: United States Interlining Fabric Market, By Type, By Value, 2019-2022 (USD Million)
Table A4: United States Interlining Fabric Market, By Type, By Value, 2024-2029 (USD Million)
Table A5: United States Interlining Fabric Market, By Material, By Value, 2019-2022 (USD Million)
Table A6: United States Interlining Fabric Market, By Material, By Value, 2024-2029 (USD Million)
Table A7: United States Interlining Fabric Market, By Applications, By Value, 2019-2022 (USD Million)
Table A8: United States Interlining Fabric Market, By Applications, By Value, 2024-2029 (USD Million)
Table A9: Canada Interlining Fabric Market, By Type, By Value, 2019-2022 (USD Million)
Table A10: Canada Interlining Fabric Market, By Type, By Value, 2024-2029 (USD Million)
Table A11: Canada Interlining Fabric Market, By Material, By Value, 2019-2022 (USD Million)
Table A12: Canada Interlining Fabric Market, By Material, By Value, 2024-2029 (USD Million)
Table A13: Canada Interlining Fabric Market, By Applications, By Value, 2019-2022 (USD Million)
Table A14: Canada Interlining Fabric Market, By Applications, By Value, 2024-2029 (USD Million)
Table A15: Brazil Interlining Fabric Market, By Type, By Value, 2019-2022 (USD Million)
Table A16: Brazil Interlining Fabric Market, By Type, By Value, 2024-2029 (USD Million)
Table A17: Brazil Interlining Fabric Market, By Material, By Value, 2019-2022 (USD Million)
Table A18: Brazil Interlining Fabric Market, By Material, By Value, 2024-2029 (USD Million)
Table A19: Brazil Interlining Fabric Market, By Applications, By Value, 2019-2022 (USD Million)
Table A20: Brazil Interlining Fabric Market, By Applications, By Value, 2024-2029 (USD Million)
Table A21: Rest of Americas Interlining Fabric Market, By Type, By Value, 2019-2022 (USD Million)
Table A22: Rest of Americas Interlining Fabric Market, By Type, By Value, 2024-2029 (USD Million)
Table A23: Rest of Americas Interlining Fabric Market, By Material, By Value, 2019-2022 (USD Million)
Table A24: Rest of Americas Interlining Fabric Market, By Material, By Value, 2024-2029 (USD Million)
Table A25: Rest of Americas Interlining Fabric Market, By Applications, By Value, 2019-2022 (USD Million)
Table A26: Rest of Americas Interlining Fabric Market, By Applications, By Value, 2024-2029 (USD Million)
Table A27: United Kingdom Interlining Fabric Market, By Type, By Value, 2019-2022 (USD Million)
Table A28: United Kingdom Interlining Fabric Market, By Type, By Value, 2024-2029 (USD Million)
Table A29: United Kingdom Interlining Fabric Market, By Material, By Value, 2019-2022 (USD Million)
Table A30: United Kingdom Interlining Fabric Market, By Material, By Value, 2024-2029 (USD Million)
Table A31: United Kingdom Interlining Fabric Market, By Applications, By Value, 2019-2022 (USD Million)
Table A32: United Kingdom Interlining Fabric Market, By Applications, By Value, 2024-2029 (USD Million)
Table A33: Germany Interlining Fabric Market, By Type, By Value, 2019-2022 (USD Million)
Table A34: Germany Interlining Fabric Market, By Type, By Value, 2024-2029 (USD Million)
Table A35: Germany Interlining Fabric Market, By Material, By Value, 2019-2022 (USD Million)
Table A36: Germany Interlining Fabric Market, By Material, By Value, 2024-2029 (USD Million)
Table A37: Germany Interlining Fabric Market, By Applications, By Value, 2019-2022 (USD Million)
Table A38: Germany Interlining Fabric Market, By Applications, By Value, 2024-2029 (USD Million)
Table A39: France Interlining Fabric Market, By Type, By Value, 2019-2022 (USD Million)
Table A40: France Interlining Fabric Market, By Type, By Value, 2024-2029 (USD Million)
Table A41: France Interlining Fabric Market, By Material, By Value, 2019-2022 (USD Million)
Table A42: France Interlining Fabric Market, By Material, By Value, 2024-2029 (USD Million)
Table A43: France Interlining Fabric Market, By Applications, By Value, 2019-2022 (USD Million)
Table A44: France Interlining Fabric Market, By Applications, By Value, 2024-2029 (USD Million)
Table A45: Rest of Europe Interlining Fabric Market, By Type, By Value, 2019-2022 (USD Million)
Table A46: Rest of Europe Interlining Fabric Market, By Type, By Value, 2024-2029 (USD Million)
Table A47: Rest of Europe Interlining Fabric Market, By Material, By Value, 2019-2022 (USD Million)
Table A48: Rest of Europe Interlining Fabric Market, By Material, By Value, 2024-2029 (USD Million)
Table A49: Rest of Europe Interlining Fabric Market, By Applications, By Value, 2019-2022 (USD Million)
Table A50: Rest of Europe Interlining Fabric Market, By Applications, By Value, 2024-2029 (USD Million)
Table A51: China Interlining Fabric Market, By Type, By Value, 2019-2022 (USD Million)
Table A52: China Interlining Fabric Market, By Type, By Value, 2024-2029 (USD Million)
Table A53: China Interlining Fabric Market, By Material, By Value, 2019-2022 (USD Million)
Table A54: China Interlining Fabric Market, By Material, By Value, 2024-2029 (USD Million)
Table A55: China Interlining Fabric Market, By Applications, By Value, 2019-2022 (USD Million)
Table A56: China Interlining Fabric Market, By Applications, By Value, 2024-2029 (USD Million)
Table A57: India Interlining Fabric Market, By Type, By Value, 2019-2022 (USD Million)
Table A58: India Interlining Fabric Market, By Type, By Value, 2024-2029 (USD Million)
Table A59: India Interlining Fabric Market, By Material, By Value, 2019-2022 (USD Million)
Table A60: India Interlining Fabric Market, By Material, By Value, 2024-2029 (USD Million)
Table A61: India Interlining Fabric Market, By Applications, By Value, 2019-2022 (USD Million)
Table A62: India Interlining Fabric Market, By Applications, By Value, 2024-2029 (USD Million)
Table A63: Japan Interlining Fabric Market, By Type, By Value, 2019-2022 (USD Million)
Table A64: Japan Interlining Fabric Market, By Type, By Value, 2024-2029 (USD Million)
Table A65: Japan Interlining Fabric Market, By Material, By Value, 2019-2022 (USD Million)
Table A66: Japan Interlining Fabric Market, By Material, By Value, 2024-2029 (USD Million)
Table A67: Japan Interlining Fabric Market, By Applications, By Value, 2019-2022 (USD Million)
Table A68: Japan Interlining Fabric Market, By Applications, By Value, 2024-2029 (USD Million)
Table A69: South Korea Interlining Fabric Market, By Type, By Value, 2019-2022 (USD Million)
Table A70: South Korea Interlining Fabric Market, By Type, By Value, 2024-2029 (USD Million)
Table A71: South Korea Interlining Fabric Market, By Material, By Value, 2019-2022 (USD Million)
Table A72: South Korea Interlining Fabric Market, By Material, By Value, 2024-2029 (USD Million)
Table A73: South Korea Interlining Fabric Market, By Applications, By Value, 2019-2022 (USD Million)
Table A74: South Korea Interlining Fabric Market, By Applications, By Value, 2024-2029 (USD Million)
Table A75: Rest of Asia Pacific Interlining Fabric Market Market, By Type, By Value, 2019-2022 (USD Million)
Table A76: Rest of Asia Pacific Interlining Fabric Market, By Type, By Value, 2024-2029 (USD Million)
Table A77: Rest of Asia Pacific Interlining Fabric Market Market, By Material, By Value, 2019-2022 (USD Million)
Table A78: Rest of Asia Pacific Interlining Fabric Market Market, By Material, By Value, 2024-2029 (USD Million)
Table A79: Rest of Asia Pacific Interlining Fabric Market Market, By Applications, By Value, 2019-2022 (USD Million)
Table A80: Rest of Asia Pacific Interlining Fabric Market Market, By Applications, By Value, 2024-2029 (USD Million)
Table A81: Chargeurs Key Financials, 2020-2022
Table A82: Freudenberg Key Financials, 2020-2022
Executive Summary
Azoth Analytics has released a research report titled "Global Interlining Fabric Market (2023 Edition)" which provides a complete analysis of the Global Interlining Fabric industry in terms of market segmentation by Type (Fusible Interlining, Non-Fusible Interlining), Material (Polyester, Cotton, Nylon, Others) and Applications (Clothing, Bags, Shoes, Others) for the historical period of 2019-2022, the estimates of 2023 and the forecast period of 2024-2029.
The research report covers a detailed analysis of the regions (Americas, Europe, APAC, Middle East Africa) and 10 countries (United States, Canada, Brazil, United Kingdom, Germany, France, China, India, Japan, South Korea). Additionally, the research report presents data including market size, yearly growth & potential analysis, the competitive study of market players, investment opportunities and demand forecast.
The Global Interlining Fabric is expected to generate ~ USD 4 billion by the end of 2029, up from USD 2.9 billion in 2022. The interlining fabric market is witnessing steady growth, driven by the expanding textile and apparel industry, increasing demand for functional textiles, and technological advancements in interlining fabric manufacturing. This exclusive study delves into the current state of the interlining fabric market, highlights key trends shaping its growth, explores emerging opportunities, and discusses the challenges faced by industries.
The technological advancements are driving innovation in the interlining fabric manufacturing including advanced adhesive technologies, bonding techniques, and automation in production processes. The report also discusses the impact of digitalization and smart manufacturing on the interlining fabric market.
Advances in fiber production technology have led to the development of eco-friendly and sustainable fibers. For example, organic cotton, hemp, bamboo, and recycled polyester are gaining popularity as sustainable alternatives to conventional fabrics. These fibers require fewer resources, emit fewer greenhouse gases, and have a lower environmental impact compared to traditional synthetic or non-sustainable materials.
As a result, sustainability and eco-friendly fabric products are experiencing significant growth. This trend is expected to continue as consumers increasingly prioritize sustainability, and the textile industry embraces more sustainable practices and innovations. The integration of sustainability into fabric production is reshaping the industry and driving the development of a more environmentally conscious and socially responsible fashion ecosystem.
Scope of the Report:
- The report analyses the Interlining Fabric Market by Value (USD Million).
- The report analyses the Interlining Fabric Market by Volume (Million sq.mt.).
- The report presents the analysis of the Interlining Fabric Market for the historical period of 2019-2022, the estimated year 2023, and the forecast period of 2024-2029.
- The report analyses the Interlining Fabric Market by Type (Fusible Interlining & Non-Fusible Interlining).
- The report analyses the Interlining Fabric Market by Material (Polyester, Cotton, Nylon, Others).
- The report analyses the Interlining Fabric Market by Applications (Clothing, Shoes, Bags, Others).
- The key insights of the report have been presented through the frameworks of SWOT and Porter's Five Forces Analysis. Also, the attractiveness of the market has been presented by region, type, material, and applications.
- Also, the major opportunities, trends, drivers, and challenges of the industry have been analysed in the report.
- The report tracks competitive developments, strategies, mergers and acquisitions, and new product development. The companies analysed in the report include Chargeurs, Freudenberg, Veratex Lining Ltd., H&V, Block Bindings and Lining Ltd., Edmund Bell & Company, Kufner Holding GmbH, NH Textil Group, Wendler Interlining Group, Vilene Company.
Table of Contents
1. Market Background
- 1.1 Scope and Product Outlook
- 1.2 Executive Summary
- 1.3 Research Methodology
2. Strategic Recommendations
- 2.1 Focus on Offering Customization
- 2.2 Collaborate with Fashion Designers & Manufacturers
3. Global Interlining Fabric Market: Historic and Forecast
- 3.1 Impact Analysis of Macro Economic Factors on Interlining Fabric Market (2019-2029)
- 3.2 Top 10 Largest Textile Producing Countries
- 3.3 Investment in Textile & Clothing Manufacturing Industry in European Region
- 3.4 Global Interlining Fabric Market: Dashboard
- 3.5 Global Interlining Fabric Market: Market Size and CAGR, 2019-2029 (USD MILLION & CAGR)
- 3.6 Global Interlining Fabric Market: Market Size and CAGR, 2019-2029 (Million sq. mtr.)
- 3.7 Average Selling Price Assessment of Interlining Fabric
- 3.8 Global Impact of COVID-19 on Interlining Fabric Market
- 3.9 Global Interlining fabric Market Segmentation: By Type
- 3.9.1 Global Interlining Fabric Market, By Type Overview
- 3.9.2 Global Interlining Fabric Market Size, By Fusible Interlining, By Value, 2019H-2029F (USD MILLION & CAGR)
- 3.9.3 Global Interlining Fabric Market Size, By Non-Fusible Interlining, By Value, 2019H-2029F (USD MILLION & CAGR)
- 3.10 Global Interlining Fabric Market Segmentation: By Material
- 3.10.1 Global Interlining Fabric Market, By Material Overview
- 3.10.2 Global Interlining Fabric Market Size, By Polyester, By Value, 2019H-2029F (USD MILLION & CAGR)
- 3.10.3 Global Interlining Fabric Market Size, By Cotton, By Value, 2019H-2029F (USD MILLION & CAGR)
- 3.10.4 Global Interlining Fabric Market Size, By Nylon, By Value, 2019H-2029F (USD MILLION & CAGR)
- 3.10.5 Global Interlining Fabric Market Size, By Others, By Value, 2019H-2029F (USD MILLION & CAGR)
- 3.11 Global Interlining Fabric Market Segmentation : By Applications
- 3.11.1 Global Interlining Fabric Market, By Applications Overview
- 3.11.2 Global Interlining Fabric Market Size, By Clothing, By Value, 2019H-2029F (USD MILLION & CAGR)
- 3.11.3 Global Interlining Fabric Market Size, By Bags, By Value, 2019H-2029F (USD MILLION & CAGR)
- 3.11.4 Global Interlining Fabric Market Size, By Shoes, By Value, 2019H-2029F (USD MILLION & CAGR)
- 3.11.5 Global Interlining Fabric Market Size, By Others, By Value, 2019H-2029F (USD MILLION & CAGR)
4. Interlining Fabric Market, Regional Analysis
- 4.1 Regional Coverage of the Study
- 4.2 Regional Snapshot
5. Americas Interlining Fabric Market: Historic and Forecast (2019-2029)
- 5.1 Americas Interlining Fabric Market: Snapshot
- 5.2 Americas Interlining Fabric Market: Market Size and CAGR, 2019-2029 (USD MILLION & CAGR)
- 5.3 Americas Interlining Fabric Market: Market Size and CAGR, 2019-2029 (Million Sq. mtr.)
- 5.4 Average Selling Price Assessment of Interlining Fabric in Americas
- 5.5 Americas Interlining Fabric Market: Key Factors
- 5.6 Americas Interlining Fabric Market Segmentation: By Type
- 5.6.1 Americas Interlining Fabric Market, By Type Overview
- 5.6.2 Americas Interlining Fabric Market Size, By Fusible Interlining, By Value, 2019H-2029F (USD MILLION & CAGR)
- 5.6.3 Americas Interlining Fabric Market Size, By Non-Fusible Interlining, By Value, 2019H-2029F (USD MILLION & CAGR)
- 5.7 Americas Interlining Fabric Market Segmentation: By Material
- 5.7.1 Americas Interlining Fabric Market, By Material Overview
- 5.7.2 Americas Interlining Fabric Market Size, By Polyester, By Value, 2019H-2029F (USD MILLION & CAGR)
- 5.7.3 Americas Interlining Fabric Market Size, By Cotton, By Value, 2019H-2029F (USD MILLION & CAGR)
- 5.7.4 Americas Interlining Fabric Market Size, By Nylon, By Value, 2019H-2029F (USD MILLION & CAGR)
- 5.7.5 Americas Interlining Fabric Market Size, By Others, By Value, 2019H-2029F (USD MILLION & CAGR)
- 5.8 Americas Interlining Fabric Market Segmentation: By Applications
- 5.8.1 Americas Interlining Fabric Market, By Applications Overview
- 5.8.2 Americas Interlining Fabric Market Size, By Clothing, By Value, 2019H-2029F (USD Million & CAGR)
- 5.8.3 Americas Interlining Fabric Market Size, By Bags, By Value, 2019H-2029F (USD Million & CAGR)
- 5.8.4 Americas Interlining Fabric Market Size, By Others, By Value, 2019H-2029F (USD Million & CAGR)
- 5.9 Americas Interlining Fabric Market Segmentation: By Country
- 5.9.1 United States Interlining Fabric Market: Market Size and CAGR, 2019-2029 (USD Million & CAGR)
- 5.9.1.1 United States Interlining Fabric Market, By Type
- 5.9.1.2 United States Interlining Fabric Market, By Material
- 5.9.1.3 United States Interlining Fabric Market, By Applications
- 5.9.2 Canada Interlining Fabric Market: Market Size and CAGR, 2019-2029 (USD MILLION & CAGR)
- 5.9.2.1 Canada Interlining Fabric Market, By Type
- 5.9.2.2 Canada Interlining Fabric Market, By Material
- 5.9.2.3 Canada Interlining Fabric Market, By Applications
- 5.9.3 Brazil Interlining Fabric Market: Market Size and CAGR, 2019-2029 (USD MILLION & CAGR)
- 5.9.3.1 Brazil Interlining Fabric Market, By Type
- 5.9.3.2 Brazil Interlining Fabric Market, By Material
- 5.9.3.3 Brazil Interlining Fabric Market, By Applications
- 5.9.4 Rest of Americas Interlining Fabric Market: Market Size and CAGR, 2019-2029 (USD MILLION & CAGR)
- 5.9.4.1 Rest of Americas Interlining Fabric Market, By Type
- 5.9.4.2 Rest of Americas Interlining Fabric Market, By Material
- 5.9.4.3 Rest of Americas Interlining Fabric Market, By Applications
- 5.9.1 United States Interlining Fabric Market: Market Size and CAGR, 2019-2029 (USD Million & CAGR)
6. Europe Interlining Fabric Market: Historic and Forecast (2019-2029)
- 6.1 Europe Interlining Fabric Market: Snapshot
- 6.2 Europe Interlining Fabric Market: Market Size and CAGR, 2019-2029 (USD MILLION & CAGR)
- 6.3 Europe Interlining Fabric Market: Market Size and CAGR, 2019-2029 (Million sq. mtr.)
- 6.4 Average Selling Price Assessment of Interlining Fabric in Europe
- 6.5 Europe Interlining Fabric Market: Key Factors
- 6.6 Europe Interlining Fabric Market Segmentation: By Type
- 6.6.1 Europe Interlining Fabric Market, By Type Overview
- 6.6.2 Europe Interlining Fabric Market Size, By Fusible Interlining, By Value, 2019H-2029F (USD MILLION & CAGR)
- 6.6.3 Europe Interlining Fabric Market Size, By Non-Fusible Interlining, By Value, 2019H-2029F (USD MILLION & CAGR)
- 6.7 Europe Interlining Fabric Market Segmentation: By Material
- 6.7.1 Europe Interlining Fabric Market, By Material Overview
- 6.7.2 Europe Interlining Fabric Market Size, By Polyester, By Value, 2019H-2029F (USD MILLION & CAGR)
- 6.7.3 Europe Interlining Fabric Market Size, By Cotton, By Value, 2019H-2029F (USD MILLION & CAGR)
- 6.7.4 Europe Interlining Fabric Market Size, By Nylon, By Value, 2019H-2029F (USD MILLION & CAGR)
- 6.7.5 Europe Interlining Fabric Market Size, By Others, By Value, 2019H-2029F (USD MILLION & CAGR)
- 6.8 Europe Interlining Fabric Market Segmentation: By Applications
- 6.8.1 Europe Interlining Fabric Market, By Applications Overview
- 6.8.2 Europe Interlining Fabric Market Size, By Clothing, By Value, 2019H-2029F (USD MILLION & CAGR)
- 6.8.3 Europe Interlining Fabric Market Size, By Bags, By Value, 2019H-2029F (USD MILLION & CAGR)
- 6.8.4 Europe Interlining Fabric Market Size, By Shoes, By Value, 2019H-2029F (USD MILLION & CAGR)
- 6.8.5 Europe Interlining Fabric Market Size, By Others, By Value, 2019H-2029F (USD MILLION & CAGR)
- 6.9 Europe Interlining Fabric Market Segmentation: By Country
- 6.9.1 United Kingdom Interlining Fabric Market: Market Size and CAGR, 2019-2029 (USD MILLION & CAGR)
- 6.9.1.1 United Kingdom Interlining Fabric Market, By Type
- 6.9.1.2 United Kingdom Interlining Fabric Market, By Material
- 6.9.1.3 United Kingdom Interlining Fabric Market, By Applications
- 6.9.2 Germany Interlining Fabric Market: Market Size and CAGR, 2019-2029 (USD Million & CAGR)
- 6.9.2.1 Germany Interlining Fabric Market, By Type
- 6.9.2.3 Germany Interlining Fabric Market, By Material
- 6.9.2.4 Germany Interlining Fabric Market, By Applications
- 6.9.3 France Interlining Fabric Market: Market Size and CAGR, 2019-2029 (USD MILLION & CAGR)
- 6.9.3.1 France Interlining Fabric Market, By Type
- 6.9.3.2 France Interlining Fabric Market, By Material
- 6.9.3.3 France Interlining Fabric Market, By Applications
- 6.9.4 Rest of Europe Interlining Fabric Market: Market Size and CAGR, 2019-2029 (USD MILLION & CAGR)
- 6.9.4.1 Rest of Europe Interlining Fabric Market, By Type
- 6.9.4.2 Rest of Europe Interlining Fabric Market, By Material
- 6.9.4.3 Rest of Europe Interlining Fabric Market, By Applications
- 6.9.1 United Kingdom Interlining Fabric Market: Market Size and CAGR, 2019-2029 (USD MILLION & CAGR)
7. Asia Pacific Interlining Fabric Market: Historic and Forecast (2019-2029)
- 7.1 Asia Pacific Interlining Fabric Market: Snapshot
- 7.2 Asia Pacific Interlining Fabric Market: Market Size and CAGR, 2019-2029 (USD MILLION & CAGR)
- 7.3 Asia Pacific Interlining Fabric Market: Market Size and CAGR, 2019-2029 (Million sq. mtr.)
- 7.4 Average Selling Price Assessment of Interlining Fabric in Asia Pacific
- 7.5 Asia Pacific Interlining Fabric Market: Key Factors
- 7.6 Asia Pacific Interlining Fabric Market Segmentation: By Type
- 7.6.1 Asia Pacific Interlining Fabric Market, By Type Overview
- 7.6.2 Asia Pacific Interlining Fabric Market Size, By Fusible Interlining, By Value, 2019H-2029F (USD MILLION & CAGR)
- 7.6.3 Asia Pacific Interlining Fabric Market Size, By Non-Fusible Interlining, By Value, 2019H-2029F (USD MILLION & CAGR)
- 7.7 Asia Pacific Interlining Fabric Market Segmentation: By Material
- 7.7.1 Asia Pacific Interlining Fabric Market, By Material Overview
- 7.7.2 Asia Pacific Interlining Fabric Market Size, By Polyester, By Value, 2019H-2029F (USD MILLION & CAGR)
- 7.7.3 Asia Pacific Interlining Fabric Market Size, By Cotton, By Value, 2019H-2029F (USD MILLION & CAGR)
- 7.7.4 Asia Pacific Interlining Fabric Market Size, By Nylon, By Value, 2019H-2029F (USD MILLION & CAGR)
- 7.7.4 Asia Pacific Interlining Fabric Market Size, By Others, By Value, 2019H-2029F (USD MILLION & CAGR)
- 7.8 Asia Pacific Interlining Fabric Market Segmentation: By Applications
- 7.8.1 Asia Pacific Interlining Fabric Market, By Applications Overview
- 7.8.2 Asia Pacific Interlining Fabric Market Size, By Clothing, By Value, 2019H-2029F (USD MILLION & CAGR)
- 7.8.3 Asia Pacific Interlining Fabric Market Size, By Bags, By Value, 2019H-2029F (USD MILLION & CAGR)
- 7.8.3 Asia Pacific Interlining Fabric Market Size, By Shoes, By Value, 2019H-2029F (USD MILLION & CAGR)
- 7.8.3 Asia Pacific Interlining Fabric Market Size, By Others, By Value, 2019H-2029F (USD MILLION & CAGR)
- 7.9 Asia Pacific Interlining Fabric Market Segmentation: By Country
- 7.9.1 China Interlining Fabric Market: Market Size and CAGR, 2019-2029 (USD MILLION & CAGR)
- 7.9.1.1 China Interlining Fabric Market, By Type
- 7.9.1.2 China Interlining Fabric Market, By Material
- 7.9.1.3 China Interlining Fabric Market, By Applications
- 7.9.2 India Interlining Fabric Market: Market Size and CAGR, 2019-2029 (USD Million & CAGR)
- 7.9.2.1 India Interlining Fabric Market, By Type
- 7.9.2.2 India Interlining Fabric Market, By Material
- 7.9.2.3 India Interlining Fabric Market, By Applications
- 7.9.3 Japan Interlining Fabric Market: Market Size and CAGR, 2019-2029 (USD MILLION & CAGR)
- 7.9.3.1 Japan Interlining Fabric Market, By Type
- 7.9.3.2 Japan Interlining Fabric Market, By Material
- 7.9.3.3 Japan Interlining Fabric Market, By Applications
- 7.9.4 South Korea Interlining Fabric Market: Market Size and CAGR, 2019-2029 (USD MILLION & CAGR)
- 7.9.4.1 South Korea Interlining Fabric Market, By Type
- 7.9.4.2 South Korea Interlining Fabric Market, By Material
- 7.9.4.3 South Korea Interlining Fabric Market, By Applications
- 7.9.5 Rest of APAC Interlining Fabric Market: Market Size and CAGR, 2019-2029 (USD MILLION & CAGR)
- 7.9.5.1 Rest of APAC Interlining Fabric Market, By Type
- 7.9.5.2 Rest of APAC Interlining Fabric Market, By Material
- 7.9.5.3 Rest of APAC Interlining Fabric Market, By Applications
- 7.9.1 China Interlining Fabric Market: Market Size and CAGR, 2019-2029 (USD MILLION & CAGR)
8. Middle East & Africa Interlining Fabric Market: Historic and Forecast (2019-2029)
- 8.1 Middle East & Africa Interlining Fabric Market: Snapshot
- 8.2 Middle East & Africa Interlining Fabric Market: Market Size and CAGR, 2019-2029 (USD MILLION & CAGR)
- 8.3 Middle East & Africa Interlining Fabric Market: Market Size and CAGR, 2019-2029 (USD MILLION & CAGR)
- 8.4 Average Selling Price Assessment of Interlining Fabric in Middle East & Africa
- 8.5 Middle East & Africa Interlining Fabric Market: Key Factors
- 8.6 Middle East & Africa Interlining Fabric Market Segmentation: By Type
- 8.6.1 Middle East & Africa Interlining Fabric Market, By Type Overview
- 8.6.2 Middle East & Africa Interlining Fabric Market Size, By Fusible Interlining, By Value, 2019H-2029F (USD MILLION & CAGR)
- 8.6.3 Middle East & Africa Interlining Fabric Market Size, By Non-Fusible Interlining, By Value, 2019H-2029F (USD MILLION & CAGR)
- 8.7 Middle East & Africa Interlining Fabric Market Segmentation: By Material
- 8.7.1 Middle East & Africa Interlining Fabric Market, By Material Overview
- 8.7.2 Middle East & Africa Interlining Fabric Market Size, By Polyester, By Value, 2019H-2029F (USD MILLION & CAGR)
- 8.7.3 Middle East & Africa Interlining Fabric Market Size, By Cotton, By Value, 2019H-2029F (USD MILLION & CAGR)
- 8.7.4 Middle East & Africa Interlining Fabric Market Size, By Nylon, By Value, 2019H-2029F (USD MILLION & CAGR)
- 8.7.4 Middle East & Africa Interlining Fabric Market Size, By Others, By Value, 2019H-2029F (USD MILLION & CAGR)
- 8.8 Middle East & Africa Interlining Fabric Market Segmentation: By Applications
- 8.8.1 Middle East & Africa Interlining Fabric Market, By Applications Overview
- 8.8.2 Middle East & Africa Interlining Fabric Market Size, By Clothing, By Value, 2019H-2029F (USD MILLION & CAGR)
- 8.8.3 Middle East & Africa Interlining Fabric Market Size, By Bags, By Value, 2019H-2029F (USD MILLION & CAGR)
- 8.8.4 Middle East & Africa Interlining Fabric Market Size, By Shoes, By Value, 2019H-2029F (USD MILLION & CAGR)
- 8.8.5 Middle East & Africa Interlining Fabric Market Size, By Others, By Value, 2019H-2029F (USD MILLION & CAGR)
9. Market Dynamics
- 9.1 Impact assessment of Market Dynamics on INTERLINING FABRIC Market
- 9.2 Drivers
- 9.3 Restraints
- 9.4 Trends
10. Industry Ecosystem Analysis
- 10.1 Macro-Economic Factor Assessment
- 10.2 Value Chain Analysis
- 10.3 Porter Analysis
11. Competitive Positioning
- 11.1 Companies' Product Positioning
- 11.2 Market Position Matrix
- 11.3 Market Share Analysis of Interlining Fabric Market
- 11.4 Company Profiles
- 11.4.1 Chargeurs
- 11.4.2 Freudenberg
- 11.4.3 Wendler Interlining Group
- 11.4.4 Kufner Holding GmbH
- 11.4.5 Veratex Lining Ltd.
- 11.4.6 Edmund Bell & Company
- 11.4.7 Block Bindings and Interlinings Ltd.
- 11.4.8 H&V
- 11.4.9 NH Textil Group
- 11.4.10 Japan Vilene Company