|
|
市場調査レポート
商品コード
1229127
化粧品受託製造の世界市場- 製品別、製品形態別、化粧品タイプ別、地域別、国別の分析:市場規模、考察、競合、COVID-19の影響と予測Global Cosmetics Contract Manufacturing Market - Analysis By Products, Product Form, Cosmetic Type, By Region, By Country: Market Size, Insights, Competition, Covid-19 Impact and Forecast |
||||||
|
|
|||||||


| 化粧品受託製造の世界市場- 製品別、製品形態別、化粧品タイプ別、地域別、国別の分析:市場規模、考察、競合、COVID-19の影響と予測 |
|
出版日: 2023年02月28日
発行: Azoth Analytics
ページ情報: 英文 250 Pages
納期: 即納可能
|
- 全表示
- 概要
- 図表
- 目次
世界の化粧品受託製造の市場規模は、2021年に165億5,000万米ドルとなりました。同市場は、2023年~2028年の予測期間中に4.5%のCAGRで拡大すると予測されています。
当レポートでは、世界の化粧品受託製造市場について調査し、市場の概要とともに、製品別、製品形態別、化粧品タイプ別、地域別の動向、および市場に参入する企業のプロファイルなどを提供しています。
目次
第1章 市場の背景
第2章 戦略的推奨事項
第3章 世界の化粧品受託製造市場:実績および予測(2018年~2028年)
- 化粧品受託製造市場におけるマクロ経済要因の影響分析
- 受託製造業者別研究開発部門への投資
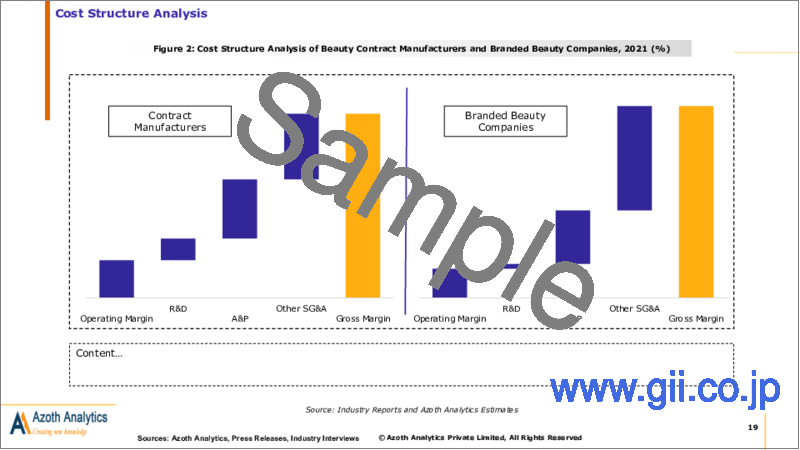
- コスト構造分析
- 世界の化粧品受託製造市場:ダッシュボード
- 世界の化粧品受託製造市場:市場規模とCAGR、2018年~2028年(10億米ドル・CAGR)
- COVID-19の化粧品受託製造市場への影響
- 世界の化粧品受託製造市場セグメンテーション:製品別
- 世界の化粧品受託製造市場、製品別概要
- スキンケア
- ヘア・ボディケア
- メイクアップ・カラー化粧品
- その他
- 世界の化粧品受託製造市場セグメンテーション:製品形態別
- 世界の化粧品受託製造市場、製品形態別概要
- クリームおよびローション
- ゲル
- 液体および懸濁液
- その他
- 世界の化粧品受託製造市場セグメンテーション:化粧品タイプ別
- 化粧品の種類別の世界の化粧品受託製造市場の概要
- オーガニック
- 従来型
第4章 世界の化粧品受託製造市場、地域分析
- 調査対象地域
- 地域別スナップショット
第5章 南北アメリカの化粧品受託製造市場:実績および予測(2018年~2028年)
第6章 欧州の化粧品受託製造市場:実績および予測(2018年~2028年)
第7章 アジア太平洋の化粧品受託製造市場:実績および予測(2018年~2028年)
第8章 中東・アフリカの化粧品受託製造市場:実績および予測(2018年~2028年)
第9章 市場力学
第10章 産業エコシステム分析
- マクロ経済要因の評価
- バリューチェーン分析
- ポーター分析
第11章 競争上の位置付け
- 企業の製品ポジショニング
- 市場における位置づけマトリクス
- 化粧品受託製造市場のシェア分析
- 企業プロファイル
- KDC/ONE
- Intercos
- Tokiwa Corporation
- Kolmar Korea
- Oxygen Development
- Mana Products
- HSA Cosmetics
- Nox Bellcow Cosmetics
- Faber Castell Cosmetics
- Art Cosmetics
List of Figures
List of Figures
- Figure 1: R&D as a Percentage of Sales Across the Beauty and Ingredients Companies, 2021 (%)
- Figure 2: Cost Structure Analysis of Beauty Contract Manufacturers and Branded Beauty Companies, 2021 (%)
- Figure 3: Global Cosmetics Contract Manufacturing Market Size, By Value, 2018-2021 (USD Billion)
- Figure 4: Global Cosmetics Contract Manufacturing Market Size, By Value, 2022-2028 (USD Billion)
- Figure 5: Global Cosmetics Contract Manufacturing Market Share, By Products, 2021 (%)
- Figure 6: Global Cosmetics Contract Manufacturing Market Size, By Skincare, By Value, 2018H-2028F (USD Billion & CAGR)
- Figure 7: Global Cosmetics Contract Manufacturing Market Absolute Opportunity, By Skincare, 2018-2028 (USD Billion)
- Figure 8: Global Cosmetics Contract Manufacturing Market Size, By Hair & Body Care, By Value, 2018H-2028F (USD Billion & CAGR)
- Figure 9: Global Cosmetics Contract Manufacturing Market Absolute Opportunity, By Hair & Body Care, 2018-2028 (USD Billion)
- Figure 10: Global Cosmetics Contract Manufacturing Market Size, By Make-up and Color Cosmetics, By Value, 2018H-2028F (USD Billion & CAGR)
- Figure 11: Global Cosmetics Contract Manufacturing Market Absolute Opportunity, By Make-up and Color Cosmetics, 2018-2028 (USD Billion)
- Figure 12: Global Cosmetics Contract Manufacturing Market Size, By Other Products, By Value, 2018H-2028F (USD Billion & CAGR)
- Figure 13: Global Cosmetics Contract Manufacturing Market Absolute Opportunity, By Other Products, 2018-2028 (USD Billion)
- Figure 14: Global Cosmetics Contract Manufacturing Market Size, By Creams & Lotions, By Value, 2018H-2028F (USD Billion & CAGR)
- Figure 15: Global Cosmetics Contract Manufacturing Market Absolute Opportunity, By Creams & Lotions, 2018-2028 (USD Billion)
- Figure 16: Global Cosmetics Contract Manufacturing Market Size, By Gels, By Value, 2018H-2028F (USD Billion & CAGR)
- Figure 17: Global Cosmetics Contract Manufacturing Market Absolute Opportunity, By Gels, 2018-2028 (USD Billion)
- Figure 18: Global Cosmetics Contract Manufacturing Market Size, By Liquids & Suspensions, By Value, 2018H-2028F (USD Billion & CAGR)
- Figure 19: Global Cosmetics Contract Manufacturing Market Absolute Opportunity, By Liquids & Suspensions, 2018-2028 (USD Billion)
- Figure 20: Global Cosmetics Contract Manufacturing Market Size, By Other Product Forms, By Value, 2018H-2028F (USD Billion & CAGR)
- Figure 21: Global Cosmetics Contract Manufacturing Market Absolute Opportunity, By Other Product Forms, 2018-2028 (USD Billion)
- Figure 22: Global Cosmetics Contract Manufacturing Market Size, By Organic, By Value, 2018H-2028F (USD Billion & CAGR)
- Figure 23: Global Cosmetics Contract Manufacturing Market Absolute Opportunity, By Organic, 2018-2028 (USD Billion)
- Figure 24: Global Cosmetics Contract Manufacturing Market Size, By Conventional, By Value, 2018H-2028F (USD Billion & CAGR)
- Figure 25: Global Cosmetics Contract Manufacturing Market Absolute Opportunity, By Conventional, 2018-2028 (USD Billion)
- Figure 26: Americas Cosmetics Contract Manufacturing Market Size, By Value, 2018H-2028F (USD Billion)
- Figure 27: Americas Cosmetics Contract Manufacturing Market Share, By Products, 2021 (%)
- Figure 28: Americas Cosmetics Contract Manufacturing Market, By Skin Care, By Value, 2018H-2028F (USD Billion & CAGR)
- Figure 29: Americas Cosmetics Contract Manufacturing Market, By Hair & Body Care, By Value, 2018H-2028F (USD Billion & CAGR)
- Figure 30: Americas Cosmetics Contract Manufacturing Market, By Make-up and Color Cosmetics, By Value, 2018H-2028F (USD Billion & CAGR)
- Figure 31: Americas Cosmetics Contract Manufacturing Market, Other Products, By Value, 2018H-2028F (USD Billion & CAGR)
- Figure 32: Americas Cosmetics Contract Manufacturing Market, By Creams & Lotions, By Value, 2018H-2028F (USD Billion & CAGR)
- Figure 33: Americas Cosmetics Contract Manufacturing Market, By Gels, By Value, 2018H-2028F (USD Billion & CAGR)
- Figure 34: Americas Cosmetics Contract Manufacturing Market, By Liquids & Suspensions, By Value, 2018H-2028F (USD Billion & CAGR)
- Figure 35: Americas Cosmetics Contract Manufacturing Market, By Other Product Forms, By Value, 2018H-2028F (USD Billion & CAGR)
- Figure 36: Americas Cosmetics Contract Manufacturing Market, By Organic, By Value, 2018H-2028F (USD Billion & CAGR)
- Figure 37: Americas Cosmetics Contract Manufacturing Market, By Conventional, By Value, 2018H-2028F (USD Billion & CAGR)
- Figure 38: United States Cosmetics Contract Manufacturing Market, By Value, 2018-2028 (USD Billion & CAGR)
- Figure 39: United States Cosmetics Contract Manufacturing Market Value, By Products, 2021 (USD Billion)
- Figure 40: United States Cosmetics Contract Manufacturing Market Share, By Products, By Value, 2021 (%)
- Figure 41: United States Cosmetics Contract Manufacturing Market Share, By Product Form, By Value, 2021 (%)
- Figure 42: United States Cosmetics Contract Manufacturing Market Share, By Cosmetic Type, By Value, 2021 (%)
- Figure 43: Canada Cosmetics Contract Manufacturing Market, By Value, 2018-2028 (USD Billion & CAGR)
- Figure 44: Canada Cosmetics Contract Manufacturing Market Value, By Products, 2021 (USD Billion)
- Figure 45: Canada Cosmetics Contract Manufacturing Market Share, By Products, By Value, 2021 (%)
- Figure 46: Canada Cosmetics Contract Manufacturing Market Share, By Product Form, By Value, 2021 (%)
- Figure 47: Canada Cosmetics Contract Manufacturing Market Share, By Cosmetic Type, By Value, 2021 (%)
- Figure 48: Rest of Americas Cosmetics Contract Manufacturing Market, By Value, 2018-2028 (USD Billion & CAGR)
- Figure 49: Rest of Americas Cosmetics Contract Manufacturing Market Value, By Products, 2021 (USD Billion)
- Figure 50: Rest of Americas Cosmetics Contract Manufacturing Market Share, By Products, By Value, 2021 (%)
- Figure 51: Rest of Americas Cosmetics Contract Manufacturing Market Share, By Product Form, By Value, 2021 (%)
- Figure 52: Rest of Americas Cosmetics Contract Manufacturing Market Share, By Cosmetic Type, By Value, 2021 (%)
- Figure 53: Europe Cosmetics Contract Manufacturing Market Size, By Value, 2018H-2028F (USD Billion)
- Figure 54: Europe Cosmetics Contract Manufacturing Market Share, By Products, 2021 (%)
- Figure 55: Europe Cosmetics Contract Manufacturing Market, By Skin Care, By Value, 2018H-2028F (USD Billion & CAGR)
- Figure 56: Europe Cosmetics Contract Manufacturing Market, By Hair & Body Care, By Value, 2018H-2028F (USD Billion & CAGR)
- Figure 57: Europe Cosmetics Contract Manufacturing Market, By Make-up and Color Cosmetics, By Value, 2018H-2028F (USD Billion & CAGR)
- Figure 58: Europe Cosmetics Contract Manufacturing Market, Other Products, By Value, 2018H-2028F (USD Billion & CAGR)
- Figure 59: Europe Cosmetics Contract Manufacturing Market, By Creams & Lotions, By Value, 2018H-2028F (USD Billion & CAGR)
- Figure 60: Europe Cosmetics Contract Manufacturing Market, By Gels, By Value, 2018H-2028F (USD Billion & CAGR)
- Figure 61: Europe Cosmetics Contract Manufacturing Market, By Liquids & Suspensions, By Value, 2018H-2028F (USD Billion & CAGR)
- Figure 62: Europe Cosmetics Contract Manufacturing Market, By Other Product Forms, By Value, 2018H-2028F (USD Billion & CAGR)
- Figure 63: Europe Cosmetics Contract Manufacturing Market, By Organic, By Value, 2018H-2028F (USD Billion & CAGR)
- Figure 64: Europe Cosmetics Contract Manufacturing Market, By Conventional, By Value, 2018H-2028F (USD Billion & CAGR)
- Figure 65: Germany Cosmetics Contract Manufacturing Market, By Value, 2018-2028 (USD Billion & CAGR)
- Figure 66: Germany Cosmetics Contract Manufacturing Market Value, By Products, 2021 (USD Billion)
- Figure 67: Germany Cosmetics Contract Manufacturing Market Share, By Products, By Value, 2021 (%)
- Figure 68: Germany Cosmetics Contract Manufacturing Market Share, By Product Form, By Value, 2021 (%)
- Figure 69: Germany Cosmetics Contract Manufacturing Market Share, By Cosmetic Type, By Value, 2021 (%)
- Figure 70: United Kingdom Cosmetics Contract Manufacturing Market, By Value, 2018-2028 (USD Billion & CAGR)
- Figure 71: United Kingdom Cosmetics Contract Manufacturing Market Value, By Products, 2021 (USD Billion)
- Figure 72: United Kingdom Cosmetics Contract Manufacturing Market Share, By Products, By Value, 2021 (%)
- Figure 73: United Kingdom Cosmetics Contract Manufacturing Market Share, By Product Form, By Value, 2021 (%)
- Figure 74: United Kingdom Cosmetics Contract Manufacturing Market Share, By Cosmetic Type, By Value, 2021 (%)
- Figure 75: France Cosmetics Contract Manufacturing Market, By Value, 2018-2028 (USD Billion & CAGR)
- Figure 76: France Cosmetics Contract Manufacturing Market Value, By Products, 2021 (USD Billion)
- Figure 77: France Cosmetics Contract Manufacturing Market Share, By Products, By Value, 2021 (%)
- Figure 78: France Cosmetics Contract Manufacturing Market Share, By Product Form, By Value, 2021 (%)
- Figure 79: France Cosmetics Contract Manufacturing Market Share, By Cosmetic Type, By Value, 2021 (%)
- Figure 80: Italy Cosmetics Contract Manufacturing Market, By Value, 2018-2028 (USD Billion & CAGR)
- Figure 81: Italy Cosmetics Contract Manufacturing Market Value, By Products, 2021 (USD Billion)
- Figure 82: Italy Cosmetics Contract Manufacturing Market Share, By Products, By Value, 2021 (%)
- Figure 83: Italy Cosmetics Contract Manufacturing Market Share, By Product Form, By Value, 2021 (%)
- Figure 84: Italy Cosmetics Contract Manufacturing Market Share, By Cosmetic Type, By Value, 2021 (%)
- Figure 85: Rest of Europe Cosmetics Contract Manufacturing Market, By Value, 2018-2028 (USD Billion & CAGR)
- Figure 86: Rest of Europe Cosmetics Contract Manufacturing Market Value, By Products, 2021 (USD Billion)
- Figure 87: Rest of Europe Cosmetics Contract Manufacturing Market Share, By Products, By Value, 2021 (%)
- Figure 88: Rest of Europe Cosmetics Contract Manufacturing Market Share, By Product Form, By Value, 2021 (%)
- Figure 89: Rest of Europe Cosmetics Contract Manufacturing Market Share, By Cosmetic Type, By Value, 2021 (%)
- Figure 90: Asia Pacific Cosmetics Contract Manufacturing Market Size, By Value, 2018H-2028F (USD Billion)
- Figure 91: Asia Pacific Cosmetics Contract Manufacturing Market Share, By Products, 2021 (%)
- Figure 92: Asia Pacific Cosmetics Contract Manufacturing Market, By Skin Care, By Value, 2018H-2028F (USD Billion & CAGR)
- Figure 93: Asia Pacific Cosmetics Contract Manufacturing Market, By Hair & Body Care, By Value, 2018H-2028F (USD Billion & CAGR)
- Figure 94: Asia Pacific Cosmetics Contract Manufacturing Market, By Make-up and Color Cosmetics, By Value, 2018H-2028F (USD Billion & CAGR)
- Figure 95: Asia Pacific Cosmetics Contract Manufacturing Market, Other Products, By Value, 2018H-2028F (USD Billion & CAGR)
- Figure 96: Asia Pacific Cosmetics Contract Manufacturing Market, By Creams & Lotions, By Value, 2018H-2028F (USD Billion & CAGR)
- Figure 97: Asia Pacific Cosmetics Contract Manufacturing Market, By Gels, By Value, 2018H-2028F (USD Billion & CAGR)
- Figure 98: Asia Pacific Cosmetics Contract Manufacturing Market, By Liquids & Suspensions, By Value, 2018H-2028F (USD Billion & CAGR)
- Figure 99: Asia Pacific Cosmetics Contract Manufacturing Market, By Other Product Forms, By Value, 2018H-2028F (USD Billion & CAGR)
- Figure 100: Asia Pacific Cosmetics Contract Manufacturing Market, By Organic, By Value, 2018H-2028F (USD Billion & CAGR)
- Figure 101: Asia Pacific Cosmetics Contract Manufacturing Market, By Conventional, By Value, 2018H-2028F (USD Billion & CAGR)
- Figure 102: China Cosmetics Contract Manufacturing Market, By Value, 2018-2028 (USD Billion & CAGR)
- Figure 103: China Cosmetics Contract Manufacturing Market Value, By Products, 2021 (USD Billion)
- Figure 104: China Cosmetics Contract Manufacturing Market Share, By Products, By Value, 2021 (%)
- Figure 105: China Cosmetics Contract Manufacturing Market Share, By Product Form, By Value, 2021 (%)
- Figure 106: China Cosmetics Contract Manufacturing Market Share, By Cosmetic Type, By Value, 2021 (%)
- Figure 107: Japan Cosmetics Contract Manufacturing Market, By Value, 2018-2028 (USD Billion & CAGR)
- Figure 108: Japan Cosmetics Contract Manufacturing Market Value, By Products, 2021 (USD Billion)
- Figure 109: Japan Cosmetics Contract Manufacturing Market Share, By Products, By Value, 2021 (%)
- Figure 110: Japan Cosmetics Contract Manufacturing Market Share, By Product Form, By Value, 2021 (%)
- Figure 111: Japan Cosmetics Contract Manufacturing Market Share, By Cosmetic Type, By Value, 2021 (%)
- Figure 112: South Korea Cosmetics Contract Manufacturing Market, By Value, 2018-2028 (USD Billion & CAGR)
- Figure 113: South Korea Cosmetics Contract Manufacturing Market Value, By Products, 2021 (USD Billion)
- Figure 114: South Korea Cosmetics Contract Manufacturing Market Share, By Products, By Value, 2021 (%)
- Figure 115: South Korea Cosmetics Contract Manufacturing Market Share, By Product Form, By Value, 2021 (%)
- Figure 116: South Korea Cosmetics Contract Manufacturing Market Share, By Cosmetic Type, By Value, 2021 (%)
- Figure 117: India Cosmetics Contract Manufacturing Market, By Value, 2018-2028 (USD Billion & CAGR)
- Figure 118: India Cosmetics Contract Manufacturing Market Value, By Products, 2021 (USD Billion)
- Figure 119: India Cosmetics Contract Manufacturing Market Share, By Products, By Value, 2021 (%)
- Figure 120: India Cosmetics Contract Manufacturing Market Share, By Product Form, By Value, 2021 (%)
- Figure 121: India Cosmetics Contract Manufacturing Market Share, By Cosmetic Type, By Value, 2021 (%)
- Figure 122: Rest of APAC Cosmetics Contract Manufacturing Market, By Value, 2018-2028 (USD Billion & CAGR)
- Figure 123: Rest of APAC Cosmetics Contract Manufacturing Market Value, By Products, 2021 (USD Billion)
- Figure 124: Rest of APAC Cosmetics Contract Manufacturing Market Share, By Products, By Value, 2021 (%)
- Figure 125: Rest of APAC Cosmetics Contract Manufacturing Market Share, By Product Form, By Value, 2021 (%)
- Figure 126: Rest of APAC Cosmetics Contract Manufacturing Market Share, By Cosmetic Type, By Value, 2021 (%)
- Figure 127: Middle East & Africa Cosmetics Contract Manufacturing Market Size, By Value, 2018H-2028F (USD Billion)
- Figure 128: Middle East & Africa Cosmetics Contract Manufacturing Market Share, By Products, 2021 (%)
- Figure 129: Middle East & Africa Cosmetics Contract Manufacturing Market, By Skin Care, By Value, 2018H-2028F (USD Billion & CAGR)
- Figure 130: Middle East & Africa Cosmetics Contract Manufacturing Market, By Hair & Body Care, By Value, 2018H-2028F (USD Billion & CAGR)
- Figure 131: Middle East & Africa Cosmetics Contract Manufacturing Market, By Make-up and Color Cosmetics, By Value, 2018H-2028F (USD Billion & CAGR)
- Figure 132: Middle East & Africa Cosmetics Contract Manufacturing Market, Other Products, By Value, 2018H-2028F (USD Billion & CAGR)
- Figure 133: Middle East & Africa Cosmetics Contract Manufacturing Market, By Creams & Lotions, By Value, 2018H-2028F (USD Billion & CAGR)
- Figure 134: Middle East & Africa Cosmetics Contract Manufacturing Market, By Gels, By Value, 2018H-2028F (USD Billion & CAGR)
- Figure 135: Middle East & Africa Cosmetics Contract Manufacturing Market, By Liquids & Suspensions, By Value, 2018H-2028F (USD Billion & CAGR)
- Figure 136: Middle East & Africa Cosmetics Contract Manufacturing Market, By Other Product Forms, By Value, 2018H-2028F (USD Billion & CAGR)
- Figure 137: Middle East & Africa Cosmetics Contract Manufacturing Market, By Organic, By Value, 2018H-2028F (USD Billion & CAGR)
- Figure 138: Middle East & Africa Cosmetics Contract Manufacturing Market, By Conventional, By Value, 2018H-2028F (USD Billion & CAGR)
- Figure 139: Global Impact of Drivers and Restraints
- Figure 140: Market Share of Prominent Companies of Cosmetics Contract Manufacturing, 2021 (%)
- Figure 141: Intercos Revenues, 2019-2021 (USD Million)
- Figure 142: Intercos Revenue, By Business Segments, 2021 (%)
- Figure 143: Intercos Revenue, By Geographical Segments, 2021 (%)
- Figure 144: Korea Kolmar Revenues, 2019-2021 (USD Million)
- Figure 145: Korea Kolmar Revenue, By Geographical Segments, 2020 (%)
- Figure 146: Korea Kolmar Revenue, By Geographical Segments, 2021 (%)
List of Tables
Table A1: Global Impact of Macro Economic Factors, By Region
Table A2: United States Cosmetics Contract Manufacturing Market, By Products, By Value, 2018-2021 (USD Billion)
Table A3: United States Cosmetics Contract Manufacturing Market, By Products, By Value, 2022-2028 (USD Billion)
Table A4: United States Cosmetics Contract Manufacturing Market, By Product Form, By Value, 2018-2021 (USD Billion)
Table A5: United States Cosmetics Contract Manufacturing Market, By Product Form, By Value, 2022-2028 (USD Billion)
Table A6: United States Cosmetics Contract Manufacturing Market, By Cosmetic Type, By Value, 2018-2021 (USD Billion)
Table A7: United States Cosmetics Contract Manufacturing Market, By Cosmetic Type, By Value, 2022-2028 (USD Billion)
Table A8: Canada Cosmetics Contract Manufacturing Market, By Products, By Value, 2018-2021 (USD Billion)
Table A9: Canada Cosmetics Contract Manufacturing Market, By Products, By Value, 2022-2028 (USD Billion)
Table A10: Canada Cosmetics Contract Manufacturing Market, By Product Form, By Value, 2018-2021 (USD Billion)
Table A11: Canada Cosmetics Contract Manufacturing Market, By Product Form, By Value, 2022-2028 (USD Billion)
Table A12: Canada Cosmetics Contract Manufacturing Market, By Cosmetic Type, By Value, 2018-2021 (USD Billion)
Table A13: Canada Cosmetics Contract Manufacturing Market, By Cosmetic Type, By Value, 2022-2028 (USD Billion)
Table A14: Rest of Americas Cosmetics Contract Manufacturing Market, By Products, By Value, 2018-2021 (USD Billion)
Table A15: Rest of Americas Cosmetics Contract Manufacturing Market, By Products, By Value, 2022-2028 (USD Billion)
Table A16: Rest of Americas Cosmetics Contract Manufacturing Market, By Product Form, By Value, 2018-2021 (USD Billion)
Table A17: Rest of Americas Cosmetics Contract Manufacturing Market, By Product Form, By Value, 2022-2028 (USD Billion)
Table A18: Rest of Americas Cosmetics Contract Manufacturing Market, By Cosmetic Type, By Value, 2018-2021 (USD Billion)
Table A19: Rest of Americas Cosmetics Contract Manufacturing Market, By Cosmetic Type, By Value, 2022-2028 (USD Billion)
Table A20: Germany Cosmetics Contract Manufacturing Market, By Products, By Value, 2018-2021 (USD Billion)
Table A21: Germany Cosmetics Contract Manufacturing Market, By Products, By Value, 2022-2028 (USD Billion)
Table A22: Germany Cosmetics Contract Manufacturing Market, By Product Form, By Value, 2018-2021 (USD Billion)
Table A23: Germany Cosmetics Contract Manufacturing Market, By Product Form, By Value, 2022-2028 (USD Billion)
Table A24: Germany Cosmetics Contract Manufacturing Market, By Cosmetic Type, By Value, 2018-2021 (USD Billion)
Table A25: Germany Cosmetics Contract Manufacturing Market, By Cosmetic Type, By Value, 2022-2028 (USD Billion)
Table A26: United Kingdom Cosmetics Contract Manufacturing Market, By Products, By Value, 2018-2021 (USD Billion)
Table A27: United Kingdom Cosmetics Contract Manufacturing Market, By Products, By Value, 2022-2028 (USD Billion)
Table A28: United Kingdom Cosmetics Contract Manufacturing Market, By Product Form, By Value, 2018-2021 (USD Billion)
Table A29: United Kingdom Cosmetics Contract Manufacturing Market, By Product Form, By Value, 2022-2028 (USD Billion)
Table A30: United Kingdom Cosmetics Contract Manufacturing Market, By Cosmetic Type, By Value, 2018-2021 (USD Billion)
Table A31: United Kingdom Cosmetics Contract Manufacturing Market, By Cosmetic Type, By Value, 2022-2028 (USD Billion)
Table A32: France Cosmetics Contract Manufacturing Market, By Products, By Value, 2018-2021 (USD Billion)
Table A33: France Cosmetics Contract Manufacturing Market, By Products, By Value, 2022-2028 (USD Billion)
Table A34: France Cosmetics Contract Manufacturing Market, By Product Form, By Value, 2018-2021 (USD Billion)
Table A35: France Cosmetics Contract Manufacturing Market, By Product Form, By Value, 2022-2028 (USD Billion)
Table A36: France Cosmetics Contract Manufacturing Market, By Cosmetic Type, By Value, 2018-2021 (USD Billion)
Table A37: France Cosmetics Contract Manufacturing Market, By Cosmetic Type, By Value, 2022-2028 (USD Billion)
Table A38: Italy Cosmetics Contract Manufacturing Market, By Products, By Value, 2018-2021 (USD Billion)
Table A39: Italy Cosmetics Contract Manufacturing Market, By Products, By Value, 2022-2028 (USD Billion)
Table A40: Italy Cosmetics Contract Manufacturing Market, By Product Form, By Value, 2018-2021 (USD Billion)
Table A41: Italy Cosmetics Contract Manufacturing Market, By Product Form, By Value, 2022-2028 (USD Billion)
Table A42: Italy Cosmetics Contract Manufacturing Market, By Cosmetic Type, By Value, 2018-2021 (USD Billion)
Table A43: Italy Cosmetics Contract Manufacturing Market, By Cosmetic Type, By Value, 2022-2028 (USD Billion)
Table A44: Rest of Europe Cosmetics Contract Manufacturing Market, By Products, By Value, 2018-2021 (USD Billion)
Table A45: Rest of Europe Cosmetics Contract Manufacturing Market, By Products, By Value, 2022-2028 (USD Billion)
Table A46: Rest of Europe Cosmetics Contract Manufacturing Market, By Product Form, By Value, 2018-2021 (USD Billion)
Table A47: Rest of Europe Cosmetics Contract Manufacturing Market, By Product Form, By Value, 2022-2028 (USD Billion)
Table A48: Rest of Europe Cosmetics Contract Manufacturing Market, By Cosmetic Type, By Value, 2018-2021 (USD Billion)
Table A49: Rest of Europe Cosmetics Contract Manufacturing Market, By Cosmetic Type, By Value, 2022-2028 (USD Billion)
Table A50: China Cosmetics Contract Manufacturing Market, By Products, By Value, 2018-2021 (USD Billion)
Table A51: China Cosmetics Contract Manufacturing Market, By Products, By Value, 2022-2028 (USD Billion)
Table A52: China Cosmetics Contract Manufacturing Market, By Product Form, By Value, 2018-2021 (USD Billion)
Table A53: China Cosmetics Contract Manufacturing Market, By Product Form, By Value, 2022-2028 (USD Billion)
Table A54: China Cosmetics Contract Manufacturing Market, By Cosmetic Type, By Value, 2018-2021 (USD Billion)
Table A55: China Cosmetics Contract Manufacturing Market, By Cosmetic Type, By Value, 2022-2028 (USD Billion)
Table A56: Japan Cosmetics Contract Manufacturing Market, By Products, By Value, 2018-2021 (USD Billion)
Table A57: Japan Cosmetics Contract Manufacturing Market, By Products, By Value, 2022-2028 (USD Billion)
Table A58: Japan Cosmetics Contract Manufacturing Market, By Product Form, By Value, 2018-2021 (USD Billion)
Table A59: Japan Cosmetics Contract Manufacturing Market, By Product Form, By Value, 2022-2028 (USD Billion)
Table A60: Japan Cosmetics Contract Manufacturing Market, By Cosmetic Type, By Value, 2018-2021 (USD Billion)
Table A61: Japan Cosmetics Contract Manufacturing Market, By Cosmetic Type, By Value, 2022-2028 (USD Billion)
Table A62: South Korea Cosmetics Contract Manufacturing Market, By Products, By Value, 2018-2021 (USD Billion)
Table A63: South Korea Cosmetics Contract Manufacturing Market, By Products, By Value, 2022-2028 (USD Billion)
Table A64: South Korea Cosmetics Contract Manufacturing Market, By Product Form, By Value, 2018-2021 (USD Billion)
Table A65: South Korea Cosmetics Contract Manufacturing Market, By Product Form, By Value, 2022-2028 (USD Billion)
Table A66: South Korea Cosmetics Contract Manufacturing Market, By Cosmetic Type, By Value, 2018-2021 (USD Billion)
Table A67: South Korea Cosmetics Contract Manufacturing Market, By Cosmetic Type, By Value, 2022-2028 (USD Billion)
Table A68: India Cosmetics Contract Manufacturing Market, By Products, By Value, 2018-2021 (USD Billion)
Table A69: India Cosmetics Contract Manufacturing Market, By Products, By Value, 2022-2028 (USD Billion)
Table A70: India Cosmetics Contract Manufacturing Market, By Product Form, By Value, 2018-2021 (USD Billion)
Table A71: India Cosmetics Contract Manufacturing Market, By Product Form, By Value, 2022-2028 (USD Billion)
Table A72: India Cosmetics Contract Manufacturing Market, By Cosmetic Type, By Value, 2018-2021 (USD Billion)
Table A73: India Cosmetics Contract Manufacturing Market, By Cosmetic Type, By Value, 2022-2028 (USD Billion)
Table A74: Rest of APAC Cosmetics Contract Manufacturing Market, By Products, By Value, 2018-2021 (USD Billion)
Table A75: Rest of APAC Cosmetics Contract Manufacturing Market, By Products, By Value, 2022-2028 (USD Billion)
Table A76: Rest of APAC Cosmetics Contract Manufacturing Market, By Product Form, By Value, 2018-2021 (USD Billion)
Table A77: Rest of APAC Cosmetics Contract Manufacturing Market, By Product Form, By Value, 2022-2028 (USD Billion)
Table A78: Rest of APAC Cosmetics Contract Manufacturing Market, By Cosmetic Type, By Value, 2018-2021 (USD Billion)
Table A79: Rest of APAC Cosmetics Contract Manufacturing Market, By Cosmetic Type, By Value, 2022-2028 (USD Billion)
Table A80: Key Company Financials, 2019-2021
Table A81: Key Company Financials, 2019-2021
Executive Summary
The Global Cosmetics Contract Manufacturing market was valued at USD 16.55 Billion in 2021 and is expected to grow at a CAGR of 4.5% during the forecast period of 2023-2028. Globally, businesses from the cosmetics industry favour contract manufacturing for a number of reasons based on the state of the economy and their financial capacity. Also, the market for contract manufacturing will rise as a result of factors including decreased operational costs and time, flexibility in operations, better resource allocation, and enhanced efficiency. The expansion of the global market is further aided by contract manufacturing companies' faster production rates and turnaround times, improved quality control, and scalability.
It is anticipated that contract manufacture of cosmetic products would rise as major corporations move their attention from R&D to internal production and other promotional activities. Also, as the demand for organic components rises, customers are gravitating towards natural and organic personal care products, which is probably what is driving the market expansion during the research period globally.
Also, the growth of cosmetics contract manufacturing has been impacted by the rise of the millennial trend and its effect on their followers' decisions to purchase the products they market. Also, the proliferation of e-commerce websites and social media beauty specialists has created a wealth of prospects for the sale of cosmetic products.
Scope of the Report
- The report analyses the Cosmetics Contract Manufacturing Market by Value (USD Billion).
- The report presents the analysis of the Cosmetics Contract Manufacturing market for the historical period of 2018-2021, the base year 2022 and the forecast period of 2023-2028.
- The report analyses the Cosmetics Contract Manufacturing Market by Products (Skincare, Hair & Body Care, Makeup & Color Cosmetics, Other Products).
- The report analyses the Cosmetics Contract Manufacturing Market By Product Form (Creams & lotions, Gels, Liquids & Suspensions, Other Product Forms).
- The report analyses the Cosmetics Contract Manufacturing Market By Cosmetic Type (Organic & Conventional).
- The Global Cosmetics Contract Manufacturing Market has been analysed by regions (North America, Europe, Asia Pacific, Middle East) and by countries (United States, Canada, Germany, UK, France, Italy, China, Japan, South Korea, India).
- The key insights of the report have been presented through the frameworks of SWOT and Porter's Five Forces Analysis. Also, the attractiveness of the market has been presented by region, by component, by vehicle.
- Also, the major opportunities, trends, drivers and challenges of the industry have been analysed in the report.
- The report tracks competitive developments, strategies, mergers and acquisitions and new product development. The companies analysed in the report include Kdc/One, Intercos, Tokiwa Corporation, Kolmar Korea, Oxygen Development, Mana Products, HSA Cosmetics, Nox Bellcow Cosmetics, Faber Castell Cosmetics, Art Cosmetics.
Key Target Audience
- Cosmetics Contract Manufacturers
- Cosmetic Companies
- Consulting and Advisory Firms
- Research and Development Organizations
- Government and Regulatory Authorities
Table of Contents
1. Market Background
- 1.1 Scope and Product Outlook
- 1.2 Executive Summary
- 1.3 Research Methodology
2. Strategic Recommendations
3. Global Cosmetics Contract Manufacturing Market: Historic and Forecast (2018-2028)
- 3.1 Impact Analysis of Macro Economic Factors on the Cosmetics Contract Manufacturing Market
- 3.2 Investments in the R&D sector by Contract Manufacturers
- 3.3 Cost Structure Analysis
- 3.4 Global Cosmetics Contract Manufacturing Market: Dashboard
- 3.5 Global Cosmetics Contract Manufacturing Market: Market Size and CAGR, 2018-2028 (USD Billion & CAGR)
- 3.6 Impact of COVID-19 on the Cosmetics Contract Manufacturing Market
- 3.7 Global Cosmetics Contract Manufacturing Market Segmentation: By Products
- 3.7.1 Global Cosmetics Contract Manufacturing Market, By Products Overview
- 3.7.2 Global Cosmetics Contract Manufacturing Market Size, By Skincare, By Value, 2018H-2028F (USD Billion & CAGR)
- 3.7.3 Global Cosmetics Contract Manufacturing Market Size, By Hair & Body Care, By Value, 2018H-2028F (USD Billion & CAGR)
- 3.7.4 Global Cosmetics Contract Manufacturing Market Size, By Makeup & Color Cosmetics, By Value, 2018H-2028F (USD Billion & CAGR)
- 3.7.5 Global Cosmetics Contract Manufacturing Market Size, By Other Products, By Value, 2018H-2028F (USD Billion & CAGR)
- 3.8 Global Cosmetics Contract Manufacturing Market Segmentation: By Product Form
- 3.8.1 Global Cosmetics Contract Manufacturing Market, By Product Form Overview
- 3.8.2 Global Cosmetics Contract Manufacturing Market Size, By Creams & Lotions, By Value, 2018H-2028F (USD Billion & CAGR)
- 3.8.3 Global Cosmetics Contract Manufacturing Market Size, By Gels, By Value, 2018H-2028F (USD Billion & CAGR)
- 3.8.4 Global Cosmetics Contract Manufacturing Market Size, By Liquids & Suspensions, By Value, 2018H-2028F (USD Billion & CAGR)
- 3.8.5 Global Cosmetics Contract Manufacturing Market Size, By Other Product Forms, By Value, 2018H-2028F (USD Billion & CAGR)
- 3.9 Global Cosmetics Contract Manufacturing Market Segmentation: By Cosmetic Type
- 3.9.1 Global Cosmetics Contract Manufacturing Market, By Cosmetic Type Overview
- 3.9.2 Global Cosmetics Contract Manufacturing Market Size, By Organic, By Value, 2018H-2028F (USD Billion & CAGR)
- 3.9.3 Global Cosmetics Contract Manufacturing Market Size, By Conventional, By Value, 2018H-2028F (USD Billion & CAGR)
4. Global Cosmetics Contract Manufacturing Market, Region Analysis
- 4.1 Regional Coverage of the Study
- 4.2 Regional Snapshot
5. Americas Cosmetics Contract Manufacturing Market: Historic and Forecast (2018-2028)
- 5.1 Americas Cosmetics Contract Manufacturing Market: Snapshot
- 5.2 Americas Cosmetics Contract Manufacturing Market: Market Size and CAGR, 2018-2028 (USD Billion & CAGR)
- 5.3 Americas Cosmetics Contract Manufacturing Market: Key Factors
- 5.4 Americas Cosmetics Contract Manufacturing Market Segmentation: By Products
- 5.4.1 Americas Cosmetics Contract Manufacturing Market, By Products Overview
- 5.4.2 Americas Cosmetics Contract Manufacturing Market Size, By Skincare, By Value, 2018H-2028F (USD Billion & CAGR)
- 5.4.3 Americas Cosmetics Contract Manufacturing Market Size, By Hair & Body care, By Value, 2018H-2028F (USD Billion & CAGR)
- 5.4.4 Americas Cosmetics Contract Manufacturing Market Size, By Makeup & Color Cosmetics, By Value, 2018H-2028F (USD Billion & CAGR)
- 5.4.5 Americas Cosmetics Contract Manufacturing Market Size, By Other Products, By Value, 2018H-2028F (USD Billion & CAGR)
- 5.5 Americas Cosmetics Contract Manufacturing Market Segmentation: By Product Form
- 5.5.1 Americas Cosmetics Contract Manufacturing Market, By Product Form Overview
- 5.5.2 Americas Cosmetics Contract Manufacturing Market Size, By Creams and Lotions, By Value, 2018H-2028F (USD Billion & CAGR)
- 5.5.3 Americas Cosmetics Contract Manufacturing Market Size, By Gels, By Value, 2018H-2028F (USD Billion & CAGR)
- 5.5.4 Americas Cosmetics Contract Manufacturing Market Size, By Liquids & Suspensions, By Value, 2018H-2028F (USD Billion & CAGR)
- 5.5.5 Americas Cosmetics Contract Manufacturing Market Size, By Other Product Forms, By Value, 2018H-2028F (USD Billion & CAGR)
- 5.6 Americas Cosmetics Contract Manufacturing Market Segmentation: By Cosmetic Type
- 5.6.1 Americas Cosmetics Contract Manufacturing Market, By Cosmetic Type Overview
- 5.6.2 Americas Cosmetics Contract Manufacturing Market Size, By Organic, By Value, 2018H-2028F (USD Billion & CAGR)
- 5.6.3 Americas Cosmetics Contract Manufacturing Market Size, By Conventional, By Value, 2018H-2028F (USD Billion & CAGR)
- 5.7 Americas Cosmetics Contract Manufacturing Market Segmentation: By Country
- 5.7.1 United States Cosmetics Contract Manufacturing Market: Market Size and CAGR, 2018-2028 (USD Billion & CAGR)
- 5.7.1.1 United States Cosmetics Contract Manufacturing Market, By Products
- 5.7.1.2 United States Cosmetics Contract Manufacturing Market, By Product Form
- 5.7.1.3 United States Cosmetics Contract Manufacturing Market, By Cosmetic Type
- 5.7.2 Canada Cosmetics Contract Manufacturing Market: Market Size and CAGR, 2018-2028 (USD Billion & CAGR)
- 5.7.2.1 Canada Cosmetics Contract Manufacturing Market, By Products
- 5.7.2.3 Canada Cosmetics Contract Manufacturing Market, By Product Form
- 5.7.2.4 Canada Cosmetics Contract Manufacturing Market, By Cosmetic Type
- 5.7.2 Rest of Americas Cosmetics Contract Manufacturing Market: Market Size and CAGR, 2018-2028 (USD Billion & CAGR)
- 5.7.3.1 Rest of Americas Cosmetics Contract Manufacturing Market, By Products
- 5.7.3.3 Rest of Americas Cosmetics Contract Manufacturing Market, By Product Form
- 5.7.3.4 Rest of Americas Cosmetics Contract Manufacturing Market, By Cosmetic Type
- 5.7.1 United States Cosmetics Contract Manufacturing Market: Market Size and CAGR, 2018-2028 (USD Billion & CAGR)
6. Europe Cosmetics Contract Manufacturing Market: Historic and Forecast (2018-2028)
- 6.1 Europe Cosmetics Contract Manufacturing Market: Snapshot
- 6.2 Europe Cosmetics Contract Manufacturing Market: Market Size and CAGR, 2018-2028 (USD Billion & CAGR)
- 6.3 Europe Cosmetics Contract Manufacturing Market: Key Factors
- 6.4 Europe Cosmetics Contract Manufacturing Market Segmentation: By Products
- 6.4.1 Europe Cosmetics Contract Manufacturing Market, By Products Overview
- 6.4.2 Europe Cosmetics Contract Manufacturing Market Size, By Skincare, By Value, 2018H-2028F (USD Billion & CAGR)
- 6.4.3 Europe Cosmetics Contract Manufacturing Market Size, By Hair & Body care, By Value, 2018H-2028F (USD Billion & CAGR)
- 6.4.4 Europe Cosmetics Contract Manufacturing Market Size, By Makeup & Color Cosmetics, By Value, 2018H-2028F (USD Billion & CAGR)
- 6.4.5 Europe Cosmetics Contract Manufacturing Market Size, By Other Products, By Value, 2018H-2028F (USD Billion & CAGR)
- 6.5 Europe Cosmetics Contract Manufacturing Market Segmentation: By Product Form
- 6.5.1 Europe Cosmetics Contract Manufacturing Market, By Product Form Overview
- 6.5.2 Europe Cosmetics Contract Manufacturing Market Size, By Creams and Lotions, By Value, 2018H-2028F (USD Billion & CAGR)
- 6.5.3 Europe Cosmetics Contract Manufacturing Market Size, By Gels, By Value, 2018H-2028F (USD Billion & CAGR)
- 6.5.4 Europe Cosmetics Contract Manufacturing Market Size, By Liquids & Suspensions, By Value, 2018H-2028F (USD Billion & CAGR)
- 6.5.5 Europe Cosmetics Contract Manufacturing Market Size, By Other Product Forms, By Value, 2018H-2028F (USD Billion & CAGR)
- 6.6 Europe Cosmetics Contract Manufacturing Market Segmentation: By Cosmetic Type
- 6.6.1 Europe Cosmetics Contract Manufacturing Market, By Cosmetic Type Overview
- 6.6.2 Europe Cosmetics Contract Manufacturing Market Size, By Organic, By Value, 2018H-2028F (USD Billion & CAGR)
- 6.6.3 Europe Cosmetics Contract Manufacturing Market Size, By Conventional, By Value, 2018H-2028F (USD Billion & CAGR)
- 6.7 Europe Cosmetics Contract Manufacturing Market Segmentation: By Country
- 6.7.1 Germany Cosmetics Contract Manufacturing Market: Market Size and CAGR, 2018-2028 (USD Billion & CAGR)
- 6.7.1.1 Germany Cosmetics Contract Manufacturing Market, By Products
- 6.7.1.2 Germany Cosmetics Contract Manufacturing Market, By Product Form
- 6.7.1.3 Germany Cosmetics Contract Manufacturing Market, By Cosmetic Type
- 6.8.2 United Kingdom Cosmetics Contract Manufacturing Market: Market Size and CAGR, 2018-2028 (USD Billion & CAGR)
- 6.8.2.1 United Kingdom Cosmetics Contract Manufacturing Market, By Products
- 6.8.2.3 United Kingdom Cosmetics Contract Manufacturing Market, By Product Form
- 6.8.2.4 United Kingdom Cosmetics Contract Manufacturing Market, By Cosmetic Type
- 6.8.3 France Cosmetics Contract Manufacturing Market: Market Size and CAGR, 2018-2028 (USD Billion & CAGR)
- 6.8.3.1 France Cosmetics Contract Manufacturing Market, By Products
- 6.8.3.3 France Cosmetics Contract Manufacturing Market, By Product Form
- 6.8.3.4 France Cosmetics Contract Manufacturing Market, By Cosmetic Type
- 6.8.4 Italy Contract Manufacturing Market: Market Size and CAGR, 2018-2028 (USD Billion & CAGR)
- 6.8.4.1 Italy Cosmetics Contract Manufacturing Market, By Products
- 6.8.4.3 Italy Cosmetics Contract Manufacturing Market, By Product Form
- 6.8.4.4 Italy Cosmetics Contract Manufacturing Market, By Cosmetic Type
- 6.8.5 Rest of Europe Cosmetics Contract Manufacturing Market: Market Size and CAGR, 2018-2028 (USD Billion & CAGR)
- 6.8.5.1 Rest of Europe Cosmetics Contract Manufacturing Market, By Products
- 6.8.5.3 Rest of Europe Cosmetics Contract Manufacturing Market, By Product Form
- 6.8.5.4 Rest of Europe Cosmetics Contract Manufacturing Market, By Cosmetic Type
- 6.7.1 Germany Cosmetics Contract Manufacturing Market: Market Size and CAGR, 2018-2028 (USD Billion & CAGR)
7. Asia Pacific Cosmetics Contract Manufacturing Market: Historic and Forecast (2018-2028)
- 7.1 Asia Pacific Cosmetics Contract Manufacturing Market: Snapshot
- 7.2 Asia Pacific Cosmetics Contract Manufacturing Market: Market Size and CAGR, 2018-2028 (USD Billion & CAGR)
- 7.3 Asia Pacific Cosmetics Contract Manufacturing Market: Key Factors
- 7.4 Asia Pacific Cosmetics Contract Manufacturing Market Segmentation: By Products
- 7.4.1 Asia Pacific Cosmetics Contract Manufacturing Market, By Products Overview
- 7.4.2 Asia Pacific Cosmetics Contract Manufacturing Market Size, By Skincare, By Value, 2018H-2028F (USD Billion & CAGR)
- 7.4.3 Asia Pacific Cosmetics Contract Manufacturing Market Size, By Hair & Body care, By Value, 2018H-2028F (USD Billion & CAGR)
- 7.4.4 Asia Pacific Cosmetics Contract Manufacturing Market Size, By Makeup & Color Cosmetics, By Value, 2018H-2028F (USD Billion & CAGR)
- 7.4.5 Asia Pacific Cosmetics Contract Manufacturing Market Size, By Other Products, By Value, 2018H-2028F (USD Billion & CAGR)
- 7.5 Asia Pacific Cosmetics Contract Manufacturing Market Segmentation: By Product Form
- 7.5.1 Asia Pacific Cosmetics Contract Manufacturing Market, By Product Form Overview
- 7.5.2 Asia Pacific Cosmetics Contract Manufacturing Market Size, By Creams and Lotions, By Value, 2018H-2028F (USD Billion & CAGR)
- 7.5.3 Asia Pacific Cosmetics Contract Manufacturing Market Size, By Gels, By Value, 2018H-2028F (USD Billion & CAGR)
- 7.5.4 Asia Pacific Cosmetics Contract Manufacturing Market Size, By Liquids & Suspensions, By Value, 2018H-2028F (USD Billion & CAGR)
- 7.5.5 Asia Pacific Cosmetics Contract Manufacturing Market Size, By Other Product Forms, By Value, 2018H-2028F (USD Billion & CAGR)
- 7.6 Asia Pacific Cosmetics Contract Manufacturing Market Segmentation: By Cosmetic Type
- 7.6.1 Asia Pacific Cosmetics Contract Manufacturing Market, By Cosmetic Type Overview
- 7.6.2 Asia Pacific Cosmetics Contract Manufacturing Market Size, By Organic, By Value, 2018H-2028F (USD Billion & CAGR)
- 7.6.3 Asia Pacific Cosmetics Contract Manufacturing Market Size, By Conventional, By Value, 2018H-2028F (USD Billion & CAGR)
- 7.7 Asia Pacific Cosmetics Contract Manufacturing Market Segmentation: By Country
- 7.7.1 China Cosmetics Contract Manufacturing Market: Market Size and CAGR, 2018-2028 (USD Billion & CAGR)
- 7.7.1.1 China Cosmetics Contract Manufacturing Market, By Products
- 7.7.1.2 China Cosmetics Contract Manufacturing Market, By Product Form
- 7.7.1.3 China Cosmetics Contract Manufacturing Market, By Cosmetic Type
- 7.7.2 Japan Cosmetics Contract Manufacturing Market: Market Size and CAGR, 2018-2028 (USD Billion & CAGR)
- 7.7.2.1 Japan Cosmetics Contract Manufacturing Market, By Products
- 7.7.2.3 Japan Cosmetics Contract Manufacturing Market, By Product Form
- 7.7.2.4 Japan Cosmetics Contract Manufacturing Market, By Cosmetic Type
- 7.7.3 South Korea Cosmetics Contract Manufacturing Market: Market Size and CAGR, 2018-2028 (USD Billion & CAGR)
- 7.7.3.1 South Korea Cosmetics Contract Manufacturing Market, By Products
- 7.7.3.3 South Korea Cosmetics Contract Manufacturing Market, By Product Form
- 7.7.3.4 South Korea Cosmetics Contract Manufacturing Market, By Cosmetic Type
- 7.7.4 India Cosmetics Contract Manufacturing Market: Market Size and CAGR, 2018-2028 (USD Billion & CAGR)
- 7.7.4.1 India Cosmetics Contract Manufacturing Market, By Products
- 7.7.4.2 India Cosmetics Contract Manufacturing Market, By Product Form
- 7.7.4.3 India Cosmetics Contract Manufacturing Market, By Cosmetic Type
- 7.7.5 Rest of APAC Cosmetics Contract Manufacturing Market: Market Size and CAGR, 2018-2028 (USD Billion & CAGR)
- 7.7.5.1 Rest of APAC Cosmetics Contract Manufacturing Market, By Products
- 7.7.5.2 Rest of APAC Cosmetics Contract Manufacturing Market, By Product Form
- 7.7.5.3 Rest of APAC Cosmetics Contract Manufacturing Market, By Cosmetic Type
- 7.7.1 China Cosmetics Contract Manufacturing Market: Market Size and CAGR, 2018-2028 (USD Billion & CAGR)
8. Middle East & Africa Cosmetics Contract Manufacturing Market: Historic and Forecast (2018-2028)
- 8.1 Middle East & Africa Cosmetics Contract Manufacturing Market: Snapshot
- 8.2 Middle East & Africa Cosmetics Contract Manufacturing Market: Market Size and CAGR, 2018-2028 (USD Billion & CAGR)
- 8.3 Middle East & Africa Cosmetics Contract Manufacturing Market: Key Factors
- 8.4 Middle East & Africa Cosmetics Contract Manufacturing Market Segmentation: By Products
- 8.4.1 Middle East & Africa Cosmetics Contract Manufacturing Market, By Products Overview
- 8.4.2 Middle East & Africa Cosmetics Contract Manufacturing Market Size, By Skincare, By Value, 2018H-2028F (USD Billion & CAGR)
- 8.4.3 Middle East & Africa Cosmetics Contract Manufacturing Market Size, By Hair & Body care, By Value, 2018H-2028F (USD Billion & CAGR)
- 8.4.4 Middle East & Africa Cosmetics Contract Manufacturing Market Size, By Makeup & Color Cosmetics, By Value, 2018H-2028F (USD Billion & CAGR)
- 8.4.5 Asia Pacific Cosmetics Contract Manufacturing Market Size, By Other Products, By Value, 2018H-2028F (USD Billion & CAGR)
- 8.5 Middle East & Africa Cosmetics Contract Manufacturing Market Segmentation: By Product Form
- 8.5.1 Middle East & Africa Cosmetics Contract Manufacturing Market, By Product Form Overview
- 8.5.2 Middle East & Africa Cosmetics Contract Manufacturing Market Size, By Creams and Lotions, By Value, 2018H-2028F (USD Billion & CAGR)
- 8.5.3 Middle East & Africa Cosmetics Contract Manufacturing Market Size, By Gels, By Value, 2018H-2028F (USD Billion & CAGR)
- 8.5.4 Middle East & Africa Cosmetics Contract Manufacturing Market Size, By Liquids & Suspensions, By Value, 2018H-2028F (USD Billion & CAGR)
- 8.5.5 Middle East & Africa Cosmetics Contract Manufacturing Market Size, By Other Product Forms, By Value, 2018H-2028F (USD Billion & CAGR)
- 8.6 Middle East & Africa Cosmetics Contract Manufacturing Market Segmentation: By Cosmetic Type
- 8.6.1 Middle East & Africa Cosmetics Contract Manufacturing Market, By Cosmetic Type Overview
- 8.6.2 Middle East & Africa Cosmetics Contract Manufacturing Market Size, By Organic, By Value, 2018H-2028F (USD Billion & CAGR)
- 8.6.3 Middle East & Africa Cosmetics Contract Manufacturing Market Size, By Conventional, By Value, 2018H-2028F (USD Billion & CAGR)
9. Market Dynamics
- 9.1 Impact assessment of Market Dynamics on the Global Cosmetics Contract Manufacturing Market
- 9.2 Drivers
- 9.3 Restraints
- 9.4 Trends
10. Industry Ecosystem Analysis
- 10.1 Macro-Economic Factor Assessment
- 10.2 Value Chain Analysis
- 10.3 Porter Analysis
11. Competitive Positioning
- 11.1 Companies' Product Positioning
- 11.2 Market Position Matrix
- 11.3 Market Share Analysis of Cosmetics Contract Manufacturing Market
- 11.4 Company Profiles
- 11.4.1 KDC/ONE
- 11.4.2 Intercos
- 11.4.3 Tokiwa Corporation
- 11.4.4 Kolmar Korea
- 11.4.5 Oxygen Development
- 11.4.6 Mana Products
- 11.4.7 HSA Cosmetics
- 11.4.8 Nox Bellcow Cosmetics
- 11.4.9 Faber Castell Cosmetics
- 11.4.10 Art Cosmetics