|
|
市場調査レポート
商品コード
1207787
人工ケーシングの世界市場 - 製品タイプ別、エンドユーザー別、販売チャネル別、地域別、国別:市場規模、考察、競合、COVID-19の影響、予測(2023年~2028年)Global Artificial Casings Market (Value, Volume) - Analysis, By Product Type (Collagen, Cellulose, Fibrous, Plastic, Vegan), End-User, Sales Channel, By Region, By Country: Market Size, Insights, Competition, Covid-19 Impact and Forecast (2023-2028) |
||||||
|
|
|||||||


| 人工ケーシングの世界市場 - 製品タイプ別、エンドユーザー別、販売チャネル別、地域別、国別:市場規模、考察、競合、COVID-19の影響、予測(2023年~2028年) |
|
出版日: 2023年01月31日
発行: Azoth Analytics
ページ情報: 英文 260 Pages
納期: 即納可能
|
- 全表示
- 概要
- 図表
- 目次
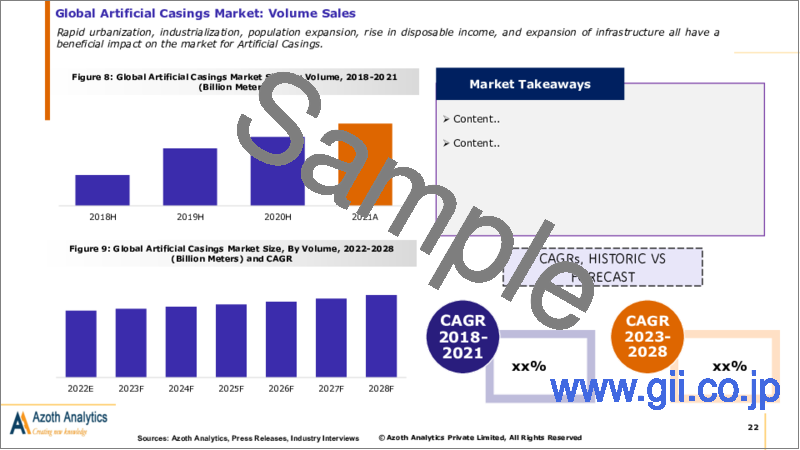
世界の人工ケーシングの市場規模は、2021年に32億3,000万米ドルに達し、2023年~2028年の間にCAGR6.1%で成長すると予測されています。市場を牽引するのは、肉の消費量の増加、都市化人口の急速な拡大、ソーセージの効果的で健康的なパッケージに対する需要増加です。さらに、クイックサービスレストランの増加も市場成長の原動力となっています。
当レポートでは、世界の人工ケーシング市場について調査分析し、市場動向、市場規模と予測、セグメント別・地域別の市場分析、競合分析、主要企業プロファイルなどを提供しています
目次
第1章 市場の背景
- 範囲と製品の見通し
- エグゼクティブサマリー
- 調査手法
第2章 戦略的推奨事項
第3章 世界の人工ケーシング市場:実績と予測(2018年~2028年)
- マクロ経済要因の影響分析
- エコシステム分析
- 食用ケーシングにおけるコラーゲンの位置付け
- 小売ソーセージ発売統計
- トップソーセージ輸出国に関する洞察
- 人工腸の輸出に関する洞察
- ダッシュボード
- 市場規模とCAGR(2018年~2028年)
- 販売量とCAGR(2018年~2028年)
- 平均販売価格分析
- COVID-19の影響
- 市場セグメンテーション:タイプ別
- 市場概要:タイプ別
- 市場規模とCAGR:コラーゲンケーシング(2018年~2028年)
- 市場規模とCAGR:セルロースケーシング(2018年~2028年)
- 市場規模とCAGR:繊維ケーシング(2018年~2028年)
- 市場規模とCAGR:プラスチックケーシング(2018年~2028年)
- 市場規模とCAGR:ビーガンケーシング(2018年~2028年)
- 市場セグメンテーション:エンドユーザー別
- 市場概要:エンドユーザー別
- 市場規模とCAGR:食品加工会社(2018年~2028年)
- 市場規模とCAGR:フードサービスプロバイダー(2018年~2028年)
- 市場規模とCAGR:食品小売業者(2018年~2028年)
- 市場セグメンテーション:販売チャネル別
- 市場概要:販売チャネル別
- 市場規模とCAGR:オフラインチャネル(2018年~2028年)
- 市場規模とCAGR:オンラインチャネル(2018年~2028年)
第4章 世界の人工ケーシング市場:地域分析
- 調査対象地域
- 地域のスナップショット
第5章 南北アメリカの人工ケーシング市場:実績と予測(2018年~2028年)
- スナップショット
- 市場規模とCAGR(2018年~2028年)
- 販売量とCAGR(2018年~2028年)
- 主な要因
- 市場セグメンテーション:タイプ別
- 市場概要:タイプ別
- 市場規模とCAGR:コラーゲンケーシング(2018年~2028年)
- 市場規模とCAGR:セルロースケーシング(2018年~2028年)
- 市場規模とCAGR:繊維ケーシング(2018年~2028年)
- 市場規模とCAGR:プラスチックケーシング(2018年~2028年)
- 市場規模とCAGR:ビーガンケーシング(2018年~2028年)
- 市場セグメンテーション:エンドユーザー別
- 市場概要:エンドユーザー別
- 市場規模とCAGR:食品加工会社(2018年~2028年)
- 市場規模とCAGR:フードサービスプロバイダー(2018年~2028年)
- 市場規模とCAGR:食品小売業者(2018年~2028年)
- 市場セグメンテーション:販売チャネル別
- 市場概要:販売チャネル別
- 市場規模とCAGR:オフラインチャネル(2018年~2028年)
- 市場規模とCAGR:オンラインチャネル(2018年~2028年)
- 市場セグメンテーション:国別
- 市場規模とCAGR:米国(2018年~2028年)
- 市場規模とCAGR:カナダ(2018年~2028年)
- 市場規模とCAGR:ブラジル(2018年~2028年)
- 市場規模とCAGR:その他南北アメリカ(2018年~2028年)
第6章 欧州の人工ケーシング市場:実績と予測(2018年~2028年)
- スナップショット
- 市場規模とCAGR(2018年~2028年)
- 販売量とCAGR(2018年~2028年)
- 主な要因
- 市場セグメンテーション:タイプ別
- 市場概要:タイプ別
- 市場規模とCAGR:コラーゲンケーシング(2018年~2028年)
- 市場規模とCAGR:セルロースケーシング(2018年~2028年)
- 市場規模とCAGR:繊維ケーシング(2018年~2028年)
- 市場規模とCAGR:プラスチックケーシング(2018年~2028年)
- 市場規模とCAGR:ビーガンケーシング(2018年~2028年)
- 市場セグメンテーション:エンドユーザー別
- 市場概要:エンドユーザー別
- 市場規模とCAGR:食品加工会社(2018年~2028年)
- 市場規模とCAGR:フードサービスプロバイダー(2018年~2028年)
- 市場規模とCAGR:食品小売業者(2018年~2028年)
- 市場セグメンテーション:販売チャネル別
- 市場概要:販売チャネル別
- 市場規模とCAGR:オフラインチャネル(2018年~2028年)
- 市場規模とCAGR:オンラインチャネル(2018年~2028年)
- 市場セグメンテーション:国別
- 市場概要:国別
- 市場規模とCAGR:ドイツ(2018年~2028年)
- 市場規模とCAGR:英国(2018年~2028年)
- 市場規模とCAGR:フランス(2018年~2028年)
- 市場規模とCAGR:スペイン(2018年~2028年)
- 市場規模とCAGR:その他欧州(2018年~2028年)
第7章 アジア太平洋の人工ケーシング市場:実績と予測(2018年~2028年)
- スナップショット
- 市場規模とCAGR(2018年~2028年)
- 販売量とCAGR(2018年~2028年)
- 主な要因
- 市場セグメンテーション:タイプ別
- 市場概要:タイプ別
- 市場規模とCAGR:コラーゲンケーシング(2018年~2028年)
- 市場規模とCAGR:セルロースケーシング(2018年~2028年)
- 市場規模とCAGR:繊維ケーシング(2018年~2028年)
- 市場規模とCAGR:プラスチックケーシング(2018年~2028年)
- 市場規模とCAGR:ビーガンケーシング(2018年~2028年)
- 市場セグメンテーション:エンドユーザー別
- 市場概要:エンドユーザー別
- 市場規模とCAGR:食品加工会社(2018年~2028年)
- 市場規模とCAGR:フードサービスプロバイダー(2018年~2028年)
- 市場規模とCAGR:食品小売業者(2018年~2028年)
- 市場セグメンテーション:販売チャネル別
- 市場概要:販売チャネル別
- 市場規模とCAGR:オフラインチャネル(2018年~2028年)
- 市場規模とCAGR:オンラインチャネル(2018年~2028年)
- 市場セグメンテーション:国別
- 市場概要:国別
- 市場規模とCAGR:中国(2018年~2028年)
- 市場規模とCAGR:日本(2018年~2028年)
- 市場規模とCAGR:韓国(2018年~2028年)
- 市場規模とCAGR:その他アジア太平洋(2018年~2028年)
第8章 中東・アフリカの人工ケーシング市場:実績と予測(2018年~2028年)
- スナップショット
- 市場規模とCAGR(2018年~2028年)
- 販売量とCAGR(2018年~2028年)
- 主な要因
- 市場セグメンテーション:タイプ別
- 市場概要:タイプ別
- 市場規模とCAGR:コラーゲンケーシング(2018年~2028年)
- 市場規模とCAGR:セルロースケーシング(2018年~2028年)
- 市場規模とCAGR:繊維ケーシング(2018年~2028年)
- 市場規模とCAGR:プラスチックケーシング(2018年~2028年)
- 市場規模とCAGR:ビーガンケーシング(2018年~2028年)
- 市場セグメンテーション:エンドユーザー別
- 市場概要:エンドユーザー別
- 市場規模とCAGR:食品加工会社(2018年~2028年)
- 市場規模とCAGR:フードサービスプロバイダー(2018年~2028年)
- 市場規模とCAGR:食品小売業者(2018年~2028年)
- 市場セグメンテーション:販売チャネル別
- 市場概要:販売チャネル別
- 市場規模とCAGR:オフラインチャネル(2018年~2028年)
- 市場規模とCAGR:オンラインチャネル(2018年~2028年)
第9章 市場力学
- 世界の人工ケーシング市場に対する市場力学の影響評価
- 促進要因
- 抑制要因
- 動向
第10章 産業エコシステム分析
- マクロ経済要因の評価
- バリューチェーン分析
- ポーターのファイブフォースモデル
第11章 競合ポジショニング
- 企業の製品ポジショニング
- 市場ポジションマトリックス
- 人工ソーセージケーシングメーカー:専門別
- 人工ケーシング市場の市場シェア分析
- 企業プロファイル
- Kalle Gmbh
- Viscofan
- Devro PLC
- Viskase Cos. Inc.
- Visko Teepak
- Shenguan Holdings(Group)Limited
- DAT-Schaub
- Selo BV
- Nippi Incorporated
- Nitta Casings
List of Figures
List of Figures
- Figure 1: Collagen Share of Edible Casings (by Volume)
- Figure 2: Share of Top 10 Sausage Exporting Countries, 2021
- Figure 3: Global Artificial Casings Market, Historical Period Analysis, 2018-2021 (USD Billion)
- Figure 4: Global Artificial Casings Market, Actual & Forecast Period Analysis, 2022-2028 (USD Billion)
- Figure 5: Global Artificial Casings Market Size, By Value, 2018-2021 (USD Million)
- Figure 6: Global Artificial Casings Market Size, By Value, 2022-2028 (USD Million)
- Figure 7: Global Artificial Casings Market Share, By Type, 2021 (%)
- Figure 8: Global Artificial Casings Market Size, By Volume, 2018-2021 (Billion Meters)
- Figure 9: Global Artificial Casings Market Size, By Volume, 2022-2028 (Billion Meters) and CAGR
- Figure 10: Average Artificial Casings Price, By Region, 2021 (USD/Tonnes)
- Figure 11: Global Artificial Casings Market Size, By Collagen Casing, By Value, 2018H-2028F (USD Million & CAGR)
- Figure 12: Global Artificial Casings Market Absolute Opportunity, By Collagen Casing, 2018-2028 (USD Million)
- Figure 13: Global Artificial Casings Market Size, By Cellulose Casing, By Value, 2018H-2028F (USD Million & CAGR)
- Figure 14: Global Artificial Casings Market Absolute Opportunity, By Cellulose Casing, 2018-2028 (USD Million)
- Figure 15: Global Artificial Casings Market Size, By Fibrous Casing, By Value, 2018H-2028F (USD Million & CAGR)
- Figure 16: Global Artificial Casings Market Absolute Opportunity, By Fibrous Casing, 2018-2028 (USD Million)
- Figure 17: Global Artificial Casings Market Size, By Plastic Casing, By Value, 2018H-2028F (USD Million & CAGR)
- Figure 18: Global Artificial Casings Market Absolute Opportunity, By Plastic Casing, 2018-2028 (USD Million)
- Figure 19: Global Artificial Casings Market Size, By Vegan Casing, By Value, 2018H-2028F (USD Million & CAGR)
- Figure 20: Global Artificial Casings Market Absolute Opportunity, By Vegan Casing, 2018-2028 (USD Million)
- Figure 21: Global Artificial Casings Market Size, By Food processing companies, By Value, 2018H-2028F (USD Million & CAGR)
- Figure 22: Global Artificial Casings Market Absolute Opportunity, By Food Processing Companies, 2018-2028 (USD Million)
- Figure 23: Global Artificial Casings Market Size, By Food Service Providers, By Value, 2018H-2028F (USD Million & CAGR)
- Figure 24: Global Artificial Casings Market Absolute Opportunity, By Food Service Providers, 2018-2028 (USD Million)
- Figure 25: Global Artificial Casings Market Size, By Food Retailer, By Value, 2018H-2028F (USD Million & CAGR)
- Figure 26: Global Artificial Casings Market Absolute Opportunity, By Food Retailer, 2018-2028 (USD Million)
- Figure 27: Global Artificial Casings Market Size, By Offline Sales Channel, By Value, 2018H-2028F (USD Million & CAGR)
- Figure 28: Global Artificial Casings Market Absolute Opportunity, By Offline Sales Channel, 2018-2028 (USD Million)
- Figure 29: Global Artificial Casings Market Size, By Online Sales Channel, By Value, 2018H-2028F (USD Million & CAGR)
- Figure 30: Global Artificial Casings Market Absolute Opportunity, By Online Sales Channel, 2018-2028 (USD Million)
- Figure 31: Americas Artificial Casings Market Size, By Value, 2018H-2028F (USD Million)
- Figure 32: Americas Artificial Casings Market Share, By Type, 2021 (%)
- Figure 33: Americas Artificial Casings Market Size, By Volume, 2018H-2028F (Billion Meters) and CAGR
- Figure 34: Americas Artificial Casings Market, By Collagen Casing, By Value, 2018H-2028F (USD Million & CAGR)
- Figure 35: Americas Artificial Casings Market, By Cellulose Casing, By Value, 2018H-2028F (USD Million & CAGR)
- Figure 36: Americas Artificial Casings Market, By Fibrous Casing, By Value, 2018H-2028F (USD Million & CAGR)
- Figure 37: Americas Artificial Casings Market, By Plastic Casing, By Value, 2018H-2028F (USD Million & CAGR)
- Figure 38: Americas Artificial Casings Market, By Vegan Casing, By Value, 2018H-2028F (USD Million & CAGR)
- Figure 39: Americas Artificial Casings Market, By Food processing companies, By Value, 2018H-2028F (USD Million & CAGR)
- Figure 40: Americas Artificial Casings Market, By Food Service Providers, By Value, 2018H-2028F (USD Million & CAGR)
- Figure 41: Americas Artificial Casings Market, By Food Retailers, By Value, 2018H-2028F (USD Million & CAGR)
- Figure 42: Americas Artificial Casings Market, By Offline Sales Channel, By Value, 2018H-2028F (USD Million & CAGR)
- Figure 43: Americas Artificial Casings Market, By Online Sales Channel, By Value, 2018H-2028F (USD Million & CAGR)
- Figure 44: United States Artificial Casings Market, By Value, 2018-2028 (USD Million & CAGR)
- Figure 45: United States Artificial Casings Market Value, By Type, 2021 (USD Million)
- Figure 46: United States Artificial Casings Market Share, By Type, By Value, 2021 (%)
- Figure 47: United States Artificial Casings Market Share, By End-User, By Value, 2021 (%)
- Figure 48: United States Artificial Casings Market Share, By Sales Channel, By Value, 2021 (%)
- Figure 49: Canada Artificial Casings Market, By Value, 2018-2028 (USD Million & CAGR)
- Figure 50: Canada Artificial Casings Market Value, By Type, 2021 (USD Million)
- Figure 51: Canada Artificial Casings Market Share, By Type, By Value, 2021 (%)
- Figure 52: Canada Artificial Casings Market Share, By End-User, By Value, 2021 (%)
- Figure 53: Canada Artificial Casings Market Share, By Sales Channel, By Value, 2021 (%)
- Figure 54: Brazil Artificial Casings Market, By Value, 2018-2028 (USD Million & CAGR)
- Figure 55: Brazil Artificial Casings Market Value, By Type, 2021 (USD Million)
- Figure 56: Brazil Artificial Casings Market Share, By Type, By Value, 2021 (%)
- Figure 57: Brazil Artificial Casings Market Share, By End-User, By Value, 2021 (%)
- Figure 58: Brazil Artificial Casings Market Share, By Sales Channel, By Value, 2021 (%)
- Figure 59: Rest of Americas Artificial Casings Market, By Value, 2018-2028 (USD Million & CAGR)
- Figure 60: Rest of Americas Artificial Casings Market Value, By Type, 2021 (USD Million)
- Figure 61: Rest of Americas Artificial Casings Market Share, By Type, By Value, 2021 (%)
- Figure 62: Rest of Americas Artificial Casings Market Share, By End-User, By Value, 2021 (%)
- Figure 63: Rest of Americas Artificial Casings Market Share, By Sales Channel, By Value, 2021 (%)
- Figure 64: Europe Artificial Casings Market Size, By Value, 2018H-2028F (USD Million)
- Figure 65: Europe Artificial Casings Market Share, By Type, 2021 (%)
- Figure 66: Europe Artificial Casings Market Size, By Volume, 2018H-2028F (Billion Meters) and CAGR
- Figure 67: Europe Artificial Casings Market, By Collagen Casing, By Value, 2018H-2028F (USD Million & CAGR)
- Figure 68: Europe Artificial Casings Market, By Cellulose Casing, By Value, 2018H-2028F (USD Million & CAGR)
- Figure 69: Europe Artificial Casings Market, By Fibrous Casing, By Value, 2018H-2028F (USD Million & CAGR)
- Figure 70: Europe Artificial Casings Market, By Plastic Casing, By Value, 2018H-2028F (USD Million & CAGR)
- Figure 71: Europe Artificial Casings Market, By Vegan Casing, By Value, 2018H-2028F (USD Million & CAGR)
- Figure 72: Europe Artificial Casings Market, By Food processing companies, By Value, 2018H-2028F (USD Million & CAGR)
- Figure 73: Europe Artificial Casings Market, By Food Service Providers, By Value, 2018H-2028F (USD Million & CAGR)
- Figure 74: Europe Artificial Casings Market, By Food Retailers, By Value, 2018H-2028F (USD Million & CAGR)
- Figure 75: Europe Artificial Casings Market, By Offline Sales Channel, By Value, 2018H-2028F (USD Million & CAGR)
- Figure 76: Europe Artificial Casings Market, By Online Sales Channel, By Value, 2018H-2028F (USD Million & CAGR)
- Figure 77: Germany Artificial Casings Market, By Value, 2018-2028 (USD Million & CAGR)
- Figure 78: Germany Artificial Casings Market Value, By Type, 2021 (USD Million)
- Figure 79: Germany Artificial Casings Market Share, By Type, By Value, 2021 (%)
- Figure 80: Germany Artificial Casings Market Share, By End-User, By Value, 2021 (%)
- Figure 81: Germany Artificial Casings Market Share, By Sales Channel, By Value, 2021 (%)
- Figure 82: United Kingdom Artificial Casings Market, By Value, 2018-2028 (USD Million & CAGR)
- Figure 83: United Kingdom Artificial Casings Market Value, By Type, 2021 (USD Million)
- Figure 84: United Kingdom Artificial Casings Market Share, By Type, By Value, 2021 (%)
- Figure 85: United Kingdom Artificial Casings Market Share, By End-User, By Value, 2021 (%)
- Figure 86: United Kingdom Artificial Casings Market Share, By Sales Channel, By Value, 2021 (%)
- Figure 87: France Artificial Casings Market, By Value, 2018-2028 (USD Million & CAGR)
- Figure 88: France Artificial Casings Market Value, By Type, 2021 (USD Million)
- Figure 89: France Artificial Casings Market Share, By Type, By Value, 2021 (%)
- Figure 90: France Artificial Casings Market Share, By End-User, By Value, 2021 (%)
- Figure 91: France Artificial Casings Market Share, By Sales Channel, By Value, 2021 (%)
- Figure 92: Spain Artificial Casings Market, By Value, 2018-2028 (USD Million & CAGR)
- Figure 93: Spain Artificial Casings Market Value, By Type, 2021 (USD Million)
- Figure 94: Spain Artificial Casings Market Share, By Type, By Value, 2021 (%)
- Figure 95: Spain Artificial Casings Market Share, By End-User, By Value, 2021 (%)
- Figure 96: Spain Artificial Casings Market Share, By Sales Channel, By Value, 2021 (%)
- Figure 97: Rest of Europe Artificial Casings Market, By Value, 2018-2028 (USD Million & CAGR)
- Figure 98: Rest of Europe Artificial Casings Market Value, By Type, 2021 (USD Million)
- Figure 99: Rest of Europe Artificial Casings Market Share, By Type, By Value, 2021 (%)
- Figure 100: Rest of Europe Artificial Casings Market Share, By End-User, By Value, 2021 (%)
- Figure 101: Rest of Europe Artificial Casings Market Share, By Sales Channel, By Value, 2021 (%)
- Figure 102: Asia Pacific Artificial Casings Market Size, By Value, 2018H-2028F (USD Million)
- Figure 103: Asia Pacific Artificial Casings Market Share, By Type, 2021 (%)
- Figure 104: Asia Pacific Artificial Casings Market Size, By Volume, 2018H-2028F (Billion Meters) and CAGR
- Figure 105: Asia Pacific Artificial Casings Market, By Collagen Casing, By Value, 2018H-2028F (USD Million & CAGR)
- Figure 106: Asia Pacific Artificial Casings Market, By Cellulose Casing, By Value, 2018H-2028F (USD Million & CAGR)
- Figure 107: Asia Pacific Artificial Casings Market, By Fibrous Casing, By Value, 2018H-2028F (USD Million & CAGR)
- Figure 108: Asia Pacific Artificial Casings Market, By Plastic Casing, By Value, 2018H-2028F (USD Million & CAGR)
- Figure 109: Asia Pacific Artificial Casings Market, By Vegan Casing, By Value, 2018H-2028F (USD Million & CAGR)
- Figure 110: Asia Pacific Artificial Casings Market, By Food processing companies, By Value, 2018H-2028F (USD Million & CAGR)
- Figure 111: Asia Pacific Artificial Casings Market, By Food Service Providers, By Value, 2018H-2028F (USD Million & CAGR)
- Figure 112: Asia Pacific Artificial Casings Market, By Food Retailers, By Value, 2018H-2028F (USD Million & CAGR)
- Figure 113: Asia Pacific Artificial Casings Market, By Offline Sales Channel, By Value, 2018H-2028F (USD Million & CAGR)
- Figure 114: Asia Pacific Artificial Casings Market, By Online Sales Channel, By Value, 2018H-2028F (USD Million & CAGR)
- Figure 115: China Artificial Casings Market, By Value, 2018-2028 (USD Million & CAGR)
- Figure 116: China Artificial Casings Market Value, By Type, 2021 (USD Million)
- Figure 117: China Artificial Casings Market Share, By Type, By Value, 2021 (%)
- Figure 118: China Artificial Casings Market Share, By End-User, By Value, 2021 (%)
- Figure 119: China Artificial Casings Market Share, By Sales Channel, By Value, 2021 (%)
- Figure 120: Japan Artificial Casings Market, By Value, 2018-2028 (USD Million & CAGR)
- Figure 121: Japan Artificial Casings Market Value, By Type, 2021 (USD Million)
- Figure 122: Japan Artificial Casings Market Share, By Type, By Value, 2021 (%)
- Figure 123: Japan Artificial Casings Market Share, By End-User, By Value, 2021 (%)
- Figure 124: Japan Artificial Casings Market Share, By Sales Channel, By Value, 2021 (%)
- Figure 125: South Korea Artificial Casings Market, By Value, 2018-2028 (USD Million & CAGR)
- Figure 126: South Korea Artificial Casings Market Value, By Type, 2021 (USD Million)
- Figure 127: South Korea Artificial Casings Market Share, By Type, By Value, 2021 (%)
- Figure 128: South Korea Artificial Casings Market Share, By End-User, By Value, 2021 (%)
- Figure 129: South Korea Artificial Casings Market Share, By Sales Channel, By Value, 2021 (%)
- Figure 130: Rest of Asia Pacific Artificial Casings Market, By Value, 2018-2028 (USD Million & CAGR)
- Figure 131: Rest of Asia Pacific Artificial Casings Market Value, By Type, 2021 (USD Million)
- Figure 132: Rest of Asia Pacific Artificial Casings Market Share, By Type, By Value, 2021 (%)
- Figure 133: Rest of Asia Pacific Artificial Casings Market Share, By End-User, By Value, 2021 (%)
- Figure 134: Rest of Asia Pacific Artificial Casings Market Share, By Sales Channel, By Value, 2021 (%)
- Figure 135: Middle East & Africa Artificial Casings Market Size, By Value, 2018H-2028F (USD Million)
- Figure 136: Middle East & Africa Artificial Casings Market Share, By Type, 2021 (%)
- Figure 137: Middle East & Africa Artificial Casings Market Size, By Volume, 2018H-2028F (Billion Meters) and CAGR
- Figure 138: Middle East & Africa Artificial Casings Market, By Collagen Casing, By Value, 2018H-2028F (USD Million & CAGR)
- Figure 139: Middle East & Africa Artificial Casings Market, By Cellulose Casing, By Value, 2018H-2028F (USD Million & CAGR)
- Figure 140: Middle East & Africa Artificial Casings Market, By Fibrous Casing, By Value, 2018H-2028F (USD Million & CAGR)
- Figure 141: Middle East & Africa Artificial Casings Market, By Plastic Casing, By Value, 2018H-2028F (USD Million & CAGR)
- Figure 142: Middle East & Africa Artificial Casings Market, By Vegan Casing, By Value, 2018H-2028F (USD Million & CAGR)
- Figure 143: Middle East & Africa Artificial Casings Market, By Food processing companies, By Value, 2018H-2028F (USD Million & CAGR)
- Figure 144: Middle East & Africa Artificial Casings Market, By Food Service Providers, By Value, 2018H-2028F (USD Million & CAGR)
- Figure 145: Middle East & Africa Artificial Casings Market, By Food Retailers, By Value, 2018H-2028F (USD Million & CAGR)
- Figure 146: Middle East & Africa Artificial Casings Market, By Offline Sales Channel, By Value, 2018H-2028F (USD Million & CAGR)
- Figure 147: Middle East & Africa Artificial Casings Market, By Online Sales Channel, By Value, 2018H-2028F (USD Million & CAGR)
- Figure 148: Global Impact of Drivers and Restraints
- Figure 149: Market Share of Prominent Companies of Artificial Casings, 2021 (%)
- Figure 150: Viscofan Revenues, 2019-2021 (USD Million)
- Figure 151: Viscofan Revenue, By Business segments, 2021 (%)
- Figure 152: Viscofan Revenue, By Geographical segments, 2021 (%)
- Figure 153: Devro Plc. Revenues, 2019-2021 (USD Million)
- Figure 154: Devro Plc. Revenue, By Geographical Segments, 2021 (%)
- Figure 155: Viskase Cos. Inc. Revenues, 2019-2021 (USD Million)
- Figure 156: Viskase Cos. Inc. Revenue , By Geographical Segments, 2021 (%)
- Figure 157: Shenguan Holdings (Group) Limited Inc. Revenues, 2019-2021 (USD Million)
- Figure 158: Shenguan Holdings (Group) Limited, Revenue , By Geographical Segments, 2021 (%)
List of Tables
Table A1: Global Impact of Macro Economic Factors, By Region
Table A2: Number of Global Retail Sausage Launch
Table A3: Artificial guts (sausage casings) of hardened protein or of cellulosic materials exports by country in 2021
Table A4: United States Artificial Casings Market, By Type, By Value, 2018-2021 (USD Million)
Table A5: United States Artificial Casings Market, By Type, By Value, 2022-2028 (USD Million)
Table A6: United States Artificial Casings Market, By End-User, By Value, 2018-2021 (USD Million)
Table A7: United States Artificial Casings Market, By End-User, By Value, 2022-2028 (USD Million)
Table A8: United States Artificial Casings Market, By Sales Channel, By Value, 2018-2021 (USD Million)
Table A9: United States Artificial Casings Market, By Sales Channel, By Value, 2022-2028 (USD Million)
Table A10: Canada Artificial Casings Market, By Type, By Value, 2018-2021 (USD Million)
Table A11: Canada Artificial Casings Market, By Type, By Value, 2022-2028 (USD Million)
Table A12: Canada Artificial Casings Market, By End-User, By Value, 2018-2021 (USD Million)
Table A13: Canada Artificial Casings Market, By End-User, By Value, 2022-2028 (USD Million)
Table A14: Canada Artificial Casings Market, By Sales Channel, By Value, 2018-2021 (USD Million)
Table A15: Canada Artificial Casings Market, By Sales Channel, By Value, 2022-2028 (USD Million)
Table A16: Brazil Artificial Casings Market, By Type, By Value, 2018-2021 (USD Million)
Table A17: Brazil Artificial Casings Market, By Type, By Value, 2022-2028 (USD Million)
Table A18: Brazil Artificial Casings Market, By End-User, By Value, 2018-2021 (USD Million)
Table A19: Brazil Artificial Casings Market, By End-User, By Value, 2022-2028 (USD Million)
Table A20: Brazil Artificial Casings Market, By Sales Channel, By Value, 2018-2021 (USD Million)
Table A21: Brazil Artificial Casings Market, By Sales Channel, By Value, 2022-2028 (USD Million)
Table A22: Rest of Americas Artificial Casings Market, By Type, By Value, 2018-2021 (USD Million)
Table A23: Rest of Americas Artificial Casings Market, By Type, By Value, 2022-2028 (USD Million)
Table A24: Rest of Americas Artificial Casings Market, By End-User, By Value, 2018-2021 (USD Million)
Table A25: Rest of Americas Artificial Casings Market, By End-User, By Value, 2022-2028 (USD Million)
Table A26: Rest of Americas Artificial Casings Market, By Sales Channel, By Value, 2018-2021 (USD Million)
Table A27: Rest of Americas Artificial Casings Market, By Sales Channel, By Value, 2022-2028 (USD Million)
Table A28: Germany Artificial Casings Market, By Type, By Value, 2018-2021 (USD Million)
Table A29: Germany Artificial Casings Market, By Type, By Value, 2022-2028 (USD Million)
Table A30: Germany Artificial Casings Market, By End-User, By Value, 2018-2021 (USD Million)
Table A31: Germany Artificial Casings Market, By End-User, By Value, 2022-2028 (USD Million)
Table A32: Germany Artificial Casings Market, By Sales Channel, By Value, 2018-2021 (USD Million)
Table A33: Germany Artificial Casings Market, By Sales Channel, By Value, 2022-2028 (USD Million)
Table A34: United Kingdom Artificial Casings Market, By Type, By Value, 2018-2021 (USD Million)
Table A35: United Kingdom Artificial Casings Market, By Type, By Value, 2022-2028 (USD Million)
Table A36: United Kingdom Artificial Casings Market, By End-User, By Value, 2018-2021 (USD Million)
Table A37: United Kingdom Artificial Casings Market, By End-User, By Value, 2022-2028 (USD Million)
Table A38: United Kingdom Artificial Casings Market, By Sales Channel, By Value, 2018-2021 (USD Million)
Table A39: United Kingdom Artificial Casings Market, By Sales Channel, By Value, 2022-2028 (USD Million)
Table A40: France Artificial Casings Market, By Type, By Value, 2018-2021 (USD Million)
Table A41: France Artificial Casings Market, By Type, By Value, 2022-2028 (USD Million)
Table A42: France Artificial Casings Market, By End-User, By Value, 2018-2021 (USD Million)
Table A43: France Artificial Casings Market, By End-User, By Value, 2022-2028 (USD Million)
Table A44: France Artificial Casings Market, By Sales Channel, By Value, 2018-2021 (USD Million)
Table A45: France Artificial Casings Market, By Sales Channel, By Value, 2022-2028 (USD Million)
Table A46: Spain Artificial Casings Market, By Type, By Value, 2018-2021 (USD Million)
Table A47: Spain Artificial Casings Market, By Type, By Value, 2022-2028 (USD Million)
Table A48: Spain Artificial Casings Market, By End-User, By Value, 2018-2021 (USD Million)
Table A49: Spain Artificial Casings Market, By End-User, By Value, 2022-2028 (USD Million)
Table A50: Spain Artificial Casings Market, By Sales Channel, By Value, 2018-2021 (USD Million)
Table A51: Spain Artificial Casings Market, By Sales Channel, By Value, 2022-2028 (USD Million)
Table A52: Rest of Europe Artificial Casings Market, By Type, By Value, 2018-2021 (USD Million)
Table A53: Rest of Europe Artificial Casings Market, By Type, By Value, 2022-2028 (USD Million)
Table A54: Rest of Europe Artificial Casings Market, By End-User, By Value, 2018-2021 (USD Million)
Table A55: Rest of Europe Artificial Casings Market, By End-User, By Value, 2022-2028 (USD Million)
Table A56: Rest of Europe Artificial Casings Market, By Sales Channel, By Value, 2018-2021 (USD Million)
Table A57: Rest of Europe Artificial Casings Market, By Sales Channel, By Value, 2022-2028 (USD Million)
Table A58: China Artificial Casings Market, By Type, By Value, 2018-2021 (USD Million)
Table A59: China Artificial Casings Market, By Type, By Value, 2022-2028 (USD Million)
Table A60: China Artificial Casings Market, By End-User, By Value, 2018-2021 (USD Million)
Table A61: China Artificial Casings Market, By End-User, By Value, 2022-2028 (USD Million)
Table A62: China Artificial Casings Market, By Sales Channel, By Value, 2018-2021 (USD Million)
Table A63: China Artificial Casings Market, By Sales Channel, By Value, 2022-2028 (USD Million)
Table A64: Japan Artificial Casings Market, By Type, By Value, 2018-2021 (USD Million)
Table A65: Japan Artificial Casings Market, By Type, By Value, 2022-2028 (USD Million)
Table A66: Japan Artificial Casings Market, By End-User, By Value, 2018-2021 (USD Million)
Table A67: Japan Artificial Casings Market, By End-User, By Value, 2022-2028 (USD Million)
Table A68: Japan Artificial Casings Market, By Sales Channel, By Value, 2018-2021 (USD Million)
Table A69: Japan Artificial Casings Market, By Sales Channel, By Value, 2022-2028 (USD Million)
Table A70: South Korea Artificial Casings Market, By Type, By Value, 2018-2021 (USD Million)
Table A71: South Korea Artificial Casings Market, By Type, By Value, 2022-2028 (USD Million)
Table A72: South Korea Artificial Casings Market, By End-User, By Value, 2018-2021 (USD Million)
Table A73: South Korea Artificial Casings Market, By End-User, By Value, 2022-2028 (USD Million)
Table A74: South Korea Artificial Casings Market, By Sales Channel, By Value, 2018-2021 (USD Million)
Table A75: South Korea Artificial Casings Market, By Sales Channel, By Value, 2022-2028 (USD Million)
Table A76: Rest of Asia Pacific Artificial Casings Market, By Type, By Value, 2018-2021 (USD Million)
Table A77: Rest of Asia Pacific Artificial Casings Market, By Type, By Value, 2022-2028 (USD Million)
Table A78: Rest of Asia Pacific Artificial Casings Market, By End-User, By Value, 2018-2021 (USD Million)
Table A79: Rest of Asia Pacific Artificial Casings Market, By End-User, By Value, 2022-2028 (USD Million)
Table A80: Rest of Asia Pacific Artificial Casings Market, By Sales Channel, By Value, 2018-2021 (USD Million)
Table A81: Rest of Asia Pacific Artificial Casings Market, By Sales Channel, By Value, 2022-2028 (USD Million)
Table A82: Artificial sausage casing manufacturers by specialty
Table A83: Key Company Financials, 2019-2021
Table A84: Key Company Financials, 2019-2021
Table A85: Key Company Financials, 2019-2021
Table A86: Key Company Financials, 2019-2021
Executive Summary
The Global Artificial Casings market was worth USD 3.23 Billion in 2021 and is anticipated to expand at a CAGR of 6.1% between 2023 and 2028. The market is driven by the rising consumption of meat, rapid expansion of the urbanized population and demand for effective and healthy packaging for sausages. Furthermore, the increasing number of Quick service restaurants is also driving the market growth.
Collagen Casings hold the largest share of the Global Artificial Casings Market in 2021 and is anticipated to lead the market segment during the forecast period. Collagen Casings are affordable, and provide better weight and size control of the sausage over natural casings. Further, manufacturers are focusing on innovative technologies to cater to the demand for collagen sausage casings.
The trend of artificial casing is a strong focus on plant-based diets in western regions and among the vegetarian population. Demand for Vegan casing is composed of entirely non-animal based polymers with unique texture and appearance, without affecting the nutritional content of the main product.
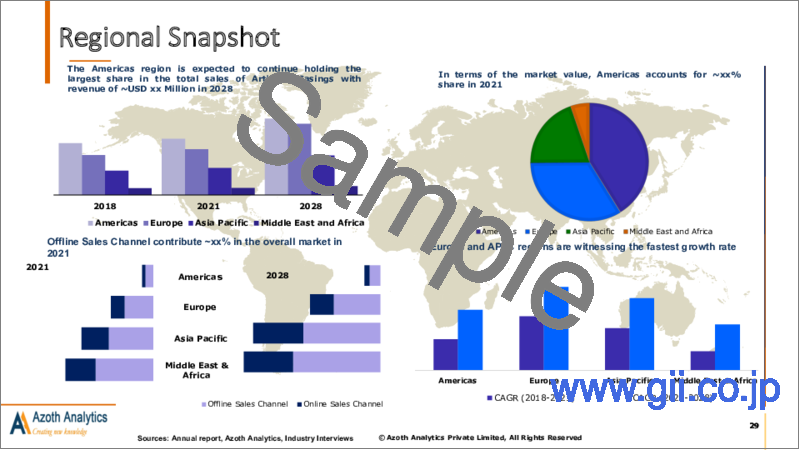
Manufacturers are thus focusing on upgraded and modified products with rising demand for new formulations from the food and beverage industry, which has increased over time the usage of the vegan casing. For instance, in the year 2020, Loryma and Viscofan partnered to develop a Wheat-Based Concept for Meat-Free Sausages. In terms of market value, North America accounts for a major share in 2021 and the region is expected to continue holding the largest share in the total sales of Artificial Casings during the forecast period.
Scope of the Report
- The report analyses the Artificial Casings Market by Value (USD Million).
- The report analyses the Artificial Casings Market by Volume (Billion Meters).
- The report presents the analysis of the Artificial Casings market for the historical period of 2018-2021, the base year 2022 and the forecast period of 2023-2028.
- The report analyses the Artificial Casings Market By Product Type (Collagen Casing, Cellulose Casings, Fibrous Casings, Plastic Casings, Vegan Casings)
- The report analyses the Artificial Casings Market By End-User (Food processing companies, Food Service Providers, Food Retailers).
- The report analyses the Artificial Casings Market By Sales Channel (Online Channel, Offline Channel)
- The Global Artificial Casings Market has been analysed by countries (United States, Brazil, Canada, Germany, UK, France, Spain, China, Japan, South Korea).
- The key insights of the report have been presented through the frameworks of SWOT and Porter's Five Forces Analysis. Also, the attractiveness of the market has been presented by region, By Product type and Sales channel
- Also, the major opportunities, trends, drivers and challenges of the industry have been analysed in the report.
- The report tracks competitive developments, strategies, mergers and acquisitions and new product development. The companies profiled in the report include Kalle Gmbh, Viscofan, Devro PLC, Viskase Cos. Inc., ViskoTeepak, Shenguan Holdings (Group) Limited, DAT-Schaub, Selo BV, Nippi Incorporated,Nitta Casings
Key Target Audience
- Leading Artificial Casings Companies
- Packaging Companies
- Consulting Companies
- Investment Banks and Equity Firms
Table of Contents
1. Market Background
- 1.1 Scope and Product Outlook
- 1.2 Executive Summary
- 1.3 Research Methodology
2. Strategic Recommendations
3. Global Artificial Casings Market: Historic and Forecast (2018-2028)
- 3.1 Impact Analysis of Macro Economic Factors on the Artificial Casings Market
- 3.2 Global Artificial Casings Market: Ecosystem Analysis
- 3.2.1 Positioning of Collagen in Edible Casings
- 3.2.2 Retail Sausage Launch Statistics
- 3.2.3 Insights on Top Sausage Exporting Countries
- 3.2.4 Export Insights on Artificial Guts
- 3.3 Global Artificial Casings Market: Dashboard
- 3.4 Global Artificial Casings Market: Market Size and CAGR, 2018-2028 (USD Million & CAGR)
- 3.5 Global Artificial Casings Market: Volume Sales and CAGR, 2018-2028 (Billion Meters)
- 3.6 Average Selling Price Analysis of the Artificial Casings Market
- 3.7 Impact of COVID-19 on the Artificial Casings Market
- 3.8 Global Artificial Casings Market Segmentation: By Type
- 3.8.1 Global Artificial Casings Market, By Type Overview
- 3.8.2 Global Artificial Casings Market Size, By Collagen Casings, By Value, 2018H-2028F (USD Million & CAGR)
- 3.8.3 Global Artificial Casings Market Size, By Cellulose Casings, By Value, 2018H-2028F (USD Million & CAGR)
- 3.8.4 Global Artificial Casings Market Size, By Fibrous Casings, By Value, 2018H-2028F (USD Million & CAGR)
- 3.8.5 Global Artificial Casings Market Size, By Plastic Casings, By Value, 2018H-2028F (USD Million & CAGR)
- 3.8.6 Global Artificial Casings Market Size, By Vegan Casings, By Value, 2018H-2028F (USD Million & CAGR)
- 3.9 Global Artificial Casings Market Segmentation: By End-User
- 3.9.1 Global Artificial Casings Market, By End-User Overview
- 3.9.2 Global Artificial Casings Market Size, By Food Processing Companies, By Value, 2018H-2028F (USD Million & CAGR)
- 3.9.3 Global Artificial Casings Market Size, By Food Service Providers, By Value, 2018H-2028F (USD Million & CAGR)
- 3.9.4 Global Artificial Casings Market Size, By Food Retailers, By Value, 2018H-2028F (USD Million & CAGR)
- 3.10 Global Artificial Casings Market Segmentation: By Sales Channel
- 3.10.1 Global Artificial Casings Market, By Sales Channel Overview
- 3.10.2 Global Artificial Casings Market Size, By Offline Channel, By Value, 2018H-2028F (USD Million & CAGR)
- 3.10.3 Global Artificial Casings Market Size, By Online Channel, By Value, 2018H-2028F (USD Million & CAGR)
4. Global Artificial Casings Market, Region Analysis
- 4.1 Regional Coverage of the Study
- 4.2 Regional Snapshot
5. Americas Artificial Casings Market: Historic and Forecast (2018-2028)
- 5.1 Americas Artificial Casings Market: Snapshot
- 5.2 Americas Artificial Casings Market: Market Size and CAGR, 2018-2028 (USD Million & CAGR)
- 5.3 Americas Artificial Casings Market: Volume Sales and CAGR, 2018-2028 (Billion Meters)
- 5.4 Americas Artificial Casings Market: Key Factors
- 5.5 Americas Artificial Casings Market Segmentation: By Type
- 5.4.1 Americas Artificial Casings Market, By Type Overview
- 5.4.2 Americas Artificial Casings Market Size, By Collagen Casings, By Value, 2018H-2028F (USD Million & CAGR)
- 5.4.3 Americas Artificial Casings Market Size, By Cellulose Casings, By Value, 2018H-2028F (USD Million & CAGR)
- 5.4.4 Americas Artificial Casings Market Size, By Fibrous Casings, By Value, 2018H-2028F (USD Million & CAGR)
- 5.4.5 Americas Artificial Casings Market Size, By Plastic Casings, By Value, 2018H-2028F (USD Million & CAGR)
- 5.4.6 Americas Artificial Casings Market Size, By Vegan Casings, By Value, 2018H-2028F (USD Million & CAGR)
- 5.5 Americas Artificial Casings Market Segmentation: By End-User
- 5.5.1 Americas Artificial Casings Market, By End-User Overview
- 5.5.2 Americas Artificial Casings Market Size, By Food Processing Companies, By Value, 2018H-2028F (USD Million & CAGR)
- 5.5.3 Americas Artificial Casings Market Size, By Food Service Providers, By Value, 2018H-2028F (USD Million & CAGR)
- 5.5.4 Americas Artificial Casings Market Size, By Food Retailers, By Value, 2018H-2028F (USD Million & CAGR)
- 5.6 Americas Artificial Casings Market Segmentation: By Sales Channel
- 5.6.1 Americas Artificial Casings Market, By Sales Channel Overview
- 5.6.2 Americas Artificial Casings Market Size, By Offline Channel, By Value, 2018H-2028F (USD Million & CAGR)
- 5.6.3 Americas Artificial Casings Market Size, By Online Channel, By Value, 2018H-2028F (USD Million & CAGR)
- 5.7 Americas Artificial Casings Market Segmentation: By Country
- 5.7.1 United States Artificial Casings Market: Market Size and CAGR, 2018-2028 (USD Million & CAGR)
- 5.7.1.1 United States Artificial Casings Market, By Type
- 5.7.1.2 United States Artificial Casings Market, By End-User
- 5.7.1.3 United States Artificial Casings Market, By Sales Channel
- 5.7.2 Canada Artificial Casings Market: Market Size and CAGR, 2018-2028 (USD Million & CAGR)
- 5.7.2.1 Canada Artificial Casings Market, By Type
- 5.7.2.2 Canada Artificial Casings Market, By End-User
- 5.7.2.3 Canada Artificial Casings Market, By Sales Channel
- 5.7.3 Brazil Artificial Casings Market: Market Size and CAGR, 2018-2028 (USD Million & CAGR)
- 5.7.3.1 Rest of Americas Artificial Casings Market, By Type
- 5.7.3.2 Rest of Americas Artificial Casings Market, By End-User
- 5.7.3.3 Rest of Americas Artificial Casings Market, By Sales Channel
- 5.7.4 Rest of Americas Artificial Casings Market: Market Size and CAGR, 2018-2028 (USD Million & CAGR)
- 5.7.4.1 Rest of Americas Artificial Casings Market, By Type
- 5.7.4.2 Rest of Americas Artificial Casings Market, By End-User
- 5.7.4.3 Rest of Americas Artificial Casings Market, By Sales Channel
- 5.7.1 United States Artificial Casings Market: Market Size and CAGR, 2018-2028 (USD Million & CAGR)
6. Europe Artificial Casings Market: Historic and Forecast (2018-2028)
- 6.1 Europe Artificial Casings Market: Snapshot
- 6.2 Europe Artificial Casings Market: Market Size and CAGR, 2018-2028 (USD Million & CAGR)
- 6.3 Europe Artificial Casings Market: Volume Sales and CAGR, 2018-2028 (Billion Meters)
- 6.4 Europe Artificial Casings Market: Key Factors
- 6.5 Europe Artificial Casings Market Segmentation: By Type
- 6.5.1 Europe Artificial Casings Market, By Type Overview
- 6.5.2 Europe Artificial Casings Market Size, By Collagen Casings, By Value, 2018H-2028F (USD Million & CAGR)
- 6.5.3 Europe Artificial Casings Market Size, By Cellulose Casings, By Value, 2018H-2028F (USD Million & CAGR)
- 6.5.4 Europe Artificial Casings Market Size, By Fibrous Casings, By Value, 2018H-2028F (USD Million & CAGR)
- 6.5.5 Europe Artificial Casings Market Size, By Plastic Casings, By Value, 2018H-2028F (USD Million & CAGR)
- 6.5.6 Europe Artificial Casings Market Size, By Vegan Casings, By Value, 2018H-2028F (USD Million & CAGR)
- 6.6 Europe Artificial Casings Market Segmentation: By End-User
- 6.6.1 Europe Artificial Casings Market, By End-User Overview
- 6.6.2 Europe Artificial Casings Market Size, By Food Processing Companies, By Value, 2018H-2028F (USD Million & CAGR)
- 6.6.3 Europe Artificial Casings Market Size, By Food Service Providers, By Value, 2018H-2028F (USD Million & CAGR)
- 6.6.4 Europe Artificial Casings Market Size, By Food Retailers, By Value, 2018H-2028F (USD Million & CAGR)
- 6.7 Europe Artificial Casings Market Segmentation: By Sales Channel
- 6.7.1 Europe Artificial Casings Market, By Sales Channel Overview
- 6.7.2 Europe Artificial Casings Market Size, By Offline Channel, By Value, 2018H-2028F (USD Million & CAGR)
- 6.7.3 Europe Artificial Casings Market Size, By Online Channel, By Value, 2018H-2028F (USD Million & CAGR)
- 6.8 Europe Artificial Casings Market Segmentation: By Country
- 6.8.1 Europe Artificial Casings Market, By Country Overview
- 6.8.1 Germany Artificial Casings Market: Market Size and CAGR, 2018-2028 (USD Million & CAGR)
- 6.8.1.1 Germany Artificial Casings Market, By Type
- 6.8.1.2 Germany Artificial Casings Market, By End-User
- 6.8.1.3 Germany Artificial Casings Market, By Sales Channel
- 6.8.2 United Kingdom Artificial Casings Market: Market Size and CAGR, 2018-2028 (USD Million & CAGR)
- 6.8.2.1 United Kingdom Artificial Casings Market, By Type
- 6.8.2.2 United Kingdom Artificial Casings Market, By End-User
- 6.8.2.3 United Kingdom Artificial Casings Market, By Sales Channel
- 6.8.3 France Artificial Casings Market: Market Size and CAGR, 2018-2028 (USD Million & CAGR)
- 6.8.3.1 France Artificial Casings Market, By Type
- 6.8.3.2 France Artificial Casings Market, By End-User
- 6.8.3.3 France Artificial Casings Market, By Sales Channel
- 6.8.4 Spain Artificial Casings Market: Market Size and CAGR, 2018-2028 (USD Million & CAGR)
- 6.8.4.1 Spain Artificial Casings Market, By Type
- 6.8.4.2 Spain Artificial Casings Market, By End-User
- 6.8.4.3 Spain Artificial Casings Market, By Sales Channel
- 6.8.5 Rest of Europe Artificial Casings Market: Market Size and CAGR, 2018-2028 (USD Million & CAGR)
- 6.8.5.1 Rest of Europe Artificial Casings Market, By Type
- 6.8.5.2 Rest of Europe Artificial Casings Market, By End-User
- 6.8.5.3 Rest of Europe Artificial Casings Market, By Sales Channel
7. Asia Pacific Artificial Casings Market: Historic and Forecast (2018-2028)
- 7.1 Asia Pacific Artificial Casings Market: Snapshot
- 7.2 Asia Pacific Artificial Casings Market: Market Size and CAGR, 2018-2028 (USD Million & CAGR)
- 7.3 Asia Pacific Artificial Casings Market: Volume Sales and CAGR, 2018-2028 (Billion Meters)
- 7.4 Asia Pacific Artificial Casings Market: Key Factors
- 7.5 Asia Pacific Artificial Casings Market Segmentation: By Type
- 7.5.1 Asia Pacific Artificial Casings Market, By Type Overview
- 7.5.2 Asia Pacific Artificial Casings Market Size, By Collagen Casings, By Value, 2018H-2028F (USD Million & CAGR)
- 7.5.3 Asia Pacific Artificial Casings Market Size, By Cellulose Casings, By Value, 2018H-2028F (USD Million & CAGR)
- 7.5.4 Asia Pacific Artificial Casings Market Size, By Fibrous Casings, By Value, 2018H-2028F (USD Million & CAGR)
- 7.5.5 Asia Pacific Artificial Casings Market Size, By Plastic Casings, By Value, 2018H-2028F (USD Million & CAGR)
- 7.5.5 Asia Pacific Artificial Casings Market Size, By Vegan Casings, By Value, 2018H-2028F (USD Million & CAGR)
- 7.6 Asia Pacific Artificial Casings Market Segmentation: By End-User
- 7.6.1 Asia Pacific Artificial Casings Market, By End-User Overview
- 7.6.2 Asia Pacific Artificial Casings Market Size, By Food Processing Companies, By Value, 2018H-2028F (USD Million & CAGR)
- 7.6.3 Asia Pacific Artificial Casings Market Size, By Food Service Providers, By Value, 2018H-2028F (USD Million & CAGR)
- 7.6.4 Asia Pacific Artificial Casings Market Size, By Food Retailers, By Value, 2018H-2028F (USD Million & CAGR)
- 7.7 Asia Pacific Artificial Casings Market Segmentation: By Sales Channel
- 7.7.1 Asia Pacific Artificial Casings Market, By Sales Channel Overview
- 7.7.2 Asia Pacific Artificial Casings Market Size, By Offline Channel, By Value, 2018H-2028F (USD Million & CAGR)
- 7.7.3 Asia Pacific Artificial Casings Market Size, By Online Channel, By Value, 2018H-2028F (USD Million & CAGR)
- 7.8 Asia Pacific Artificial Casings Market Segmentation: By Country
- 7.8.1 Asia Pacific Artificial Casings Market, By Sales Channel Overview
- 7.8.2 China Artificial Casings Market: Market Size and CAGR, 2018-2028 (USD Million & CAGR)
- 7.8.2.1 China Artificial Casings Market, By Type
- 7.8.2.2 China Artificial Casings Market, By End-User
- 7.8.2.3 China Artificial Casings Market, By Sales Channel
- 7.8.3 Japan Artificial Casings Market: Market Size and CAGR, 2018-2028 (USD Million & CAGR)
- 7.8.3.1 Japan Artificial Casings Market, By Type
- 7.8.3.2 Japan Artificial Casings Market, By End-User
- 7.8.3.3 Japan Artificial Casings Market, By Sales Channel
- 7.9.3 South Korea Artificial Casings Market: Market Size and CAGR, 2018-2028 (USD Million & CAGR)
- 7.9.3.1 South Korea Artificial Casings Market, By Type
- 7.9.3.2 South Korea Artificial Casings Market, By End-User
- 7.9.3.3 South Korea Artificial Casings Market, By Sales Channel
- 7.10.4 Rest Of Asia Pacific Artificial Casings Market: Market Size and CAGR, 2018-2028 (USD Million & CAGR)
- 7.10.4.1 Rest Of Asia Pacific Artificial Casings Market, By Type
- 7.10.4.2 Rest Of Asia Pacific Artificial Casings Market, By End-User
- 7.10.4.3 Rest Of Asia Pacific Artificial Casings Market, By Sales Channel
8. Middle East & Africa Artificial Casings Market: Historic and Forecast (2018-2028)
- 8.1 Middle East & Africa Artificial Casings Market: Snapshot
- 8.2 Middle East & Africa Artificial Casings Market: Market Size and CAGR, 2018-2028 (USD Million & CAGR)
- 8.3 Middle East & Africa Artificial Casings Market: Volume Sales and CAGR, 2018-2028 (Billion Meters)
- 8.4 Middle East & Africa Artificial Casings Market: Key Factors
- 8.5 Middle East & Africa Artificial Casings Market Segmentation: By Type
- 8.5.1 Middle East & Africa Artificial Casings Market, By Type Overview
- 8.5.2 Middle East & Africa Artificial Casings Market Size, By Collagen Casings, By Value, 2018H-2028F (USD Million & CAGR)
- 8.5.3 Middle East & Africa Artificial Casings Market Size, By Cellulose Casings, By Value, 2018H-2028F (USD Million & CAGR)
- 8.5.4 Middle East & Africa Artificial Casings Market Size, By Fibrous Casings, By Value, 2018H-2028F (USD Million & CAGR)
- 8.5.5 Middle East & Africa Artificial Casings Market Size, By Plastic Casings, By Value, 2018H-2028F (USD Million & CAGR)
- 8.5.6 Middle East & Africa Artificial Casings Market Size, By Vegan Casings, By Value, 2018H-2028F (USD Million & CAGR)
- 8.5 Middle East & Africa Artificial Casings Market Segmentation: By End-User
- 8.5.1 Middle East & Africa Artificial Casings Market, By End-User Overview
- 8.5.1 Middle East & Africa Artificial Casings Market Size, By Food Processing Companies, By Value, 2018H-2028F (USD Million & CAGR)
- 8.5.1 Middle East & Africa Artificial Casings Market Size, By Food Service Providers, By Value, 2018H-2028F (USD Million & CAGR)
- 8.5.1 Middle East & Africa Artificial Casings Market Size, By Food Retailers, By Value, 2018H-2028F (USD Million & CAGR)
- 8.6 Middle East & Africa Artificial Casings Market Segmentation: By Sales Channel
- 8.6.1 Middle East & Africa Artificial Casings Market, By Sales Channel Overview
- 8.6.2 Middle East & Africa Artificial Casings Market Size, By Offline Channel, By Value, 2018H-2028F (USD Million & CAGR)
- 8.6.3 Middle East & Africa Artificial Casings Market Size, By Online Channel, By Value, 2018H-2028F (USD Million & CAGR)
9. Market Dynamics
- 9.1 Impact assessment of Market Dynamics on the Global Artificial Casings Market
- 9.2 Drivers
- 9.3 Restraints
- 9.4 Trends
10. Industry Ecosystem Analysis
- 10.1 Macro-Economic Factor Assessment
- 10.2 Value Chain Analysis
- 10.3 Porter's Five Forces Model
11. Competitive Positioning
- 11.1 Companies' Product Positioning
- 11.2 Market Position Matrix
- 11.3 Artificial sausage casing manufacturers by specialty
- 11.4 Market Share Analysis of Artificial Casings Market
- 11.5 Company Profiles
- 11.5.1 Kalle Gmbh
- 11.5.2 Viscofan
- 11.5.3 Devro PLC
- 11.5.4 Viskase Cos. Inc.
- 11.5.5 ViskoTeepak
- 11.5.6 Shenguan Holdings (Group) Limited
- 11.5.7 DAT-Schaub
- 11.5.8 Selo BV
- 11.5.9 Nippi Incorporated
- 11.5.10 Nitta Casings