|
|
市場調査レポート
商品コード
1177496
リキッドバイオプシーの世界市場:バイオマーカーの種類別、製品別、適応別、地域別、国別 - 市場規模、考察、競合、COVID-19の影響、予測Global Liquid Biopsy Market - Analysis by Biomarker Type, Product, By Indication By Region, By Country: Market Size, Insights, Competition, Covid-19 Impact and Forecast |
||||||
|
|
|||||||


| リキッドバイオプシーの世界市場:バイオマーカーの種類別、製品別、適応別、地域別、国別 - 市場規模、考察、競合、COVID-19の影響、予測 |
|
出版日: 2022年12月31日
発行: Azoth Analytics
ページ情報: 英文 260 Pages
納期: 即納可能
|
- 全表示
- 概要
- 図表
- 目次
世界のリキッドバイオプシーの市場規模は、2021年に22億米ドルと評価されました。このことは、過去10年間に政府や国際保健機関が行ってきた、がんに対する意識を高めるためのいくつかのイニシアチブに支えられています。
当レポートでは、世界のリキッドバイオプシー市場について調査分析し、市場力学、COVID-19の影響、セグメント別の市場分析と予測、競合情勢などについて、最新の情報を提供しています。
目次
第1章 イントロダクション
第2章 エグゼクティブサマリー
第3章 調査手法
第4章 市場力学
- 促進要因
- 抑制要因
- 機会
- アナリストの提言
- 動向
- 影響分析
第5章 バリューチェーン分析
- リキッドバイオプシー市場のバリューチェーン分析
第6章 COVID-19の影響評価
- リキッドバイオプシー市場に対するCOVID-19の影響度
- 地域ごとのCOVID-19の影響分析(四半期)
第7章 ポーターのファイブフォース分析
第8章 マクロ経済指標の見通し
- 1人当たりGDP成長率(年間%)
- 世界の医療支出:地域別(全体の%)
- 現在の医療費
- 1人当たりの医薬品支出
- がん発生率
第9章 世界のリキッドバイオプシー市場
- リキッドバイオプシー市場に対するマクロ経済要因の影響分析
- スナップショット
- 世界のリキッドバイオプシー市場:市場価値の評価
- 市場概要
第10章 世界のリキッドバイオプシー市場動向と予測分析(2018年~2028年):バイオマーカーの種類別
- 世界のリキッドバイオプシー市場動向と予測分析:バイオマーカーの種類別、スナップショット
- 循環腫瘍細胞(CTC)
- 循環腫瘍DNA(ctDNA)
- 細胞外小胞(EVs)
- その他
第11章 世界のリキッドバイオプシー市場動向と予測分析(2018年~2028年):適応別
- 世界のリキッドバイオプシー市場動向と予測分析:適応別、スナップショット
- がん
- 出生前スクリーニング
- その他
第12章 世界のリキッドバイオプシー市場動向と予測分析(2018年~2028年):製品別
- 世界のリキッドバイオプシー市場動向と予測分析:製品別、スナップショット
- アッセイキット
- 機器・デバイス
- サービス
第13章 世界のリキッドバイオプシー市場動向と予測分析(2018年~2028年):地域別
- 調査対象地域
第14章 南北アメリカのリキッドバイオプシー市場動向と予測分析(2018年~2028年)・CAGR
第15章 欧州のリキッドバイオプシー市場動向と予測分析(2018年~2028年)・CAGR
第16章 アジア太平洋地域のリキッドバイオプシー市場動向と予測分析(2018年~2028年)・CAGR
第17章 中東・アフリカのリキッドバイオプシー市場動向と予測分析(2018年~2028年)・CAGR
第18章 競合ポジショニング
- 企業の製品ポジショニング
- 市場ポジションマトリックス
- リキッドバイオプシー市場の市場シェア分析
- 企業プロファイル
- Roche Holding AG
- Abbott Laboratories
- Illumina Inc.
- Biocartis
- Guardant Health
- QIAGEN
- Thermo Fisher Scientific
- Biocept, Inc.
- Bio-Rad Laboratories
- MDxHealth
List of Figures
List of Figures
- Figure 1: Liquid Biopsy Market for next 7 years (in USD Millions)
- Figure 2: Liquid Biopsy Market Size, By Indication, 2018 & 2028 (USD Million)
- Figure 3: Liquid Biopsy Market Size, By Biomarker Type, 2021 (%)
- Figure 4: At a CAGR of 2.25% during 2018-2021, the global market value was estimated to reach USD 12.03 Million in 2021
- Figure 5: At a CAGR of 5.39% during 2023-2028, the global market value is expected to reach USD 15.62 billion in 2028
- Figure 6: Basis Point Analysis of Global Liquid Biopsy Market, By Region (2022,2028)
- Figure 7: Market Opportunity Analysis of Global Liquid Biopsy Market, By Region (2023-2028)
- Figure 8: Global Liquid Biopsy Market Size, By Value, 2018-2021 (USD Million)
- Figure 9: Global Liquid Biopsy Market Size, By Value, 2022-2028 (USD Million)
- Figure 10: Global Liquid Biopsy Market Share, By Biomarker Type, 2028 (%)
- Figure 11: Global Liquid Biopsy Market CAGR, By Biomarker Type, By Value, 2018-2021, 2023-2028 (%)
- Figure 12: Basis Point Analysis of Global Liquid Biopsy Market, By Biomarker Type (2022,2028)
- Figure 13: Market Opportunity Analysis of Global Liquid Biopsy Market, By Biomarker Type (2023-2028)
- Figure 14: Global Liquid Biopsy Market Size, By Circulating Tumor Cells (CTCs), By Value, 2018-2021 (USD Million)
- Figure 15: Global Liquid Biopsy Market Size, By Circulating Tumor Cells (CTCs), By Value, 2022-2028 (USD Million)
- Figure 16: Global Liquid Biopsy Absolute Opportunity, By Circulating Tum6or Cells (CTCs), 2018-2028 (USD Million)
- Figure 17: Global Liquid Biopsy Market Size, By Circulating Tumor DNA (ctDNA), By Value, 2018-2021 (USD Million)
- Figure 18: Global Liquid Biopsy Market Size, By Circulating Tumor DNA (ctDNA), By Value, 2022-2028 (USD Million)
- Figure 19: Global Liquid Biopsy Absolute Opportunity, By Circulating Tumor DNA (ctDNA), 2018-2028 (USD Million)
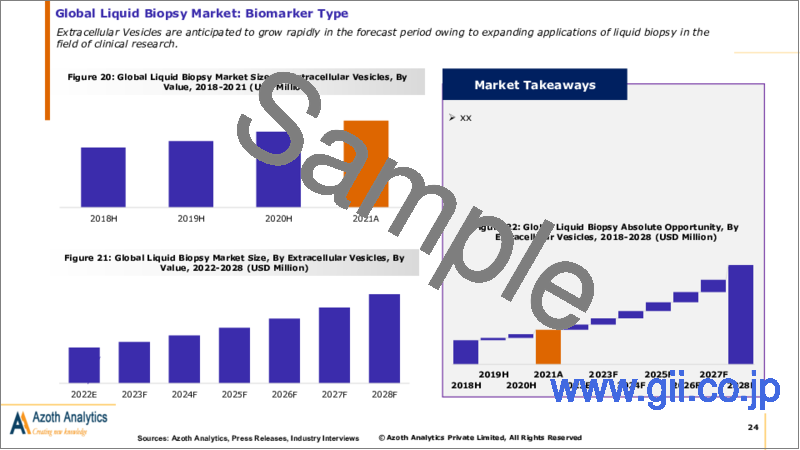
- Figure 20: Global Liquid Biopsy Market Size, By Extracellular Vesicles, By Value, 2018-2021 (USD Million)
- Figure 21: Global Liquid Biopsy Market Size, By Extracellular Vesicles, By Value, 2022-2028 (USD Million)
- Figure 22: Global Liquid Biopsy Absolute Opportunity, By Extracellular Vesicles, 2018-2028 (USD Million)
- Figure 23: Global Liquid Biopsy Market Size, By Other Biomarker Type, By Value, 2018-2021 (USD Million)
- Figure 24: Global Liquid Biopsy Market Size, By Other Biomarker Type, By Value, 2022-2028 (USD Million)
- Figure 25: Global Liquid Biopsy Absolute Opportunity, By Other Biomarker Type, 2018-2028 (USD Million)
- Figure 26: Global Liquid Biopsy Market CAGR, By Indication, By Value, 2018-2021, 2023-2028 (%)
- Figure 27: Basis Point Analysis of Global Liquid Biopsy Market, By Indication (2022,2028)
- Figure 28: Market Opportunity Analysis of Global Liquid Biopsy Market, By Indication (2023-2028)
- Figure 29: Global Liquid Biopsy Market Size, By Cancer, By Value, 2018-2021 (USD Million)
- Figure 30: Global Liquid Biopsy Market Size, By Cancer, By Value, 2022-2028 (USD Million)
- Figure 31: Global Liquid Biopsy Absolute Opportunity, By Cancer, 2018-2028 (USD Million)
- Figure 32: Global Liquid Biopsy Market Size, By Prenatal Screening, By Value, 2018-2021 (USD Million)
- Figure 33: Global Liquid Biopsy Market Size, By Prenatal Screening, By Value, 2022-2028 (USD Million)
- Figure 34: Global Liquid Biopsy Absolute Opportunity, By Prenatal Screening, 2018-2028 (USD Million)
- Figure 35: Global Liquid Biopsy Market Size, By Other Indication, By Value, 2018-2021 (USD Million)
- Figure 36: Global Liquid Biopsy Market Size, By Other Indication, By Value, 2022-2028 (USD Million)
- Figure 37: Global Liquid Biopsy Absolute Opportunity, By Other Indication, 2018-2028 (USD Million)
- Figure 38: Global Liquid Biopsy Market CAGR, By Product, By Value, 2018-2021, 2023-2028 (%)
- Figure 39: Basis Point Analysis of Global Liquid Biopsy Market, By Product (2022,2028)
- Figure 40: Market Opportunity Analysis of Global Liquid Biopsy Market, By Product (2023-2028
- Figure 41: Global Liquid Biopsy Market Size, By Assay Kits, By Value, 2018-2021 (USD Million)
- Figure 42: Global Liquid Biopsy Market Size, By Assay Kits, By Value, 2022-2028 (USD Million)
- Figure 43: Global Liquid Biopsy Absolute Opportunity, By Assay Kits, 2018-2028 (USD Million)
- Figure 44: Global Liquid Biopsy Market Size, By Instruments and Devices, By Value, 2018-2021 (USD Million)
- Figure 45: Global Liquid Biopsy Market Size, By Instruments and Devices, By Value, 2022-2028 (USD Million)
- Figure 46: Global Liquid Biopsy Absolute Opportunity, By Instruments and Devices, 2018-2028 (USD Million)
- Figure 47: Global Liquid Biopsy Market Size, By Services, By Value, 2018-2021 (USD Million)
- Figure 48: Global Liquid Biopsy Market Size, By Services, By Value, 2022-2028 (USD Million)
- Figure 49: Global Liquid Biopsy Absolute Opportunity, By Services, 2018-2028 (USD Million)
- Figure 50: Market Value of the Americas is expected to grow from USD 1.18 Billion in 2021 to USD 3.91 Billion in 2028
- Figure 51: Americas Liquid Biopsy Market is expected to foresee an absolute opportunity of USD 3,147.34 Million during 2018-2028
- Figure 52: Market Value by Biomarker Type
- Figure 53: Market Value by Indication
- Figure 54: Market Value by Product
- Figure 55: Americas Liquid Biopsy Market Size, By Value, 2018H-2028F (USD Million)
- Figure 56: Americas Liquid Biopsy Market Share, By Indication, 2021 (%)
- Figure 57: Americas Liquid Biopsy Market CAGR, By Biomarker Type, By Value, 2018-2021, 2023-2028 (%)
- Figure 58: Basis Point Analysis of Americas Liquid Biopsy Market, By Biomarker Type (2022,2028)
- Figure 59: Market Opportunity Analysis of Americas Liquid Biopsy Market, By Biomarker Type (2023-2028)
- Figure 60: Americas Liquid Biopsy Market, By Circulating Tumor Cells, By Value, 2018H-2028F (USD Million)
- Figure 61: Americas Liquid Biopsy Market, By Circulating Tumor DNA, By Value, 2018H-2028F (USD Million)
- Figure 62: Americas Liquid Biopsy Market, By Extracellular Vesicles, By Value, 2018H-2028F (USD Million)
- Figure 63: Americas Liquid Biopsy Market, By Other Biomarkers Type, By Value, 2018H-2028F (USD Million)
- Figure 64: Americas Liquid Biopsy Market CAGR, By Indication, By Value, 2018-2021, 2023-2028 (%)
- Figure 65: Basis Point Analysis of Americas Liquid Biopsy Market, By Indication (2022,2028)
- Figure 66: Market Opportunity Analysis of Americas Liquid Biopsy Market, By Indication (2023-2028)
- Figure 67: Americas Liquid Biopsy Market, By Cancer, By Value, 2018H-2028F (USD Million)
- Figure 68: Americas Liquid Biopsy Market, By Prenatal Screening, By Value, 2018H-2028F (USD Million)
- Figure 69: Americas Liquid Biopsy Market, By Other Indication, By Value, 2018H-2028F (USD Million)
- Figure 70: Americas Liquid Biopsy Market CAGR, By Product, By Value, 2018-2021, 2023-2028 (%)
- Figure 71: Basis Point Analysis of Americas Liquid Biopsy Market, By Product (2022,2028)
- Figure 72: Market Opportunity Analysis of Americas Liquid Biopsy Market, By Product (2023-2028)
- Figure 73: Americas Liquid Biopsy Market, By Assay Kits, By Value, 2018H-2028F (USD Million)
- Figure 74: Americas Liquid Biopsy Market, By Instruments and Devices, By Value, 2018H-2028F (USD Million)
- Figure 75: Americas Liquid Biopsy Market, By Services, By Value, 2018H-2028F (USD Million)
- Figure 76: United States Liquid Biopsy Market, By Value, 2018-2028 (USD Million)
- Figure 77: United States Liquid Biopsy Market, CAGR, By Value, 2018-2021, 2023-2028 (%)
- Figure 78: United States Liquid Biopsy Market Value, By Biomarker Type, 2021 (USD Million)
- Figure 79: United States Liquid Biopsy Market Share, By Biomarker Type, By Value, 2021 (%)
- Figure 80: United States Liquid Biopsy Market Share, By Indication, By Value, 2021 (%)
- Figure 81: United States Liquid Biopsy Market Share, By Product, By Value, 2021 (%)
- Figure 82: Canada Liquid Biopsy Market, By Value, 2018-2028 (USD Million)
- Figure 83: Canada Liquid Biopsy Market, CAGR, By Value, 2018-2021, 2023-2028 (%)
- Figure 84: Canada Liquid Biopsy Market Value, By Biomarker Type, 2021 (USD Million)
- Figure 85: Canada Liquid Biopsy Market Share, By Biomarker Type, By Value, 2021 (%)
- Figure 86: Canada Liquid Biopsy Market Share, By Indication, By Value, 2021 (%)
- Figure 87: Canada Liquid Biopsy Market Share, By Product, By Value, 2021 (%)
- Figure 88: Rest of Americas Liquid Biopsy Market, By Value, 2018-2028 (USD Million)
- Figure 89: Rest of Americas Liquid Biopsy Market, CAGR, By Value, 2018-2021, 2023-2028 (%)
- Figure 90: Rest of Americas Liquid Biopsy Market Value, By Biomarker Type, 2021 (USD Million)
- Figure 91: Rest of Americas Liquid Biopsy Market Share, By Biomarker Type, By Value, 2021 (%)
- Figure 92: Rest of Americas Liquid Biopsy Market Share, By Indication, By Value, 2021 (%)
- Figure 93: Rest of Americas Liquid Biopsy Market Share, By Product, By Value, 2021 (%)
- Figure 94: Market Value of Europe is expected to grow from USD 614.64 Million in 2021 to USD 1.91 Billion in 2028
- Figure 95: Europe Liquid Biopsy Market is expected to foresee an absolute opportunity of USD 1,505.59 Million during 2018-2028
- Figure 96: Market Value by Biomarker Type
- Figure 97: Market Value by Indication
- Figure 98: Market Value by Product
- Figure 99: Europe Liquid Biopsy Market Size, By Value, 2018H-2028F (USD Million)
- Figure 100: Europe Liquid Biopsy Market Share, By Indication, 2021 (%)
- Figure 101: Europe Liquid Biopsy Market CAGR, By Biomarker Type, By Value, 2018-2021, 2023-2028 (%)
- Figure 102: Basis Point Analysis of Europe Liquid Biopsy Market, By Biomarker Type (2022,2028)
- Figure 103: Market Opportunity Analysis of Europe Liquid Biopsy Market, By Biomarker Type (2023-2028)
- Figure 104: Europe Liquid Biopsy Market, By Circulating Tumor Cells, By Value, 2018H-2028F (USD Million)
- Figure 105: Europe Liquid Biopsy Market, By Circulating Tumor DNA, By Value, 2018H-2028F (USD Million)
- Figure 106: Europe Liquid Biopsy Market, By Extracellular Vesicles, By Value, 2018H-2028F (USD Million)
- Figure 107: Europe Liquid Biopsy Market, By Other Biomarkers Type, By Value, 2018H-2028F (USD Million)
- Figure 108: Europe Liquid Biopsy Market CAGR, By Indication, By Value, 2018-2021, 2023-2028 (%)
- Figure 109: Basis Point Analysis of Europe Liquid Biopsy Market, By Indication (2022,2028)
- Figure 110: Market Opportunity Analysis of Europe Liquid Biopsy Market, By Indication (2023-2028)
- Figure 111: Europe Liquid Biopsy Market, By Cancer, By Value, 2018H-2028F (USD Million)
- Figure 112: Europe Liquid Biopsy Market, By Prenatal Screening, By Value, 2018H-2028F (USD Million)
- Figure 113: Europe Liquid Biopsy Market, By Other Indication, By Value, 2018H-2028F (USD Million)
- Figure 114: Europe Liquid Biopsy Market CAGR, By Product, By Value, 2018-2021, 2023-2028 (%)
- Figure 115: Basis Point Analysis of Europe Liquid Biopsy Market, By Product (2022,2028)
- Figure 116: Market Opportunity Analysis of Europe Liquid Biopsy Market, By Product (2023-2028)
- Figure 117: Europe Liquid Biopsy Market, By Assay Kits, By Value, 2018H-2028F (USD Million)
- Figure 118: Europe Liquid Biopsy Market, By Instruments and Devices, By Value, 2018H-2028F (USD Million)
- Figure 119: Europe Liquid Biopsy Market, By Services, By Value, 2018H-2028F (USD Million)
- Figure 120: Germany Liquid Biopsy Market, By Value, 2018-2028 (USD Million)
- Figure 121: Germany Liquid Biopsy Market, CAGR, By Value, 2018-2021, 2023-2028 (%)
- Figure 122: Germany Liquid Biopsy Market Value, By Biomarker Type, 2021 (USD Million)
- Figure 123: Germany Liquid Biopsy Market Share, By Biomarker Type, By Value, 2021 (%)
- Figure 124: Germany Liquid Biopsy Market Share, By Indication, By Value, 2021 (%)
- Figure 125: Germany Liquid Biopsy Market Share, By Product, By Value, 2021 (%)
- Figure 126: United Kingdom Liquid Biopsy Market, By Value, 2018-2028 (USD Million)
- Figure 127: United Kingdom Liquid Biopsy Market, CAGR, By Value, 2018-2021, 2023-2028 (%)
- Figure 128: United Kingdom Liquid Biopsy Market Value, By Biomarker Type, 2021 (USD Million)
- Figure 129: United Kingdom Liquid Biopsy Market Share, By Biomarker Type, By Value, 2021 (%)
- Figure 130: United Kingdom Liquid Biopsy Market Share, By Indication, By Value, 2021 (%)
- Figure 131: United Kingdom Liquid Biopsy Market Share, By Product, By Value, 2021 (%)
- Figure 132: France Liquid Biopsy Market, By Value, 2018-2028 (USD Million)
- Figure 133: France Liquid Biopsy Market, CAGR, By Value, 2018-2021, 2023-2028 (%)
- Figure 134: France Liquid Biopsy Market Value, By Biomarker Type, 2021 (USD Million)
- Figure 135: France Liquid Biopsy Market Share, By Biomarker Type, By Value, 2021 (%)
- Figure 136: France Liquid Biopsy Market Share, By Indication, By Value, 2021 (%)
- Figure 137: France Liquid Biopsy Market Share, By Product, By Value, 2021 (%)
- Figure 138: Spain Liquid Biopsy Market, By Value, 2018-2028 (USD Million)
- Figure 139: Spain Liquid Biopsy Market, CAGR, By Value, 2018-2021, 2023-2028 (%)
- Figure 140: Spain Liquid Biopsy Market Value, By Biomarker Type, 2021 (USD Million)
- Figure 141: Spain Liquid Biopsy Market Share, By Biomarker Type, By Value, 2021 (%)
- Figure 142: Spain Liquid Biopsy Market Share, By Indication, By Value, 2021 (%)
- Figure 143: Spain Liquid Biopsy Market Share, By Product, By Value, 2021 (%)
- Figure 144: Italy Liquid Biopsy Market, By Value, 2018-2028 (USD Million)
- Figure 145: Italy Liquid Biopsy Market, CAGR, By Value, 2018-2021, 2023-2028 (%)
- Figure 146: Italy Liquid Biopsy Market Value, By Biomarker Type, 2021 (USD Million)
- Figure 147: Italy Liquid Biopsy Market Share, By Biomarker Type, By Value, 2021 (%)
- Figure 148: Italy Liquid Biopsy Market Share, By Indication, By Value, 2021 (%)
- Figure 149: Italy Liquid Biopsy Market Share, By Product, By Value, 2021 (%)
- Figure 150: Rest of Europe Liquid Biopsy Market, By Value, 2018-2028 (USD Million)
- Figure 151: Rest of Europe Liquid Biopsy Market, CAGR, By Value, 2018-2021, 2023-2028 (%)
- Figure 152: Rest of Europe Liquid Biopsy Market Value, By Biomarker Type, 2021 (USD Million)
- Figure 153: Rest of Europe Liquid Biopsy Market Share, By Biomarker Type, By Value, 2021 (%)
- Figure 154: Rest of Europe Liquid Biopsy Market Share, By Indication, By Value, 2021 (%)
- Figure 155: Rest of Europe Liquid Biopsy Market Share, By Product, By Value, 2021 (%)
- Figure 156: Market Value of Asia Pacific is expected to grow from USD 308.68 Million in 2021 to USD 1.07 Billion in 2028
- Figure 157: Asia Pacific Liquid Biopsy Market is expected to foresee an absolute opportunity of USD 883.48 Million during 2018-2028
- Figure 158: Market Value by Biomarker Type
- Figure 159: Market Value by Indication
- Figure 160: Market Value by Product
- Figure 161: Asia Pacific Liquid Biopsy Market Size, By Value, 2018H-2028F (USD Million)
- Figure 162: Asia Pacific Liquid Biopsy Market Share, By Indication, 2021 (%)
- Figure 163: Asia Pacific Liquid Biopsy Market CAGR, By Biomarker Type, By Value, 2018-2021, 2023-2028 (%)
- Figure 164: Basis Point Analysis of Asia Pacific Liquid Biopsy Market, By Biomarker Type (2022,2028)
- Figure 165: Market Opportunity Analysis of Asia Pacific Liquid Biopsy Market, By Biomarker Type (2023-2028)
- Figure 166: Asia Pacific Liquid Biopsy Market, By Circulating Tumor Cells, By Value, 2018H-2028F (USD Million)
- Figure 167: Asia Pacific Liquid Biopsy Market, By Circulating Tumor DNA, By Value, 2018H-2028F (USD Million)
- Figure 168: Asia Pacific Liquid Biopsy Market, By Extracellular Vesicles, By Value, 2018H-2028F (USD Million)
- Figure 169: Asia Pacific Liquid Biopsy Market, By Other Biomarkers Type, By Value, 2018H-2028F (USD Million)
- Figure 170: Asia Pacific Liquid Biopsy Market CAGR, By Indication, By Value, 2018-2021, 2023-2028 (%)
- Figure 171: Basis Point Analysis of Asia Pacific Liquid Biopsy Market, By Indication (2022,2028)
- Figure 172: Market Opportunity Analysis of Asia Pacific Liquid Biopsy Market, By Indication (2023-2028)
- Figure 173: Asia Pacific Liquid Biopsy Market, By Cancer, By Value, 2018H-2028F (USD Million)
- Figure 174: Asia Pacific Liquid Biopsy Market, By Prenatal Screening, By Value, 2018H-2028F (USD Million)
- Figure 175: Asia Pacific Liquid Biopsy Market, By Other Indication, By Value, 2018H-2028F (USD Million)
- Figure 176: Asia Pacific Liquid Biopsy Market CAGR, By Product, By Value, 2018-2021, 2023-2028 (%)
- Figure 177: Basis Point Analysis of Asia Pacific Liquid Biopsy Market, By Product (2022,2028)
- Figure 178: Market Opportunity Analysis of Asia Pacific Liquid Biopsy Market, By Product (2023-2028)
- Figure 179: Asia Pacific Liquid Biopsy Market, By Assay Kits, By Value, 2018H-2028F (USD Million)
- Figure 180: Asia Pacific Liquid Biopsy Market, By Instruments and Devices, By Value, 2018H-2028F (USD Million)
- Figure 181: Asia Pacific Liquid Biopsy Market, By Services, By Value, 2018H-2028F (USD Million)
- Figure 182: China Liquid Biopsy Market, By Value, 2018-2028 (USD Million)
- Figure 183: China Liquid Biopsy Market, CAGR, By Value, 2018-2021, 2023-2028 (%)
- Figure 184: China Liquid Biopsy Market Value, By Biomarker Type, 2021 (USD Million)
- Figure 185: China Liquid Biopsy Market Share, By Biomarker Type, By Value, 2021 (%)
- Figure 186: China Liquid Biopsy Market Share, By Indication, By Value, 2021 (%)
- Figure 187: China Liquid Biopsy Market Share, By Product, By Value, 2021 (%)
- Figure 188: Japan Liquid Biopsy Market, By Value, 2018-2028 (USD Million)
- Figure 189: Japan Liquid Biopsy Market, CAGR, By Value, 2018-2021, 2023-2028 (%)
- Figure 190: Japan Liquid Biopsy Market Value, By Biomarker Type, 2021 (USD Million)
- Figure 191: Japan Liquid Biopsy Market Share, By Biomarker Type, By Value, 2021 (%)
- Figure 192: Japan Liquid Biopsy Market Share, By Indication, By Value, 2021 (%)
- Figure 193: Japan Liquid Biopsy Market Share, By Product, By Value, 2021 (%)
- Figure 194: South Korea Liquid Biopsy Market, By Value, 2018-2028 (USD Million)
- Figure 195: South Korea Liquid Biopsy Market, CAGR, By Value, 2018-2021, 2023-2028 (%)
- Figure 196: South Korea Liquid Biopsy Market Value, By Biomarker Type, 2021 (USD Million)
- Figure 197: South Korea Liquid Biopsy Market Share, By Biomarker Type, By Value, 2021 (%)
- Figure 198: South Korea Liquid Biopsy Market Share, By Indication, By Value, 2021 (%)
- Figure 199: South Korea Liquid Biopsy Market Share, By Product, By Value, 2021 (%)
- Figure 200: Rest of Asia Pacific Liquid Biopsy Market, By Value, 2018-2028 (USD Million)
- Figure 201: Rest of Asia Pacific Liquid Biopsy Market, CAGR, By Value, 2018-2021, 2023-2028 (%)
- Figure 202: Rest of Asia Pacific Liquid Biopsy Market Value, By Biomarker Type, 2021 (USD Million)
- Figure 203: Rest of Asia Pacific Liquid Biopsy Market Share, By Biomarker Type, By Value, 2021 (%)
- Figure 204: Rest of Asia Pacific Liquid Biopsy Market Share, By Indication, By Value, 2021 (%)
- Figure 205: Rest of Asia Pacific Liquid Biopsy Market Share, By Product, By Value, 2021 (%)
- Figure 206: Market Value of the Middle East and Africa is expected to grow from USD 853.38 Million in 2021 to USD 994.25 Million in 2028
- Figure 207: Middle East and Africa Liquid Biopsy Market is expected to foresee an absolute opportunity of USD 155.48 Million during 2018-2028
- Figure 208: Market Value by Biomarker Type
- Figure 209: Market Value by Indication
- Figure 210: Market Value by Product
- Figure 211: Middle East and Africa Liquid Biopsy Market Size, By Value, 2018H-2028F (USD Million)
- Figure 212: Middle East and Africa Liquid Biopsy Market Share, By Indication, 2021 (%)
- Figure 213: Middle East and Africa Liquid Biopsy Market CAGR, By Biomarker Type, By Value, 2018-2021, 2023-2028 (%)
- Figure 214: Basis Point Analysis of Middle East and Africa Liquid Biopsy Market, By Biomarker Type (2022,2028)
- Figure 215: Market Opportunity Analysis of Middle East and Africa Liquid Biopsy Market, By Biomarker Type (2023-2028)
- Figure 216: Middle East and Africa Liquid Biopsy Market, By Circulating Tumor Cells, By Value, 2018H-2028F (USD Million)
- Figure 217: Middle East and Africa Liquid Biopsy Market, By Circulating Tumor DNA, By Value, 2018H-2028F (USD Million)
- Figure 218: Middle East and Africa Liquid Biopsy Market, By Extracellular Vesicles, By Value, 2018H-2028F (USD Million)
- Figure 219: Middle East and Africa Liquid Biopsy Market, By Other Biomarkers Type, By Value, 2018H-2028F (USD Million)
- Figure 220: Middle East and Africa Liquid Biopsy Market CAGR, By Indication, By Value, 2018-2021, 2023-2028 (%)
- Figure 221: Basis Point Analysis of Middle East and Africa Liquid Biopsy Market, By Indication (2022,2028)
- Figure 222: Market Opportunity Analysis of Middle East and Africa Liquid Biopsy Market, By Indication (2023-2028)
- Figure 223: Middle East and Africa Liquid Biopsy Market, By Cancer, By Value, 2018H-2028F (USD Million)
- Figure 224: Middle East and Africa Liquid Biopsy Market, By Prenatal Screening, By Value, 2018H-2028F (USD Million)
- Figure 225: Middle East and Africa Liquid Biopsy Market, By Other Indication, By Value, 2018H-2028F (USD Million)
- Figure 226: Middle East and Africa Liquid Biopsy Market CAGR, By Product, By Value, 2018-2021, 2023-2028 (%)
- Figure 227: Basis Point Analysis of Middle East and Africa Liquid Biopsy Market, By Product (2022,2028)
- Figure 228: Market Opportunity Analysis of Middle East and Africa Liquid Biopsy Market, By Product (2023-2028)
- Figure 229: Middle East and Africa Liquid Biopsy Market, By Assay Kits, By Value, 2018H-2028F (USD Million)
- Figure 230: Middle East and Africa Liquid Biopsy Market, By Instruments and Devices, By Value, 2018H-2028F (USD Million)
- Figure 231: Middle East and Africa Liquid Biopsy Market, By Services, By Value, 2018H-2028F (USD Million)
- Figure 232: Market Share of Prominent Companies of Liquid Biopsy, 2021 (%)
- Figure 233: Roche Revenues, 2019-2021 (USD Million)
- Figure 234: Roche Revenue , By Business Segments- By Products, 2021 (%)
- Figure 235: Roche Revenue , By Geographical Segments, 2021 (%)
- Figure 236: Abbott Laboratories Revenues, 2019-2021 (USD Million)
- Figure 237: Abbott Laboratories Revenue , By Business Segments, 2021 (%)
- Figure 238: Abbott Laboratories Revenue , By Geographical Segments, 2021 (%)
- Figure 239: Illumina Inc. . Revenues, 2019-2021 (USD Million)
- Figure 240: Illumina Inc. . Revenue , By Business Segments, 2021 (%)
- Figure 241: Illumina Inc. . Revenue , By Geographical Segments, 2021 (%)
- Figure 242: Biocartis Revenues, 2019-2021 (USD Million)
- Figure 243: Biocartis Revenue , By Business Segments, 2021 (%)
- Figure 244: Biocartis Revenue , By Geographical Segments, 2021 (%)
- Figure 245: Guardant Health Inc. Revenues, 2019-2021 (USD Million)
- Figure 246: Guardant Health Revenue , By Business Segments, 2021 (%)
- Figure 247: Guardant Health Revenue , By Geographical Segments, 2020 (%)
- Figure 248: Quaigen Revenues, 2019-2021 (USD Million)
- Figure 249: Quaigen Revenue , Product Sales by Disease Area, 2021 (%)
- Figure 250: Quaigen Revenue , By Geographical Segments, 2021 (%)
- Figure 251: Thermo Fisher Revenues, 2019-2021 (USD Million)
- Figure 252: Thermo Fisher Revenue , By Geographic segment, 2021 (%)
- Figure 253: Thermo Fisher Revenue , By Business Segments, 2021 (%)
- Figure 254: Biocept, Inc. Revenues, 2019-2021 (USD Million)
- Figure 255: Biocept, Inc. Revenue , By Operating Segments, 2021 (%)
- Figure 256: Bio-Rad Laboratories Revenues, 2019-2021 (USD Million)
- Figure 257: Bio-Rad Laboratories Revenue , By Business segment, 2021 (%)
- Figure 258: Bio-Rad Laboratories, By Geographic Segments, 2021 (%)
- Figure 259: MDxHealth Revenues, 2019-2021 (USD Million)
- Figure 260: MDxHealth Revenue , By Geographic segment, 2021 (%)
- Figure 261: MDxHealth, By Geographical Segments, 2020 (%)
List of Tables
Table A1: Global Impact of Drivers and Restraints
Table A2: Global Impact of Macro Economic Factors, By Region
Table A3: Americas Impact of Macro Economic Factors, By Country
Table A4: United States Liquid Biopsy Market, By Biomarker Type, By Value, 2018-2021 (USD Million)
Table A5: United States Liquid Biopsy Market, By Biomarker Type, By Value, 2022-2028 (USD Million)
Table A6: United States Liquid Biopsy Market, By Indication, By Value, 2018-2021 (USD Million)
Table A7: United States Liquid Biopsy Market, By Indication, By Value, 2022-2028 (USD Million)
Table A8: United States Liquid Biopsy Market, By Product, By Value, 2018-2021 (USD Million)
Table A9: United States Liquid Biopsy Market, By Product, By Value, 2022-2028 (USD Million)
Table A10: Canada Liquid Biopsy Market, By Biomarker Type, By Value, 2018-2021 (USD Million)
Table A11: Canada Liquid Biopsy Market, By Biomarker Type, By Value, 2022-2028 (USD Million)
Table A12: Canada Liquid Biopsy Market, By Indication, By Value, 2018-2021 (USD Million)
Table A13: Canada Liquid Biopsy Market, By Indication, By Value, 2022-2028 (USD Million)
Table A14: Canada Liquid Biopsy Market, By Product, By Value, 2018-2021 (USD Million)
Table A15: Canada Liquid Biopsy Market, By Product, By Value, 2022-2028 (USD Million)
Table A16: Rest of Americas Liquid Biopsy Market, By Biomarker Type, By Value, 2018-2021 (USD Million)
Table A17: Rest of Americas Liquid Biopsy Market, By Biomarker Type, By Value, 2022-2028 (USD Million)
Table A18: Rest of Americas Liquid Biopsy Market, By Indication, By Value, 2018-2021 (USD Million)
Table A19: Rest of Americas Liquid Biopsy Market, By Indication, By Value, 2022-2028 (USD Million)
Table A20: Rest of Americas Liquid Biopsy Market, By Product, By Value, 2018-2021 (USD Million)
Table A21: Rest of Americas Liquid Biopsy Market, By Product, By Value, 2022-2028 (USD Million)
Table A22: Europe Impact of Macro Economic Factors, By Country
Table A23: Germany Liquid Biopsy Market, By Biomarker Type, By Value, 2018-2021 (USD Million)
Table A24: Germany Liquid Biopsy Market, By Biomarker Type, By Value, 2022-2028 (USD Million)
Table A25: Germany Liquid Biopsy Market, By Indication, By Value, 2018-2021 (USD Million)
Table A26: Germany Liquid Biopsy Market, By Indication, By Value, 2022-2028 (USD Million)
Table A27: Germany Liquid Biopsy Market, By Product, By Value, 2018-2021 (USD Million)
Table A28: Germany Liquid Biopsy Market, By Product, By Value, 2022-2028 (USD Million)
Table A29: United Kingdom Liquid Biopsy Market, By Biomarker Type, By Value, 2018-2021 (USD Million)
Table A30: United Kingdom Liquid Biopsy Market, By Biomarker Type, By Value, 2022-2028 (USD Million)
Table A31: United Kingdom Liquid Biopsy Market, By Indication, By Value, 2018-2021 (USD Million)
Table A32: United Kingdom Liquid Biopsy Market, By Indication, By Value, 2022-2028 (USD Million)
Table A33: United Kingdom Liquid Biopsy Market, By Product, By Value, 2018-2021 (USD Million)
Table A34: United Kingdom Liquid Biopsy Market, By Product, By Value, 2022-2028 (USD Million)
Table A35: France Liquid Biopsy Market, By Biomarker Type, By Value, 2018-2021 (USD Million)
Table A36: France Liquid Biopsy Market, By Biomarker Type, By Value, 2022-2028 (USD Million)
Table A37: France Liquid Biopsy Market, By Indication, By Value, 2018-2021 (USD Million)
Table A38: France Liquid Biopsy Market, By Indication, By Value, 2022-2028 (USD Million)
Table A39: France Liquid Biopsy Market, By Product, By Value, 2018-2021 (USD Million)
Table A40: France Liquid Biopsy Market, By Product, By Value, 2022-2028 (USD Million)
Table A41: Spain Liquid Biopsy Market, By Biomarker Type, By Value, 2018-2021 (USD Million)
Table A42: Spain Liquid Biopsy Market, By Biomarker Type, By Value, 2022-2028 (USD Million)
Table A43: Spain Liquid Biopsy Market, By Indication, By Value, 2018-2021 (USD Million)
Table A44: Spain Liquid Biopsy Market, By Indication, By Value, 2022-2028 (USD Million)
Table A45: Spain Liquid Biopsy Market, By Product, By Value, 2018-2021 (USD Million)
Table A46: Spain Liquid Biopsy Market, By Product, By Value, 2022-2028 (USD Million)
Table A47: Italy Liquid Biopsy Market, By Biomarker Type, By Value, 2018-2021 (USD Million)
Table A48: Italy Liquid Biopsy Market, By Biomarker Type, By Value, 2022-2028 (USD Million)
Table A49: Italy Liquid Biopsy Market, By Indication, By Value, 2018-2021 (USD Million)
Table A50: Italy Liquid Biopsy Market, By Indication, By Value, 2022-2028 (USD Million)
Table A51: Italy Liquid Biopsy Market, By Product, By Value, 2018-2021 (USD Million)
Table A52: Italy Liquid Biopsy Market, By Product, By Value, 2022-2028 (USD Million)
Table A53: Rest of Europe Liquid Biopsy Market, By Biomarker Type, By Value, 2018-2021 (USD Million)
Table A54: Rest of Europe Liquid Biopsy Market, By Biomarker Type, By Value, 2022-2028 (USD Million)
Table A55: Rest of Europe Liquid Biopsy Market, By Indication, By Value, 2018-2021 (USD Million)
Table A56: Rest of Europe Liquid Biopsy Market, By Indication, By Value, 2022-2028 (USD Million)
Table A57: Rest of Europe Liquid Biopsy Market, By Product, By Value, 2018-2021 (USD Million)
Table A58: Rest of Europe Liquid Biopsy Market, By Product, By Value, 2022-2028 (USD Million)
Table A59: Asia Pacific Impact of Macro Economic Factors, By Country
Table A60: China Liquid Biopsy Market, By Biomarker Type, By Value, 2018-2021 (USD Million)
Table A61: China Liquid Biopsy Market, By Biomarker Type, By Value, 2022-2028 (USD Million)
Table A62: China Liquid Biopsy Market, By Indication, By Value, 2018-2021 (USD Million)
Table A63: China Liquid Biopsy Market, By Indication, By Value, 2022-2028 (USD Million)
Table A64: China Liquid Biopsy Market, By Product, By Value, 2018-2021 (USD Million)
Table A65: China Liquid Biopsy Market, By Product, By Value, 2022-2028 (USD Million)
Table A66: Japan Liquid Biopsy Market, By Biomarker Type, By Value, 2018-2021 (USD Million)
Table A67: Japan Liquid Biopsy Market, By Biomarker Type, By Value, 2022-2028 (USD Million)
Table A68: Japan Liquid Biopsy Market, By Indication, By Value, 2018-2021 (USD Million)
Table A69: Japan Liquid Biopsy Market, By Indication, By Value, 2022-2028 (USD Million)
Table A70: Japan Liquid Biopsy Market, By Product, By Value, 2018-2021 (USD Million)
Table A71: Japan Liquid Biopsy Market, By Product, By Value, 2022-2028 (USD Million)
Table A72: South Korea Liquid Biopsy Market, By Biomarker Type, By Value, 2018-2021 (USD Million)
Table A73: South Korea Liquid Biopsy Market, By Biomarker Type, By Value, 2022-2028 (USD Million)
Table A74: South Korea Liquid Biopsy Market, By Indication, By Value, 2018-2021 (USD Million)
Table A75: South Korea Liquid Biopsy Market, By Indication, By Value, 2022-2028 (USD Million)
Table A76: South Korea Liquid Biopsy Market, By Product, By Value, 2018-2021 (USD Million)
Table A77: South Korea Liquid Biopsy Market, By Product, By Value, 2022-2028 (USD Million)
Table A78: Rest of APAC Liquid Biopsy Market, By Biomarker Type, By Value, 2018-2021 (USD Million)
Table A79: Rest of APAC Liquid Biopsy Market, By Biomarker Type, By Value, 2022-2028 (USD Million)
Table A80: Rest of APAC Liquid Biopsy Market, By Indication, By Value, 2018-2021 (USD Million)
Table A81: Rest of APAC Liquid Biopsy Market, By Indication, By Value, 2022-2028 (USD Million)
Table A82: Rest of APAC Liquid Biopsy Market, By Product, By Value, 2018-2021 (USD Million)
Table A83: Rest of APAC Liquid Biopsy Market, By Product, By Value, 2022-2028 (USD Million)
Table A84: Middle East and Africa Impact of Macro Economic Factors, By Region
Table A85: Key Company Financials, 2019-2021
Table A86: Key Company Financials, 2019-2021
Table A87: Key Company Financials, 2019-2021
Table A88: Key Company Financials, 2019-2021
Table A89: Key Company Financials, 2019-2021
Table A90: Key Company Financials, 2019-2021
Table A91: Key Company Financials, 2019-2021
Table A92: Key Company Financials, 2019-2021
Table A93: Key Company Financials, 2019-2021
Table A94: Key Company Financials, 2019-2021
Executive Summary
The Global Liquid Biopsy Market was valued at USD 2.2 Billion in the year 2021 backed by several initiatives to raise cancer awareness launched by governments and global health organizations over the last decade.
Developing economies such as India, China, South Korea, Brazil, Turkey, Russia, and South Africa are expected to provide potential growth opportunities for liquid biopsy market players. This can be attributed to these countries' higher cancer prevalence, large patient populations, improved healthcare infrastructure, rising disposable income, and growing medical tourism. Apart from the previously mentioned factors, the Asia Pacific region has emerged as an adaptable and business-friendly hub due to less stringent regulations and data requirements.
Assay kits are essential for detecting cancer tumor cells or tumor DNA using liquid biopsy. Liquid biopsy assays are low-cost, minimally invasive procedures that aid in patient monitoring during and after treatment and screening. Other major factors driving the growth of the liquid biopsy assay kits market include the availability of a wide range of reagents and kits, easy access to a wide range of assays, and the rising prevalence of cancer.
The high adoption of advanced technologies such as NGS, the increasing number of research studies for the discovery and development of novel cancer biomarkers, the presence of many pharmaceutical companies, rising funding and investments from public and private organizations, and the increasing use of biomarkers in patient stratification and drug development processes are driving growth in North America's developed markets.
Scope of the Report
- The report analyses the Liquid Biopsy Market by Value (USD Million).
- The report analyses the Liquid Biopsy Market by Biomarker Type (Circulating Tumor Cells, Circulating Tumor DNA, Extracellular Vesicles, Other Biomarkers Type).
- The report analyses the Liquid Biopsy Market by Indication (Cancer, Prenatal Screening, Others Indication).
- The report analyses the Liquid Biopsy Market by Product (Assay Kits, Instruments and Devices, Services).
- The Global Liquid Biopsy Market has been analyzed by countries (Americas, Europe, Asia Pacific, Middle East & Africa), By Countries (United States, Canada, Germany, United Kingdom, France, Spain, Italy, China, Japan, South Korea).
- The key insights of the report have been presented through the frameworks of SWOT and Porter's Five Forces Analysis. Also, the attractiveness of the market has been presented by region, by Indication, and by biomarkers.
- Also, the major opportunities, trends, drivers, and challenges of the industry have been analyzed in the report.
- The report tracks competitive developments, strategies, mergers, and acquisitions, and new Biomarker development. The companies analyzed in the report include Roche Holding AG, Abbott Laboratories, Illumina Inc, Biocartis, Guardant Health, QIAGEN, Thermo Fisher Scientific, Biocept, Inc, Bio-Rad Laboratories, and MDxHealth).
- The report presents the analysis of the Liquid Biopsy market for the historical period of 2018-2021 and the forecast period of 2023-2028.
Key Target Audience
- Pharmaceutical and Healthcare Companies
- Biotechnology Companies
- Consulting and Advisory Firms
- Government and Policy Makers
- Regulatory Authorities
Table of Contents
1. Introduction
- 1.1 Liquid Biopsy Market Overview
- 1.2 Scope of Research
2. Executive Summary
- 2.1 Market Snapshot
- 2.2 Regional Insights
- 2.3 Market Ecosystem Factors
3. Research Methodology
- 3.1 Data Collection Process
- 3.2 Market Trajectory Estimation
- 3.3 Market Size Calculation-Top-to-Bottom
4. Market Dynamics
- 4.1 Drivers
- 4.2 Restraints
- 4.3 Opportunities
- 4.4 Analyst Recommendations
- 4.5 Trends
- 4.6 Impact Analysis
5. Value Chain Analysis
- 5.1 Value Chain Analysis of Liquid Biopsy Market
6. COVID-19 Impact Assessment
- 6.1 Degree of Impact of COVID-19 on Liquid Biopsy Market
- 6.2 Region-Wise Quarterly Covid Impact Analysis (2020)
7. Porter's Five Forces Analysis
8. Macro Economic Indicator Outlook
- 8.1 GDP per capita growth (annual %)
- 8.2 Global Medical Spending in 2020, By Region, (% of Total)
- 8.3 Current Healthcare Expenditure
- 8.4 Pharmaceutical Spending/capita
- 8.5 Cancer Incidence
9. Global Liquid Biopsy Market
- 9.1 Impact Analysis of Macro Economic Factors on Liquid Biopsy Market
- 9.2 Snapshot
- 9.3 Global Liquid Biopsy Market: Market Value Assessment
- 9.4 Market Summary
10. Global Liquid Biopsy Market Trend And Forecast Analysis, 2018-2028, By Biomarker Type
- 10.1 Global Liquid Biopsy Market Trend And Forecast Analysis, Biomarker Type: Snapshot
- 10.2 Circulating tumor cells (CTCs)
- 10.3 Circulating tumor DNA (ctDNA)
- 10.4 Extracellular vesicles
- 10.5 Other Biomarkers
11. Global Liquid Biopsy Market Trend And Forecast Analysis, 2018-2028, By Indication
- 11.1 Global Liquid Biopsy Market Trend And Forecast Analysis, By Indication: Snapshot
- 11.2 Cancer
- 11.3 Prenatal Screening
- 11.4 Others
12. Global Liquid Biopsy Market Trend And Forecast Analysis, 2018-2028, By Product
- 12.1 Global Liquid Biopsy Market Trend And Forecast Analysis, By Product: Snapshot
- 12.2 Assay Kits
- 12.3 Instruments and Devices
- 12.4 Services
13. Global Liquid Biopsy Market Trend And Forecast Analysis, 2018-2028, By Region
- 13.1 Regional Coverage of the Study
14. Americas Liquid Biopsy Market Trends and Forecast Analysis, 2018-2028, USD Million & CAGR
- 14.1 Macro Economic Factor Impact Index
- 14.2 Americas Liquid Biopsy Market: Snapshot
- 14.3 Americas Liquid Biopsy Market Size, By Value, 2018-2028(USD Million)
- 14.4 Americas Liquid Biopsy Market Trend And Forecast Analysis: Segmentation
- 14.4.1 By Biomarker Type
- 14.4.2 By Indication
- 14.4.3 By Product
- 14.4.4 By Country
- 14.4.4.1 United States
- 14.4.4.2 Canada
- 14.5.5.3 Rest of Americas
15. Europe Liquid Biopsy Market Trends and Forecast Analysis, 2018-2028, USD Million & CAGR
- 15.1 Macro Economic Factor Impact Index
- 15.2 Europe Liquid Biopsy Market: Snapshot
- 15.3 Europe Liquid Biopsy Market Size, By Value, 2018-2028(USD Million)
- 15.4 Europe Liquid Biopsy Market Trend And Forecast Analysis: Segmentation
- 15.4.1 By Biomarker Type
- 15.4.2 By Indication
- 15.4.3 By Product
- 15.4.4 By Country
- 15.4.4.1 Germany
- 15.4.4.2 United Kingdom
- 15.4.4.3 France
- 15.4.4.4 Spain
- 15.4.4.5 Italy
- 15.4.4.6 Rest of Europe
16. Asia Pacific Liquid Biopsy Market Trends and Forecast Analysis, 2018-2028, USD Million & CAGR
- 16.1 Macro Economic Factor Impact Index
- 16.2 Asia Pacific Liquid Biopsy Market: Snapshot
- 16.3 Asia Pacific Liquid Biopsy Market Size, By Value, 2018-2028(USD Million)
- 16.4 Asia Pacific Liquid Biopsy Market Trend And Forecast Analysis: Segmentation
- 16.4.1 By Biomarker Type
- 16.4.2 By Indication
- 16.4.3 By Product
- 16.4.4 By Country
- 16.4.4.1 China
- 16.4.4.2 Japan
- 16.4.4.3 South Korea
- 16.4.4.4 Rest of APAC
17. Middle East & Africa Liquid Biopsy Market Trends and Forecast Analysis, 2018-2028, USD Million & CAGR
- 17.1 Macro Economic Factor Impact Index
- 17.2 Middle East & Africa Liquid Biopsy Market: Snapshot
- 17.3 Middle East & Africa Liquid Biopsy Market Size, By Value, 2018-2028(USD Million)
- 17.4 Middle East & Africa Liquid Biopsy Market Trend And Forecast Analysis: Segmentation
- 17.4.1 By Biomarker Type
- 17.4.2 By Indication
- 17.4.3 By Product
18. Competitive Positioning
- 18.1 Companies' Product Positioning
- 18.2 Market Position Matrix
- 18.3 Market Share Analysis of Liquid Biopsy Market
- 18.4 Company Profiles
- 18.4.1 Roche Holding AG
- 18.4.2 Abbott Laboratories
- 18.4.3 Illumina Inc.
- 18.4.4 Biocartis
- 18.4.5 Guardant Health
- 18.4.6 QIAGEN
- 18.4.7 Thermo Fisher Scientific
- 18.4.8 Biocept, Inc.
- 18.4.9 Bio-Rad Laboratories
- 18.4.10 MDxHealth