|
|
市場調査レポート
商品コード
1177490
自動車部品再製造の世界市場 - コンポーネント別・車種別 (PV、LCV、HCV、ATV、ORV)・地域別・国別の分析:規模、考察、競合、新型コロナウイルス感染症 (COVID-19) の影響、将来予測 (2023年~2028年)Global Automotive Parts Remanufacturing Market - Analysis By Component, By Vehicle (PV, LCV, HCV, ATV, ORV), By Region, By Country: Market Size, Insights, Competition, Covid-19 Impact and Forecast (2023-2028) |
||||||
|
|
|||||||


| 自動車部品再製造の世界市場 - コンポーネント別・車種別 (PV、LCV、HCV、ATV、ORV)・地域別・国別の分析:規模、考察、競合、新型コロナウイルス感染症 (COVID-19) の影響、将来予測 (2023年~2028年) |
|
出版日: 2022年12月31日
発行: Azoth Analytics
ページ情報: 英文 280 Pages
納期: 即納可能
|
- 全表示
- 概要
- 図表
- 目次
世界の自動車部品再製造の市場規模は、2021年に547億1,012万米ドルとなり、予測期間中 (2023年~2028年) に7.43%のCAGRで成長すると予測されています。原材料の不足が自動車部品再製造市場の成長を後押ししています。再製造部品は、同じ品質を提供しながら、オリジナル製品のほぼ50~75%のコストになります。
また、廃棄物管理に関する政府の厳しい規制や、環境に優しい製品に対する消費者の意識が高まっていることが、再製造部品市場の需要を世界的に押し上げています。
車種別に見ると、乗用車における再製造部品の普及が、現在では潜在力が最も大きいと予想されます。そのため、各社はこの分野に注力しています。また、中国・インド・米国での自動車部品再製造の施設拡大・販売増加が、世界市場を大きく促進すると考えられています。
当レポートでは、世界の自動車部品再製造市場について分析し、市場の概略や基本構造、主な市場促進・抑制要因、市場規模の実績値 (2018年~2021年) と予測値 (2022年~2028年)、コンポーネント別・車種別の詳細動向、地域別・主要国の市場構造・動向、市場の競合情勢と魅力、主要企業のプロファイル・戦略展開状況などを調査しております。
目次
第1章 イントロダクション:自動車部品再製造市場
第2章 エグゼクティブサマリー
第3章 調査手法
第4章 自動車部品再製造の市場力学
- 促進要因
- 抑制要因
- 機会
- 動向
- 市場力学の影響評価
第5章 バリューチェーン
- コンポーネントサプライヤー
- 再製造業者
- 流通業者/小売業者
- スペアパーツサプライヤー
第6章 新型コロナウイルス感染症 (COVID-19) の影響評価
- COVID-19のクリーンビューティー市場への影響度の評価
- COVID-19の影響分析:地域別 (四半期ベース)
第7章 ポーターのファイブフォース分析
第8章 マクロ経済指標の見通し
- 製造業
- 世界の自動車販売
- 各種業界への投資
- 国民総所得、購買力平価
- 都市化
第9章 自動車部品再製造市場:平均販売価格の分析
- 平均販売価格:地域別
- 平均販売価格:コンポーネント別
第10章 競争上のポジショニング
- 企業の製品ポジショニング
- 市場ポジションマトリックス
- 市場シェア分析
- ZF Friedrichshafen
- BBB Industries
- Meritor Inc.
- Budweg
- Monark Automotive
- Cardone Industries
- Robert Bosch
- Caterpillar Inc.
- Volvo Group
- Carwood
第11章 市場規模の分析 (数量ベース、2018年~2028年)
- 世界の自動車部品再製造市場 (数量ベース)
- 世界の自動車部品再製造市場 (単位:個数、2018年~2028年)
- 世界の自動車部品再製造市場:コンポーネント別 (単位:個数、2018年~2028年)
- 世界の自動車部品再製造市場・CAGR (%):コンポーネント別 (2018年~2021年、2023年~2028年)
- 南北アメリカの自動車部品再製造市場 (数量ベース)
- 欧州の自動車部品再製造市場 (数量ベース)
- アジア太平洋の自動車部品再製造市場 (数量ベース)
- 中東・アフリカの自動車部品再製造市場 (数量ベース)
第12章 世界の自動車部品再製造市場の動向と予測分析 (100万米ドル・CAGR、2018年~2028年)
- マクロ経済要因の影響指数
- 自動車部品再製造市場:概況
- 自動車部品再製造の市場規模 (単位:100万米ドル、2018年~2021年)
- 自動車部品再製造の市場規模 (単位:100万米ドル、2022年~2028年)
- 自動車部品再製造市場の概要
第13章 世界の自動車部品再製造市場の動向と予測分析:コンポーネント別 (2018年~2028年)
- 市場概況:コンポーネント別
- エンジン・関連部品
- トランスミッション・その他
- 電気・電子機器
- ホイール・ブレーキ
- 燃料システム
- その他のコンポーネント
第14章 世界の自動車部品再製造市場の動向と予測分析:車種別 (2018年~2028年)
- 市場概況:車種別
- 乗用車 (PV)
- 小型商用車 (LCV)
- 大型商用車 (HCV)
- オフロード車 (ORV)
- 全地形対応車 (ATV)
第15章 世界の自動車部品再製造市場の動向と予測分析:地域別 (2018年~2028年)
- 分析対象地域
第16章 南北アメリカの自動車部品再製造市場の動向と予測分析 (100万米ドル・CAGR、2018年~2028年)
- マクロ経済要因:影響指数
- 自動車部品再製造の市場力学:影響分析
- 南北アメリカの自動車部品再製造市場:概況
- 南北アメリカの自動車部品再製造の市場規模 (単位:100万米ドル、2018年~2021年)
- 南北アメリカの自動車部品再製造の市場規模 (単位:100万米ドル、2022年~2028年)
第17章 南北アメリカの自動車部品再製造市場:コンポーネント別
- 南北アメリカの自動車部品再製造市場、コンポーネント別:概要
- 南北アメリカの自動車部品再製造市場、コンポーネント別:エンジン・関連部品別
- 南北アメリカの自動車部品再製造市場、コンポーネント別:トランスミッション、その他
- 南北アメリカの自動車部品再製造市場、コンポーネント別:電気・電子機器
- 南北アメリカの自動車部品再製造市場、コンポーネント別:ホイール・ブレーキ
- 南北アメリカの自動車部品再製造市場、コンポーネント別:燃料システム
- 南北アメリカの自動車部品再製造市場、コンポーネント別:その他のコンポーネント
第18章 南北アメリカの自動車部品再製造市場:車種別
- 南北アメリカの自動車部品再製造市場、車種別:概要
- 南北アメリカの自動車部品再製造市場、車種別:乗用車
- 南北アメリカの自動車部品再製造市場、車種別:小型商用車
- 南北アメリカの自動車部品再製造市場、車種別:大型商用車
- 南北アメリカの自動車部品再製造市場、車種別:オフロード車
- 南北アメリカの自動車部品再製造市場、車種別:全地形対応車
第19章 南北アメリカの自動車部品再製造市場:国別
- 米国
- カナダ
- メキシコ
- 他の南北アメリカ諸国
第20章 欧州の自動車部品再製造市場の動向と予測分析 (100万米ドル・CAGR、2018年~2028年)
第21章 欧州の自動車部品再製造市場:コンポーネント別
第22章 欧州の自動車部品再製造市場:車種別
第23章 欧州の自動車部品再製造市場:国別
- ドイツ
- 英国
- ロシア
- 他の欧州諸国
第24章 アジア太平洋の自動車部品再製造市場の動向と予測分析 (100万米ドル・CAGR、2018年~2028年)
第25章 アジア太平洋の自動車部品再製造市場:コンポーネント別
第26章 アジア太平洋の自動車部品再製造市場:車種別
第27章 アジア太平洋の自動車部品再製造市場:国別
- 中国
- インド
- 日本
- 韓国
- 他のアジア太平洋諸国
第28章 中東・アフリカの自動車部品再製造市場の動向と予測分析 (100万米ドル・CAGR、2018年~2028年)
第29章 中東・アフリカの自動車部品再製造市場:コンポーネント別
第30章 中東・アフリカの自動車部品再製造市場:車種別
List of Figures
List of Figures
- Figure 1: Automotive Parts Remanufacturing Market for next 7 years (in USD Millions)
- Figure 2: Automotive Parts Remanufacturing Market Size, By Component, 2018 & 2028 (USD Million)
- Figure 3: Automotive Parts Remanufacturing Market Size, By Vehicle, 2021 (%)
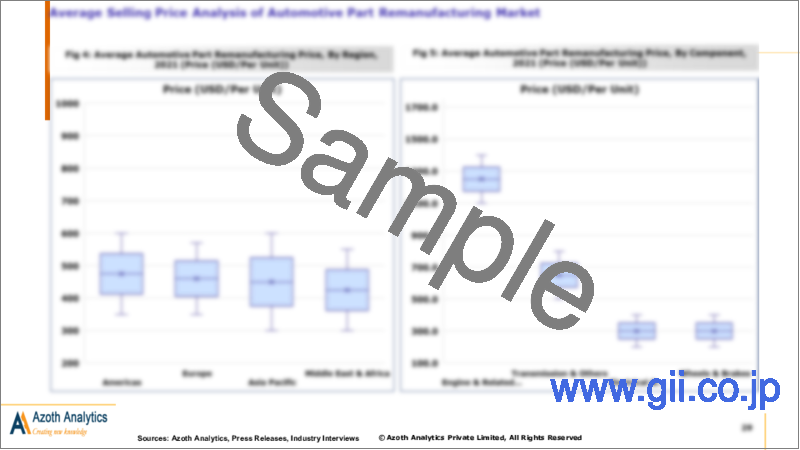
- Figure 4: Average Automotive Part Remanufacturing Price, By Region, 2021 (Price (USD/Per Unit))
- Figure 5: Average Automotive Part Remanufacturing Price, By Component, 2021 (Price (USD/Per Unit))
- Figure 6: ZF Friedrichshafen Revenues, 2019-2021 (USD Million)
- Figure 7: ZF Friedrichshafen Revenue, By Business Segments, 2021 (%)
- Figure 8: ZF Friedrichshafen Revenue, By Geographic Segments, 2021 (%)
- Figure 9: Meritor Inc. Revenue, By Business Segments, 2021 (%)
- Figure 10: Meritor Inc. Revenue, By Geographic Segments, 2021 (%)
- Figure 11: Robert Bosch and Company Revenues, 2019-2021 (USD Million)
- Figure 12: Robert Bosch Revenue, By Business Segments, 2021 (%)
- Figure 13: Robert Bosch Revenue, By Geographical Segments, 2021 (%)
- Figure 14: Caterpillar Inc.. Revenues, 2019-2021 (USD Million)
- Figure 15: Caterpillar Inc. Revenue , By Business Segments, 2021 (%)
- Figure 16: Caterpillar Inc. Revenue, By Geographical Segments, 2021 (%)
- Figure 17: Volvo Group Revenues, 2019-2021 (USD Million)
- Figure 18: Volvo Group Revenue, By Business Segments, 2021 (%)
- Figure 19: Volvo Group Revenue, By Business Segments, 2020 (%)
- Figure 20: Global Automotive Parts Remanufacturing Market Size, By Volume, 2018-2028 (Million Units)
- Figure 21: Global Automotive Parts Remanufacturing Market Size, By Component, By Volume, 2018-2028 (Million Units)
- Figure 22: Global Automotive Parts Remanufacturing Market CAGR (%), By Component, By Volume, 2018-2021,2023-2028
- Figure 23: Americas Automotive Parts Remanufacturing Market Size, By Volume, 2018-2028 (Million Units)
- Figure 24: Americas Automotive Parts Remanufacturing Market Size, By Component, By Volume, 2018-2028 (Million Units)
- Figure 25: Americas Automotive Parts Remanufacturing Market CAGR (%), By Component, By Volume, 2018-2021,2023-2028
- Figure 26: Europe Automotive Parts Remanufacturing Market Size, By Volume, 2018-2028 (Million Units)
- Figure 27: Europe Automotive Parts Remanufacturing Market Size, By Component, By Volume, 2018-2028 (Million Units)
- Figure 28: Europe Automotive Parts Remanufacturing Market CAGR (%), By Component, By Volume, 2018-2021,2023-2028
- Figure 29: Asia Pacific Automotive Parts Remanufacturing Market Size, By Volume, 2018-2028 (Million Units)
- Figure 30: Asia Pacific Automotive Parts Remanufacturing Market Size, By Component, By Volume, 2018-2028 (Million Units)
- Figure 31: Asia Pacific Automotive Parts Remanufacturing Market CAGR (%), By Component, By Volume, 2018-2021,2023-2028
- Figure 32: Middle East & Africa Automotive Parts Remanufacturing Market Size, By Volume, 2018-2028 (Million Units)
- Figure 33: Middle East & Africa Automotive Parts Remanufacturing Market Size, By Component, By Volume, 2018-2028 (Million Units)
- Figure 34: Middle East & Africa Automotive Parts Remanufacturing Market CAGR (%), By Component, By Volume, 2018-2021,2023-2028
- Figure 35: At a CAGR of 7.43% during 2023-2028, the global market value is expected to reach USD 89301.48 Million in2028
- Figure 36: Volume sales of Automotive Parts Remanufacturing is expected to sustain a staggering sales of 184358 units in 2028
- Figure 37: Basis Point Analysis of Global Automotive Parts Remanufacturing Market, By Region (2022,2028)
- Figure 38: Market Opportunity Analysis of Global Automotive Parts Remanufacturing Market, By Region (2023-2028)
- Figure 39: Global Automotive Parts Remanufacturing Market Size, By Value, 2018-2021(USD Million)
- Figure 40: Global Automotive Parts Remanufacturing Market Size, By Value, 2022-2028 (USD Million)
- Figure 41: Global Automotive Parts Remanufacturing Market Share, By Vehicle, 2021 (%)
- Figure 42: Global Automotive Parts Remanufacturing Market CAGR, By Component, By Value, 2018-2021, 2023-2028 (%)
- Figure 43: Basis Point Analysis of Global Automotive Parts Remanufacturing Market, By Component (2022,2028)
- Figure 44: Market Opportunity Analysis of Global Automotive Parts Remanufacturing Market, By Component (2023-2028)
- Figure 45: Global Engine and Related Parts Remanufacturing Market, By Value, 2018-2021 (USD Million)
- Figure 46: Global Engine and Related Parts Remanufacturing Market, By Value, 2022-2028 (USD Million)
- Figure 47: Global Engine and Related Parts Remanufacturing Market Absolute Opportunity, 2018-2028 (USD Million)
- Figure 48: Global Engine and Related Parts Remanufacturing Market, By Type, By Value, 2021 (%)
- Figure 49: Global Transmission & Others Remanufacturing Market, By Value, 2018-2021 (USD Million)
- Figure 50: Transmission & Others Remanufacturing Market, By Value, 2022-2028 (USD Million)
- Figure 51: Global Transmission & Others Remanufacturing Market Absolute Opportunity, 2018-2028 (USD Million)
- Figure 52: Global Transmission & Others Remanufacturing Market, By Type, By Value, 2021 (%)
- Figure 53: Global Electrical & Electronics Remanufacturing Market, By Value, 2018-2021 (USD Million)
- Figure 54: Global Electrical & Electronics Remanufacturing Market, By Value, 2022-2028 (USD Million)
- Figure 55: Global Electrical & Electronics Remanufacturing Market Absolute Opportunity, 2018-2028 (USD Million)
- Figure 56: Global Electrical & Electronics Remanufacturing Market, By Type, By Value, 2021 (%)
- Figure 57: Global Wheels & Brakes Remanufacturing Market, By Value, 2018-2021 (USD Million)
- Figure 58: Global Wheels & Brakes Remanufacturing Market, By Value, 2022-2028 (USD Million)
- Figure 59: Global Wheels & Brakes Remanufacturing Market Absolute Opportunity, 2018-2028 (USD Million)
- Figure 60: Global Wheels & Brakes Remanufacturing Market, By Type, By Value, 2021 (%)
- Figure 61: Global Fuel Systems Remanufacturing Market, By Value, 2018-2021 (USD Million)
- Figure 62: Global Fuel Systems Parts Remanufacturing Market, By Value, 2022-2028 (USD Million)
- Figure 63: Global Fuel Systems Remanufacturing Market Absolute Opportunity, 2018-2028 (USD Million)
- Figure 64: Global Other Components Remanufacturing Market, By Value, 2018-2021 (USD Million)
- Figure 65: Global Other Components Remanufacturing Market, By Value, 2022-2028 (USD Million)
- Figure 66: Global Other Components Remanufacturing Market Absolute Opportunity, 2018-2028 (USD Million)
- Figure 67: Global Automotive Parts Remanufacturing Market CAGR, By Vehicle, By Value, 2018-2021, 2023-2028 (%)
- Figure 68: Basis Point Analysis of Global Automotive Parts Remanufacturing Market, By Vehicle (2022,2028)
- Figure 69: Market Opportunity Analysis of Global Automotive Parts Remanufacturing Market, By Vehicle(2023-2028)
- Figure 70: Global Passenger Vehicles Remanufacturing Market, By Value, 2018-2021 (USD Million)
- Figure 71: Global Passenger Vehicles Remanufacturing Market, By Value, 2022-2028 (USD Million)
- Figure 72: Global Passenger Vehicles Remanufacturing Market Absolute Opportunity, 2018-2028 (USD Million)
- Figure 73: Global Light Commercial Vehicles Remanufacturing Market, By Value, 2018-2021 (USD Million)
- Figure 74: Global Light Commercial Vehicles Remanufacturing Market, By Value, 2022-2028 (USD Million)
- Figure 75: Global Light Commercial Vehicles Remanufacturing Market Absolute Opportunity, 2018-2028 (USD Million)
- Figure 76: Global Heavy Commercial Vehicles Remanufacturing Market, By Value, 2018-2021 (USD Million)
- Figure 77: Global Heavy Commercial Vehicles Remanufacturing Market, By Value, 2022-2028 (USD Million)
- Figure 78: Global Heavy Commercial Vehicles Remanufacturing Market Absolute Opportunity, 2018-2028 (USD Million)
- Figure 79: Global Off-Road Vehicles Remanufacturing Market, By Value, 2018-2021 (USD Million)
- Figure 80: Global Off-Road Vehicles Remanufacturing Market, By Value, 2022-2028 (USD Million)
- Figure 81: Global Off-Road Vehicles Remanufacturing Market Absolute Opportunity, 2018-2028 (USD Million)
- Figure 82: Global All-Terrain Vehicles Remanufacturing Market, By Value, 2018-2021 (USD Million)
- Figure 83: Global All-Terrain Vehicles Remanufacturing Market, By Value, 2022-2028 (USD Million)
- Figure 84: Global All-Terrain Vehicles Remanufacturing Market Absolute Opportunity, 2018-2028 (USD Million)
- Figure 85: Market Value of the Americas is expected to grow from USD 25951.88 Mn to USD 45927.75 Mn in 2028
- Figure 86: Americas Automotive Parts Remanufacturing Market is expected to foresee an absolute opportunity of 39.48 Mn Units during 2018-2028
- Figure 87: Market Value by Component
- Figure 88: Market Value by Vehicle
- Figure 89: Top 3 Countries of Automotive Parts Remanufacturing Market in Americas
- Figure 90: Basis Point Analysis of Americas Automotive Parts Remanufacturing Market, By Country (2022,2028)
- Figure 91: Market Opportunity Analysis of Americas Automotive Parts Remanufacturing Market, By Country (2023-2028)
- Figure 92: Americas Automotive Parts Remanufacturing Market Size, By Value, 2018-2021(USD Million)
- Figure 93: Americas Automotive Parts Remanufacturing Market Size, By Value, 2022-2028 (USD Million)
- Figure 94: Americas Automotive Parts Remanufacturing Market Share, By Vehicle Type, 2021 (%)
- Figure 95: Americas Automotive Parts Remanufacturing Market CAGR, By Component, By Value, 2018-2021, 2023-2028 (%)
- Figure 96: Basis Point Analysis of Americas Automotive Parts Remanufacturing Market, By Component (2022,2028)
- Figure 97: Market Opportunity Analysis of Americas Automotive Parts Remanufacturing Market, By Component (2023-2028)
- Figure 98: Americas Engine and Related Parts Remanufacturing Market, By Value, 2018-2021 (USD Million)
- Figure 99: Americas Engine and Related Parts Remanufacturing Market, By Value, 2022-2028 (USD Million)
- Figure 100: Americas Engine and Related Parts Remanufacturing Market Absolute Opportunity, 2018-2028 (USD Million)
- Figure 101: Americas Engine and Related Parts Remanufacturing Market, By Type, By Value, 2021 (%)
- Figure 102: Americas Transmission & Others Remanufacturing Market, By Value, 2018-2021 (USD Million)
- Figure 103: Transmission & Others Remanufacturing Market, By Value, 2022-2028 (USD Million)
- Figure 104: Americas Transmission & Others Remanufacturing Market Absolute Opportunity, 2018-2028 (USD Million)
- Figure 105: Americas Transmission & Others Remanufacturing Market, By Type, By Value, 2021 (%)
- Figure 106: Americas Electrical & Electronics Remanufacturing Market, By Value, 2018-2021 (USD Million)
- Figure 107: Americas Electrical & Electronics Remanufacturing Market, By Value, 2022-2028 (USD Million)
- Figure 108: Americas Electrical & Electronics Remanufacturing Market Absolute Opportunity, 2018-2028 (USD Million)
- Figure 109: Americas Electrical & Electronics Remanufacturing Market, By Type, By Value, 2021 (%)
- Figure 110: Americas Wheels & Brakes Remanufacturing Market, By Value, 2018-2021 (USD Million)
- Figure 111: Americas Wheels & Brakes Remanufacturing Market, By Value, 2022-2028 (USD Million)
- Figure 112: Americas Wheels & Brakes Remanufacturing Market Absolute Opportunity, 2018-2028 (USD Million)
- Figure 113: Americas Wheels & Brakes Remanufacturing Market, By Type, By Value, 2021 (%)
- Figure 114: Americas Fuel Systems Remanufacturing Market, By Value, 2018-2021 (USD Million)
- Figure 115: Americas Fuel Systems Parts Remanufacturing Market, By Value, 2022-2028 (USD Million)
- Figure 116: Americas Fuel Systems Remanufacturing Market Absolute Opportunity, 2018-2028 (USD Million)
- Figure 117: Americas Other Components Remanufacturing Market, By Value, 2018-2021 (USD Million)
- Figure 118: Americas Other Components Remanufacturing Market, By Value, 2022-2028 (USD Million)
- Figure 119: Americas Other Components Remanufacturing Market Absolute Opportunity, 2018-2028 (USD Million)
- Figure 120: Americas Automotive Parts Remanufacturing Market CAGR, By Vehicle, By Value, 2018-2021, 2023-2028 (%)
- Figure 121: Basis Point Analysis of Americas Automotive Parts Remanufacturing Market, By Vehicle (2022,2028)
- Figure 122: Market Opportunity Analysis of Americas Automotive Parts Remanufacturing Market, By Vehicle(2023-2028)
- Figure 123: Americas Passenger Vehicles Remanufacturing Market, By Value, 2018-2021 (USD Million)
- Figure 124: Americas Passenger Vehicles Remanufacturing Market, By Value, 2022-2028 (USD Million)
- Figure 125: Americas Passenger Vehicles Remanufacturing Footprint in Global Market, 2021 (% of Global Market)
- Figure 126: Americas Light Commercial Vehicles Remanufacturing Market, By Value, 2018-2021 (USD Million)
- Figure 127: Americas Light Commercial Vehicles Remanufacturing Market, By Value, 2022-2028 (USD Million)
- Figure 128: Americas Light Commercial Vehicles Manufacturing Footprint in Global Market, 2021 (% of Global Market)
- Figure 129: Americas Heavy Commercial Vehicles Market Size, By Value, 2018-2021 (USD Million)
- Figure 130: Americas Heavy Commercial Vehicles Market Size, By Below 10 KG, By Value, 2022-2028 (USD Million)
- Figure 131: Americas Heavy Commercial Vehicles Footprint in Global Market, 2021 (% of Global Market)
- Figure 132: Americas Off-Road Vehicles Remanufacturing Market, By Value, 2018-2021 (USD Million)
- Figure 133: Americas Off-Road Vehicles Remanufacturing Market, By Value, 2022-2028 (USD Million)
- Figure 134: Americas Off-Road Vehicles Remanufacturing Footprint in Global Market, 2021 (USD Million)
- Figure 135: Americas All-Terrain Vehicles Remanufacturing Market, By Value, 2018-2021 (USD Million)
- Figure 136: Americas All-Terrain Vehicles Remanufacturing Market, By Value, 2022-2028 (USD Million)
- Figure 137: Americas All-Terrain Vehicles Remanufacturing Footprint in Global Market, 2021 (USD Million)
- Figure 138: United States Automotive Parts Remanufacturing Market, By Value, 2018-2028 (USD Million)
- Figure 139: United States Automotive Parts Remanufacturing Market, CAGR, By Value, 2018-2021, 2023-2028 (%)
- Figure 140: United States Automotive Parts Remanufacturing Market Value, By Component, 2021 (USD Million)
- Figure 141: United States Automotive Parts Remanufacturing Market Share, By Component, By Value, 2021 (%)
- Figure 142: United States Automotive Parts Remanufacturing Market Share, By Vehicle, By Value, 2021 (%)
- Figure 143: Canada Automotive Parts Remanufacturing Market, By Value, 2018-2028 (USD Million)
- Figure 144: Canada Automotive Parts Remanufacturing Market, CAGR, By Value, 2018-2021, 2023-2028 (%)
- Figure 145: Canada Automotive Parts Remanufacturing Market Value, By Component, 2021 (USD Million)
- Figure 146: Canada Automotive Parts Remanufacturing Market Share, By Component, By Value, 2021 (%)
- Figure 147: Canada Automotive Parts Remanufacturing Market Share, By Vehicle, By Value, 2021 (%)
- Figure 148: Mexico Automotive Parts Remanufacturing Market, By Value, 2018-2028 (USD Million)
- Figure 149: Mexico Automotive Parts Remanufacturing Market, CAGR, By Value, 2018-2021, 2023-2028 (%)
- Figure 150: Mexico Automotive Parts Remanufacturing Market Value, By Component, 2021 (USD Million)
- Figure 151: Mexico Automotive Parts Remanufacturing Market Share, By Component, By Value, 2021 (%)
- Figure 152: Mexico Automotive Parts Remanufacturing Market Share, By Vehicle, By Value, 2021 (%)
- Figure 153: Rest of Americas Automotive Parts Remanufacturing Market, By Value, 2018-2028 (USD Million)
- Figure 154: Rest of Americas Automotive Parts Remanufacturing Market, CAGR, By Value, 2018-2021, 2023-2028 (%)
- Figure 155: Rest of Americas Automotive Parts Remanufacturing Market Value, By Component, 2021 (USD Million)
- Figure 156: Rest of Americas Automotive Parts Remanufacturing Market Share, By Component, By Value, 2021 (%)
- Figure 157: Rest of Americas Automotive Parts Remanufacturing Market Share, By Vehicle, By Value, 2021 (%)
- Figure 158: Market Value of the Europe is expected to grow from USD 15425.20 Mn to USD 25191.95 Mn in 2028
- Figure 159: Europe Automotive Parts Remanufacturing Market is expected to foresee an absolute opportunity of 21865 Mn Units during 2018-2028
- Figure 160: Market Value by Component
- Figure 161: Market Value by Vehicle
- Figure 162: Top 3 Countries of Automotive Parts Remanufacturing Market in Europe
- Figure 163: Basis Point Analysis of Europe Automotive Parts Remanufacturing Market, By Country (2022,2028)
- Figure 164: Market Opportunity Analysis of Europe Automotive Parts Remanufacturing Market, By Country (2023-2028)
- Figure 165: Europe Automotive Parts Remanufacturing Market Size, By Value, 2018-2021(USD Million)
- Figure 166: Europe Automotive Parts Remanufacturing Market Size, By Value, 2022-2028 (USD Million)
- Figure 167: Europe Automotive Parts Remanufacturing Market Share, By Vehicle Type, 2021 (%)
- Figure 168: Europe Automotive Parts Remanufacturing Market CAGR, By Component, By Value, 2018-2021, 2023-2028 (%)
- Figure 169: Basis Point Analysis of Europe Automotive Parts Remanufacturing Market, By Component (2022,2028)
- Figure 170: Market Opportunity Analysis of Europe Automotive Parts Remanufacturing Market, By Component (2023-2028)
- Figure 171: Europe Engine and Related Parts Remanufacturing Market, By Value, 2018-2021 (USD Million)
- Figure 172: Europe Engine and Related Parts Remanufacturing Market, By Value, 2022-2028 (USD Million)
- Figure 173: Europe Engine and Related Parts Remanufacturing Market Absolute Opportunity, 2018-2028 (USD Million)
- Figure 174: Europe Engine and Related Parts Remanufacturing Market, By Type, By Value, 2021 (%)
- Figure 175: Europe Transmission & Others Remanufacturing Market, By Value, 2018-2021 (USD Million)
- Figure 176: Europe Transmission & Others Remanufacturing Market, By Value, 2022-2028 (USD Million)
- Figure 177: Europe Transmission & Others Remanufacturing Market Absolute Opportunity, 2018-2028 (USD Million)
- Figure 178: Europe Transmission & Others Remanufacturing Market, By Type, By Value, 2021 (%)
- Figure 179: Europe Electrical & Electronics Remanufacturing Market, By Value, 2018-2021 (USD Million)
- Figure 180: Europe Electrical & Electronics Remanufacturing Market, By Value, 2022-2028 (USD Million)
- Figure 181: Europe Electrical & Electronics Remanufacturing Market Absolute Opportunity, 2018-2028 (USD Million)
- Figure 182: Europe Electrical & Electronics Remanufacturing Market, By Type, By Value, 2021 (%)
- Figure 183: Europe Wheels & Brakes Remanufacturing Market, By Value, 2018-2021 (USD Million)
- Figure 184: Europe Wheels & Brakes Remanufacturing Market, By Value, 2022-2028 (USD Million)
- Figure 185: Europe Wheels & Brakes Remanufacturing Market Absolute Opportunity, 2018-2028 (USD Million)
- Figure 186: Europe Wheels & Brakes Remanufacturing Market, By Type, By Value, 2021 (%)
- Figure 187: Europe Fuel Systems Remanufacturing Market, By Value, 2018-2021 (USD Million)
- Figure 188: Europe Fuel Systems Parts Remanufacturing Market, By Value, 2022-2028 (USD Million)
- Figure 189: Europe Fuel Systems Remanufacturing Market Absolute Opportunity, 2018-2028 (USD Million)
- Figure 190: Europe Other Components Remanufacturing Market, By Value, 2018-2021 (USD Million)
- Figure 191: Europe Other Components Remanufacturing Market, By Value, 2022-2028 (USD Million)
- Figure 192: Europe Other Components Remanufacturing Market Absolute Opportunity, 2018-2028 (USD Million)
- Figure 193: Europe Automotive Parts Remanufacturing Market CAGR, By Vehicle, By Value, 2018-2021, 2023-2028 (%)
- Figure 194: Basis Point Analysis of Europe Automotive Parts Remanufacturing Market, By Vehicle (2022,2028)
- Figure 195: Market Opportunity Analysis of Europe Automotive Parts Remanufacturing Market, By Vehicle(2023-2028)
- Figure 196: Europe Passenger Vehicles Remanufacturing Market, By Value, 2018-2021 (USD Million)
- Figure 197: Europe Passenger Vehicles Remanufacturing Market, By Value, 2022-2028 (USD Million)
- Figure 198: Europe Passenger Vehicles Remanufacturing Footprint in Global Market, 2021 (% of Global Market)
- Figure 199: Europe Light Commercial Vehicles Remanufacturing Market, By Value, 2018-2021 (USD Million)
- Figure 200: Europe Light Commercial Vehicles Remanufacturing Market, By Value, 2022-2028 (USD Million)
- Figure 201: Europe Light Commercial Vehicles Manufacturing Footprint in Global Market, 2021 (% of Global Market)
- Figure 202: Europe Heavy Commercial Vehicles Market Size, By Value, 2018-2021 (USD Million)
- Figure 203: Europe Heavy Commercial Vehicles Market Size, By Below 10 KG, By Value, 2022-2028 (USD Million)
- Figure 204: Europe Heavy Commercial Vehicles Footprint in Global Market, 2021 (% of Global Market)
- Figure 205: Europe Off-Road Vehicles Remanufacturing Market, By Value, 2018-2021 (USD Million)
- Figure 206: Europe Off-Road Vehicles Remanufacturing Market, By Value, 2022-2028 (USD Million)
- Figure 207: Europe Off-Road Vehicles Remanufacturing Footprint in Global Market, 2021 (USD Million)
- Figure 208: Europe All-Terrain Vehicles Remanufacturing Market, By Value, 2018-2021 (USD Million)
- Figure 209: Europe All-Terrain Vehicles Remanufacturing Market, By Value, 2022-2028 (USD Million)
- Figure 210: Europe All-Terrain Vehicles Remanufacturing Footprint in Global Market, 2021 (USD Million)
- Figure 211: Germany Automotive Parts Remanufacturing Market, By Value, 2018-2028 (USD Million)
- Figure 212: Germany Automotive Parts Remanufacturing Market, CAGR, By Value, 2018-2021, 2023-2028 (%)
- Figure 213: Germany Automotive Parts Remanufacturing Market Value, By Component, 2021 (USD Million)
- Figure 214: Germany Automotive Parts Remanufacturing Market Share, By Component, By Value, 2021 (%)
- Figure 215: Germany Automotive Parts Remanufacturing Market Share, By Vehicle, By Value, 2021 (%)
- Figure 216: United Kingdom Automotive Parts Remanufacturing Market, By Value, 2018-2028 (USD Million)
- Figure 217: United Kingdom Automotive Parts Remanufacturing Market, CAGR, By Value, 2018-2021, 2023-2028 (%)
- Figure 218: United Kingdom Automotive Parts Remanufacturing Market Value, By Component, 2021 (USD Million)
- Figure 219: United Kingdom Automotive Parts Remanufacturing Market Share, By Component, By Value, 2021 (%)
- Figure 220: United Kingdom Automotive Parts Remanufacturing Market Share, By Vehicle, By Value, 2021 (%)
- Figure 221: Russia Automotive Parts Remanufacturing Market, By Value, 2018-2028 (USD Million)
- Figure 222: Russia Automotive Parts Remanufacturing Market, CAGR, By Value, 2018-2021, 2023-2028 (%)
- Figure 223: Russia Automotive Parts Remanufacturing Market Value, By Component, 2021 (USD Million)
- Figure 224: Russia Automotive Parts Remanufacturing Market Share, By Component, By Value, 2021 (%)
- Figure 225: Russia Automotive Parts Remanufacturing Market Share, By Vehicle, By Value, 2021 (%)
- Figure 226: Rest of Europe Automotive Parts Remanufacturing Market, By Value, 2018-2028 (USD Million)
- Figure 227: Rest of Europe Automotive Parts Remanufacturing Market, CAGR, By Value, 2018-2021, 2023-2028 (%)
- Figure 228: Rest of Europe Automotive Parts Remanufacturing Market Value, By Component, 2021 (USD Million)
- Figure 229: Rest of Europe Automotive Parts Remanufacturing Market Share, By Component, By Value, 2021 (%)
- Figure 230: Rest of Europe Automotive Parts Remanufacturing Market Share, By Vehicle, By Value, 2021 (%)
- Figure 231: Market Value of the Asia Pacific is expected to grow from USD 1.20 Mn to USD 6.53 Mn in 2028
- Figure 232: Asia Pacific Automotive Parts Remanufacturing Market is expected to foresee an absolute opportunity of 17.11 Mn Units during 2018-2028
- Figure 233: Market Value by Component
- Figure 234: Market Value by Vehicle
- Figure 235: Top 3 Countries of Automotive Parts Remanufacturing Market in Asia Pacific
- Figure 236: Basis Point Analysis of Asia Pacific Automotive Parts Remanufacturing Market, By Country (2022,2028)
- Figure 237: Market Opportunity Analysis of Asia Pacific Automotive Parts Remanufacturing Market, By Country (2023-2028)
- Figure 238: Asia Pacific Automotive Parts Remanufacturing Market Size, By Value, 2018-2021(USD Million)
- Figure 239: Asia Pacific Automotive Parts Remanufacturing Market Size, By Value, 2022-2028 (USD Million)
- Figure 240: Asia Pacific Automotive Parts Remanufacturing Market Share, By Vehicle Type, 2021 (%)
- Figure 241: Asia Pacific Automotive Parts Remanufacturing Market CAGR, By Component, By Value, 2018-2021, 2023-2028 (%)
- Figure 242: Basis Point Analysis of Asia Pacific Automotive Parts Remanufacturing Market, By Component (2022,2028)
- Figure 243: Market Opportunity Analysis of Asia Pacific Automotive Parts Remanufacturing Market, By Component (2023-2028)
- Figure 244: Asia Pacific Engine and Related Parts Remanufacturing Market, By Value, 2018-2021 (USD Million)
- Figure 245: Asia Pacific Engine and Related Parts Remanufacturing Market, By Value, 2022-2028 (USD Million)
- Figure 246: Asia Pacific Engine and Related Parts Remanufacturing Market Absolute Opportunity, 2018-2028 (USD Million)
- Figure 247: Asia Pacific Engine and Related Parts Remanufacturing Market, By Type, By Value, 2021 (%)
- Figure 248: Asia Pacific Transmission & Others Remanufacturing Market, By Value, 2018-2021 (USD Million)
- Figure 249: Asia Pacific Transmission & Others Remanufacturing Market, By Value, 2022-2028 (USD Million)
- Figure 250: Asia Pacific Transmission & Others Remanufacturing Market Absolute Opportunity, 2018-2028 (USD Million)
- Figure 251: Asia Pacific Transmission & Others Remanufacturing Market, By Type, By Value, 2021 (%)
- Figure 252: Asia Pacific Electrical & Electronics Remanufacturing Market, By Value, 2018-2021 (USD Million)
- Figure 253: Asia Pacific Electrical & Electronics Remanufacturing Market, By Value, 2022-2028 (USD Million)
- Figure 254: Asia Pacific Electrical & Electronics Remanufacturing Market Absolute Opportunity, 2018-2028 (USD Million)
- Figure 255: Asia Pacific Electrical & Electronics Remanufacturing Market, By Type, By Value, 2021 (%)
- Figure 256: Asia Pacific Wheels & Brakes Remanufacturing Market, By Value, 2018-2021 (USD Million)
- Figure 257: Asia Pacific Wheels & Brakes Remanufacturing Market, By Value, 2022-2028 (USD Million)
- Figure 258: Asia Pacific Wheels & Brakes Remanufacturing Market Absolute Opportunity, 2018-2028 (USD Million)
- Figure 259: Asia Pacific Wheels & Brakes Remanufacturing Market, By Type, By Value, 2021 (%)
- Figure 260: Asia Pacific Fuel Systems Remanufacturing Market, By Value, 2018-2021 (USD Million)
- Figure 261: Asia Pacific Fuel Systems Parts Remanufacturing Market, By Value, 2022-2028 (USD Million)
- Figure 262: Asia Pacific Fuel Systems Remanufacturing Market Absolute Opportunity, 2018-2028 (USD Million)
- Figure 263: Asia Pacific Other Components Remanufacturing Market, By Value, 2018-2021 (USD Million)
- Figure 264: Asia Pacific Other Components Remanufacturing Market, By Value, 2022-2028 (USD Million)
- Figure 265: Asia Pacific Other Components Remanufacturing Market Absolute Opportunity, 2018-2028 (USD Million)
- Figure 266: Asia Pacific Automotive Parts Remanufacturing Market CAGR, By Vehicle, By Value, 2018-2021, 2023-2028 (%)
- Figure 267: Basis Point Analysis of Asia Pacific Automotive Parts Remanufacturing Market, By Vehicle (2022,2028)
- Figure 268: Market Opportunity Analysis of Asia Pacific Automotive Parts Remanufacturing Market, By Vehicle(2023-2028)
- Figure 269: Asia Pacific Passenger Vehicles Remanufacturing Market, By Value, 2018-2021 (USD Million)
- Figure 270: Asia Pacific Passenger Vehicles Remanufacturing Market, By Value, 2022-2028 (USD Million)
- Figure 271: Asia Pacific Passenger Vehicles Remanufacturing Footprint in Global Market, 2021 (% of Global Market)
- Figure 272: Asia Pacific Light Commercial Vehicles Remanufacturing Market, By Value, 2018-2021 (USD Million)
- Figure 273: Asia Pacific Light Commercial Vehicles Remanufacturing Market, By Value, 2022-2028 (USD Million)
- Figure 274: Asia Pacific Light Commercial Vehicles Manufacturing Footprint in Global Market, 2021 (% of Global Market)
- Figure 275: Asia Pacific Heavy Commercial Vehicles Market Size, By Value, 2018-2021 (USD Million)
- Figure 276: Asia Pacific Heavy Commercial Vehicles Market Size, By Below 10 KG, By Value, 2022-2028 (USD Million)
- Figure 277: Asia Pacific Heavy Commercial Vehicles Footprint in Global Market, 2021 (% of Global Market)
- Figure 278: Asia Pacific Off-Road Vehicles Remanufacturing Market, By Value, 2018-2021 (USD Million)
- Figure 279: Asia Pacific Off-Road Vehicles Remanufacturing Market, By Value, 2022-2028 (USD Million)
- Figure 280: Asia Pacific Off-Road Vehicles Remanufacturing Footprint in Global Market, 2021 (USD Million)
- Figure 281: Asia Pacific All-Terrain Vehicles Remanufacturing Market, By Value, 2018-2021 (USD Million)
- Figure 282: Asia Pacific All-Terrain Vehicles Remanufacturing Market, By Value, 2022-2028 (USD Million)
- Figure 283: Asia Pacific All-Terrain Vehicles Remanufacturing Footprint in Global Market, 2021 (USD Million)
- Figure 284: China Automotive Parts Remanufacturing Market, By Value, 2018-2028 (USD Million)
- Figure 285: China Automotive Parts Remanufacturing Market, CAGR, By Value, 2018-2021, 2023-2028 (%)
- Figure 286: China Automotive Parts Remanufacturing Market Value, By Component, 2021 (USD Million)
- Figure 287: China Automotive Parts Remanufacturing Market Share, By Component, By Value, 2021 (%)
- Figure 288: China Automotive Parts Remanufacturing Market Share, By Vehicle, By Value, 2021 (%)
- Figure 289: India Automotive Parts Remanufacturing Market, By Value, 2018-2028 (USD Million)
- Figure 290: India Automotive Parts Remanufacturing Market, CAGR, By Value, 2018-2021, 2023-2028 (%)
- Figure 291: India Automotive Parts Remanufacturing Market Value, By Component, 2021 (USD Million)
- Figure 292: India Automotive Parts Remanufacturing Market Share, By Component, By Value, 2021 (%)
- Figure 293: India Automotive Parts Remanufacturing Market Share, By Vehicle, By Value, 2021 (%)
- Figure 294: Japan Automotive Parts Remanufacturing Market, By Value, 2018-2028 (USD Million)
- Figure 295: Japan Automotive Parts Remanufacturing Market, CAGR, By Value, 2018-2021, 2023-2028 (%)
- Figure 296: Japan Automotive Parts Remanufacturing Market Value, By Component, 2021 (USD Million)
- Figure 297: Japan Automotive Parts Remanufacturing Market Share, By Component, By Value, 2021 (%)
- Figure 298: Japan Automotive Parts Remanufacturing Market Share, By Vehicle, By Value, 2021 (%)
- Figure 299: South Korea Automotive Parts Remanufacturing Market, By Value, 2018-2028 (USD Million)
- Figure 300: South Korea Automotive Parts Remanufacturing Market, CAGR, By Value, 2018-2021, 2023-2028 (%)
- Figure 301: South Korea Automotive Parts Remanufacturing Market Value, By Component, 2021 (USD Million)
- Figure 302: South Korea Automotive Parts Remanufacturing Market Share, By Component, By Value, 2021 (%)
- Figure 303: South Korea Automotive Parts Remanufacturing Market Share, By Vehicle, By Value, 2021 (%)
- Figure 304: Rest of Asia Pacific Automotive Parts Remanufacturing Market, By Value, 2018-2028 (USD Million)
- Figure 305: Rest of Asia Pacific Automotive Parts Remanufacturing Market, CAGR, By Value, 2018-2021, 2023-2028 (%)
- Figure 306: Rest of Asia Pacific Automotive Parts Remanufacturing Market Value, By Component, 2021 (USD Million)
- Figure 307: Rest of Asia Pacific Automotive Parts Remanufacturing Market Share, By Component, By Value, 2021 (%)
- Figure 308: Rest of Asia Pacific Automotive Parts Remanufacturing Market Share, By Vehicle, By Value, 2021 (%)
- Figure 309: Market Value of the Middle East & Africa is expected to grow from USD 1785.9 Mn to USD 2714.76 Mn in 2028
- Figure 310: Middle East & Africa Automotive Parts Remanufacturing Market is expected to foresee an absolute opportunity of 1.17 Mn Units during 2018-2028
- Figure 311: Market Value by Component
- Figure 312: Market Value by Vehicle
- Figure 313: Middle East & Africa Automotive Parts Remanufacturing Market Size, By Value, 2018-2021(USD Million)
- Figure 314: Middle East & Africa Automotive Parts Remanufacturing Market Size, By Value, 2022-2028 (USD Million)
- Figure 315: Middle East & Africa Automotive Parts Remanufacturing Market Share, By Vehicle, 2021 (%)
- Figure 316: Middle East & Africa Automotive Parts Remanufacturing Market CAGR, By Component, By Value, 2018-2021, 2023-2028 (%)
- Figure 317: Basis Point Analysis of Middle East & Africa Automotive Parts Remanufacturing Market, By Component (2022,2028)
- Figure 318: Market Opportunity Analysis of Middle East & Africa Automotive Parts Remanufacturing Market, By Component (2023-2028)
- Figure 319: Middle East & Africa Engine and Related Parts Remanufacturing Market, By Value, 2018-2021 (USD Million)
- Figure 320: Middle East & Africa Engine and Related Parts Remanufacturing Market, By Value, 2022-2028 (USD Million)
- Figure 321: Middle East & Africa Engine and Related Parts Remanufacturing Market Absolute Opportunity, 2018-2028 (USD Million)
- Figure 322
Executive Summary
The Global Automotive Parts Remanufacturing market was valued at USD 54710.12 Million in 2021 and is expected to grow at a CAGR of 7.43% during the forecast period of 2023-2028. The shortage of raw materials is driving the growth of the automotive parts remanufacturing market as remanufactured parts are extracted from older vehicles and renovated. This factor eliminates the need to exact materials from mines and ores. Remanufactured parts cost nearly 50-75% as much as the original product while providing the same quality.
Further, strict government regulations towards waste management is resulting in a decline in the manufacturing of new automotive parts and the rising awareness among consumers for eco-friendly products is boosting the demand for the remanufactured parts market globally.
End customers have various options for automotive parts remanufacturing in the market. Predictive maintenance, also referred to as condition-based maintenance, is a technique adopted by companies to continuously monitor real working conditions to ensure asset optimization of the installed parts in the vehicles. Engine and related parts and electronics and electrical equipment are the most popular products used in the industry, which are utilized not only in passenger vehicles but also in LCVs and HCVs.
Further, the widespread use of remanufactured parts in passenger vehicles is expected to remain the most potential category by present vehicle types. Hence the companies are focusing on this segment. Overall, the Automotive Part Remanufacturing market is fragmented and China, India and United States are estimated to be the largest contributor to the global market owing to increasing vehicle parts remanufacturing facilities as well as sales.
Scope of the Report
- The report analyses the Automotive Parts Remanufacturing Market by Value (USD Million).
- The report analyses the Automotive Parts Remanufacturing Market by Volume (Million Units).
- The report presents the analysis of the Automotive Parts Remanufacturing market for the historical period of 2018-2021, the estimated year 2022 and the forecast period of 2023-2028.
- The report analyses the Automotive Parts Remanufacturing Market by Component (Engine & Related Parts, Transmission & Others, Electrical & Electronics, Wheels & Brakes, Fuel Systems, Other Components).
- The report analyses the Automotive Parts Remanufacturing Market By Vehicle (Passenger Vehicles, Light Commercial Vehicles, Heavy Commercial Vehicles, Off-Road Vehicles, All-Terrain Vehicles)
- The Global Automotive Parts Remanufacturing Market has been analyzed by countries (United States, Canada, Mexico, Germany, UK, Russia, China, Japan, India, South Korea).
- The key insights of the report have been presented through the frameworks of SWOT and Porter's Five Forces Analysis. Also, the attractiveness of the market has been presented by region, by component, by vehicle.
- Also, the major opportunities, trends, drivers and challenges of the industry have been analysed in the report.
- The report tracks competitive developments, strategies, mergers and acquisitions and new product development. The companies analysed in the report include ZF Friedrichshafen, BBB Industries, Meritor Inc., Budweg, Monark Automotive, Cardone Industries, Robert Bosch, Caterpillar Inc., Volvo Group, Carwood.
Key Target Audience
- Automotive Manufacturers
- Consulting and Advisory Firms
- Research and Development Organizations
- Government and Regulatory Authorities
Table of Contents
1. Introduction: Automotive Parts Remanufacturing Market
- 1.1 Overview
- 1.2 Scope of Research
2. Executive Summary
- 2.1 Market Dashboard
- 2.2 Regional Insights
- 2.3 Market Ecosystem Factors
3. Research Methodology
- 3.1 Data Collection Process
- 3.2 Market Trajectory Estimation
- 3.3 Market Size Calculation
4. Automotive Parts Remanufacturing Market Dynamics
- 4.1 Drivers
- 4.2 Restraints
- 4.3 Opportunities
- 4.4 Trends
- 4.5 Impact assessment of Market Dynamics
5. Value Chain
- 5.1 Component Suppliers
- 5.2 Remanufacturers
- 5.3 Distributors/Retailers
- 5.4 Spare Part Suppliers
6. Covid-19 Impact Assessment
- 6.1 Assessment of Degree of Impact of Covid-19 on Global Automotive Parts Remanufacturing Market
- 6.2 Region-Wise Quarterly Covid Impact Analysis
7. Porter's Five Forces Analysis
8. Macro Economic Indicator Outlook
- 8.1 Manufacturing Sector
- 8.2 Global Vehicle Sales
- 8.3 Investments in Different Sectors
- 8.4 Gross National Income, PPP
- 8.5 Urbanization
9. Automotive Parts Remanufacturing Market: Average Selling Price Analysis
- 9.1 Average Selling Price, By Region
- 9.2 Average Selling Price, By Component
10. Competitive Positioning
- 10.1 Companies' Product Positioning
- 10.2 Market Position Matrix
- 10.3 Market Share Analysis
- 10.3.1 ZF Friedrichshafen
- 10.3.2 BBB Industries
- 10.3.3 Meritor Inc.
- 10.3.4 Budweg
- 10.3.5 Monark Automotive
- 10.3.6 Cardone Industries
- 10.3.7 Robert Bosch
- 10.3.8 Caterpillar Inc.
- 10.3.9 Volvo Group
- 10.3.10 Carwood
11. Volumetric Analysis, Units, 2018-2028
- 11.1 Global Automotive Parts Remanufacturing Market, By Volume
- 11.1.1 Global Automotive Parts Remanufacturing Market, 2018-2028 (Units)
- 11.1.2 Global Automotive Parts Remanufacturing Market, By Components, 2018-2028 (Units)
- 11.1.3 Global Automotive Parts Remanufacturing Market, By Components, 2018-2021, 2023-2028 CAGR (%)
- 11.2 Americas Automotive Parts Remanufacturing Market, By Volume
- 11.2.1 Americas Automotive Parts Remanufacturing Market, 2018-2028 (Units)
- 11.2.2 Americas Automotive Parts Remanufacturing Market, By Components, 2018-2028 (Units)
- 11.2.3 Americas Automotive Parts Remanufacturing Market, By Components, 2018-2021, 2023-2028 CAGR (%)
- 11.3 Europe Automotive Parts Remanufacturing Market, By Volume
- 11.3.1 Europe Automotive Parts Remanufacturing Market, 2018-2028 (Units)
- 11.3.2 Europe Automotive Parts Remanufacturing Market, By Components, 2018-2028 (Units)
- 11.3.3 Europe Automotive Parts Remanufacturing Market, By Components, 2018-2021, 2023-2028 CAGR (%)
- 11.4 Asia Pacific Automotive Parts Remanufacturing Market, By Volume
- 11.4.1 Asia Pacific Automotive Parts Remanufacturing Market, 2018-2028 (Units)
- 11.4.2 Asia Pacific Automotive Parts Remanufacturing Market, By Components, 2018-2028 (Units)
- 11.4.3 Asia Pacific Automotive Parts Remanufacturing Market, By Components, 2018-2021, 2023-2028 CAGR (%)
- 11.5 Middle East & Africa Automotive Parts Remanufacturing Market, By Volume
- 11.5.1 Middle East & Africa Automotive Parts Remanufacturing Market, 2018-2028 (Units)
- 11.5.2 Middle East & Africa Automotive Parts Remanufacturing Market, By Components, 2018-2028 (Units)
- 11.5.3 Middle East & Africa Automotive Parts Remanufacturing Market, By Components, 2018-2021, 2023-2028 CAGR (%)
12. Global Automotive Parts Remanufacturing Market Trends and Forecast Analysis, 2018-2028, USD MILLION & CAGR
- 12.1 Macro Economic Factor Impact Index
- 12.2 Automotive Parts Remanufacturing Market: Dashboard
- 12.3 Automotive Parts Remanufacturing Market Size, By Value, 2018-2021(USD Million)
- 12.4 Automotive Parts Remanufacturing Market Size, By Value, 2022-2028 (USD Million)
- 12.5 Automotive Parts Remanufacturing Market: Summary
13. Global Automotive Parts Remanufacturing Market Trend And Forecast Analysis, 2018-2028, By Component
- 13.1 Automotive Parts Remanufacturing Market Trend And Forecast Analysis, By Component: Snapshot
- 13.2 Engine & Related Parts
- 13.3 Transmission & Others
- 13.4 Electrical & Electronics
- 13.5 Wheels & Brakes
- 13.6 Fuel Systems
- 13.7 Other Components
14. Global Automotive Parts Remanufacturing Market Trend And Forecast Analysis, 2018-2028, By By Vehicle
- 14.1 Automotive Parts Remanufacturing Market Trend And Forecast Analysis, By Vehicle: Snapshot
- 14.2 Passenger Vehicles
- 14.3 Light Commercial Vehicles
- 14.4 Heavy Commercial Vehicles
- 14.5 Off-Road Vehicles
- 14.6 All-Terrain Vehicles
15. Global Automotive Parts Remanufacturing Market Trend And Forecast Analysis, 2018-2028, By Region
- 15.1 Regional Coverage of the Study
16. Americas Automotive Parts Remanufacturing Market Trends and Forecast Analysis, 2018-2028, USD MILLION & CAGR
- 16.1 Macro Economic Factor Impact Index
- 16.2 Impact analysis of market dynamics on Automotive Parts Remanufacturing Market
- 16.3 Americas Automotive Parts Remanufacturing Market: Dashboard
- 16.4 Americas Automotive Parts Remanufacturing Market Size, By Value, 2018-2021(USD Million)
- 16.5 Americas Automotive Parts Remanufacturing Market Size, By Value, 2022-2028 (USD Million)
17 Americas Automotive Parts Remanufacturing Market, By Component
- 17.1 Americas Automotive Parts Remanufacturing Market: Component Overview
- 17.2 Americas Automotive Parts Remanufacturing Market: Component, By Engine & Related Parts
- 17.3 Americas Automotive Parts Remanufacturing Market: Component, By Transmission & Others
- 17.4 Americas Automotive Parts Remanufacturing Market: Component, By Electrical and Electronics
- 17.5 Americas Automotive Parts Remanufacturing Market: Component, By Wheels & Brakes
- 17.6 Americas Automotive Parts Remanufacturing Market: Component, By Fuel Systems
- 17.7 Americas Automotive Parts Remanufacturing Market: Component, By Other Components
18. Americas Automotive Parts Remanufacturing Market, By Vehicle
- 18.1 Americas Automotive Parts Remanufacturing Market: Vehicle Overview
- 18.2 Americas Automotive Parts Remanufacturing Market: Vehicle, By Passenger Vehicles
- 18.3 Americas Automotive Parts Remanufacturing Market: Vehicle, By Light Commercial Vehicles
- 18.4 Americas Automotive Parts Remanufacturing Market: Vehicle, By Heavy Commercial Vehicles
- 18.5 Americas Automotive Parts Remanufacturing Market: Vehicle, By Off-Road Vehicles
- 18.6 Americas Automotive Parts Remanufacturing Market: Vehicle, By All-Terrain Vehicles
19. Americas Automotive Parts Remanufacturing Market, By Country
- 19.1 United States
- 19.2 Canada
- 19.3 Mexico
- 19.4 Rest of Americas
20. Europe Automotive Parts Remanufacturing Market Trends and Forecast Analysis, 2018-2028, USD MILLION & CAGR
- 20.1 Macro Economic Factor Impact Index
- 20.2 Impact analysis of market dynamics on the Automotive Parts Remanufacturing Market
- 20.3 Europe Automotive Parts Remanufacturing Market: Dashboard
- 20.4 Europe Automotive Parts Remanufacturing Market Size, By Value, 2018-2021(USD Million)
- 20.5 Europe Automotive Parts Remanufacturing Market Size, By Value, 2022-2028 (USD Million)
21. Europe Automotive Parts Remanufacturing Market, By Component
- 21.1 Europe Automotive Parts Remanufacturing Market: Component Overview
- 21.2 Europe Automotive Parts Remanufacturing Market: Component, By Engine & Related Parts
- 21.3 Europe Automotive Parts Remanufacturing Market: Component, By Transmission & Others
- 21.4 Europe Automotive Parts Remanufacturing Market: Component, By Electrical & Electronics
- 21.5 Europe Automotive Parts Remanufacturing Market: Component, By Wheels & Brakes
- 21.6 Europe Automotive Parts Remanufacturing Market: Component, By Fuel Systems
- 21.7 Europe Automotive Parts Remanufacturing Market: Component, By Other Components
22. Europe Automotive Parts Remanufacturing Market, By Vehicle
- 22.1 Europe Automotive Parts Remanufacturing Market: Vehicle Overview
- 22.2 Europe Automotive Parts Remanufacturing Market: Vehicle, By Passenger Vehicles
- 22.3 Europe Automotive Parts Remanufacturing Market: Vehicle, By Light Commercial Vehicles
- 22.4 Europe Automotive Parts Remanufacturing Market: Vehicle, By Heavy Commercial Vehicles
- 22.5 Europe Automotive Parts Remanufacturing Market: Vehicle, By Off-Road Vehicles
- 22.6 Europe Automotive Parts Remanufacturing Market: Vehicle, By All-Terrain Vehicles
23. Europe Automotive Parts Remanufacturing Market, By Country
- 23.1 Germany
- 23.2 United Kingdom
- 23.4 Russia
- 23.5 Rest of Europe
24. Asia Pacific Automotive Parts Remanufacturing Market Trends and Forecast Analysis, 2018-2028, USD MILLION & CAGR
- 24.1 Macro Economic Factor Impact Index
- 24.2 Impact analysis of market dynamics on Automotive Parts Remanufacturing Market
- 24.3 Asia Pacific Automotive Parts Remanufacturing Market: Dashboard
- 24.4 Asia Pacific Automotive Parts Remanufacturing Market Size, By Value, 2018-2021(USD Million)
- 24.5 Asia Pacific Automotive Parts Remanufacturing Market Size, By Value, 2022-2028 (USD Million)
25. Asia Pacific Automotive Parts Remanufacturing Market, By Component
- 25.1 Asia Pacific Automotive Parts Remanufacturing Market: Component Overview
- 25.2 Asia Pacific Automotive Parts Remanufacturing Market: Component, By Engine & Related Parts
- 25.3 Asia Pacific Automotive Parts Remanufacturing Market: Component, By Transmission & Others
- 25.4 Asia Pacific Automotive Parts Remanufacturing Market: Component, By Electrical & Electronics
- 25.5 Asia Pacific Automotive Parts Remanufacturing Market: Component, By Wheels & Brakes
- 25.6 Asia Pacific Automotive Parts Remanufacturing Market: Component, By Fuel Systems
- 25.7 Asia Pacific Automotive Parts Remanufacturing Market: Component, By Other Components
26. Asia Pacific Automotive Parts Remanufacturing Market, By Vehicle
- 26.1 Asia Pacific Automotive Parts Remanufacturing Market: Vehicle Overview
- 26.2 Asia Pacific Automotive Parts Remanufacturing Market: Vehicle, By Passenger Vehicles
- 26.3 Asia Pacific Automotive Parts Remanufacturing Market: Vehicle, By Light Commercial Vehicles
- 26.4 Asia Pacific Automotive Parts Remanufacturing Market: Vehicle, By Heavy Commercial Vehicles
- 26.5 Asia Pacific Automotive Parts Remanufacturing Market: Vehicle, By Off-Road Vehicles
- 26.6 Asia Pacific Automotive Parts Remanufacturing Market: Vehicle, By All-Terrain Vehicles
27. Asia Pacific Automotive Parts Remanufacturing Market, By Country
- 27.1 China
- 27.2 India
- 27.3 Japan
- 27.4 South Korea
- 27.5 Rest of Asia Pacific
28. Middle East & Africa Automotive Parts Remanufacturing Market Trends and Forecast Analysis, 2018-2028, USD MILLION & CAGR
- 28.1 Macro Economic Factor Impact Index
- 28.2 Impact analysis of market dynamics on Automotive Parts Remanufacturing Market
- 28.3 Middle East & Africa Automotive Parts Remanufacturing Market Size, By Value, 2018-2021(USD Million)
- 28.4 Middle East & Africa Automotive Parts Remanufacturing Market Size, By Value, 2022-2028 (USD Million)
29. Middle East & Africa Automotive Parts Remanufacturing Market, By Component
- 29.1 Middle East & Africa Automotive Parts Remanufacturing Market: Component Overview
- 29.2 Middle East & Africa Automotive Parts Remanufacturing Market: Component, By Engine & Related Parts
- 29.3 Middle East & Africa Automotive Parts Remanufacturing Market: Component, By Transmission & Others
- 29.4 Middle East & Africa Automotive Parts Remanufacturing Market: Component, By Electrical & Electronics
- 29.5 Middle East & Africa Automotive Parts Remanufacturing Market: Component, By Wheels & Brakes
- 29.6 Middle East & Africa Automotive Parts Remanufacturing Market: Component, By Fuel Systems
- 29.7 Middle East & Africa Automotive Parts Remanufacturing Market: Component, By Other Components
30. Middle East & Africa Automotive Parts Remanufacturing Market, By Vehicle
- 30.1 Middle East & Africa Automotive Parts Remanufacturing Market: Vehicle Overview
- 30.2 Middle East & Africa Automotive Parts Remanufacturing Market: Vehicle, By Passenger Vehicles
- 30.3 Middle East & Africa Automotive Parts Remanufacturing Market: Vehicle, By Light Commercial Vehicles
- 30.4 Middle East & Africa Automotive Parts Remanufacturing Market: Vehicle, By Heavy Commercial Vehicles
- 30.5 Middle East & Africa Automotive Parts Remanufacturing Market: Vehicle, By Off-Road Vehicles
- 30.6 Middle East & Africa Automotive Parts Remanufacturing Market: Vehicle, By All-Terrain Vehicles