|
|
市場調査レポート
商品コード
1167454
低軌道(LEO)衛星の世界市場 - 用途タイプ別、重量タイプ別、最終用途産業別、地域別、国別(2022年版):市場の洞察と予測(2023年~2028年)Global Low Earth Orbit (LEO) Satellite Market (2022 Edition) - Analysis by Application Type, Weight Type (Micro, Mini, <10 KG), End-Use Industry, By Region, By Country: Market Insights and Forecast (2023-2028) |
||||||
|
|
|||||||


| 低軌道(LEO)衛星の世界市場 - 用途タイプ別、重量タイプ別、最終用途産業別、地域別、国別(2022年版):市場の洞察と予測(2023年~2028年) |
|
出版日: 2022年11月30日
発行: Azoth Analytics
ページ情報: 英文 280 Pages
納期: 即納可能
|
- 全表示
- 概要
- 図表
- 目次
世界の低軌道衛星の市場規模は、2021年に50億1,000万米ドルとなり、予測期間中の2023年~2028年に25.45%のCAGRで著しく成長すると予測されています。
低軌道衛星の世界市場は、各国政府やSpaceX・Boeingなどの企業による衛星産業への投資増加によって牽引されています。また、新興国での人口拡大によるインターネット普及率の向上が、低軌道衛星の世界市場の成長を促進する見通しです。さらに、用途では、通信用低軌道衛星が大きなCAGRで成長すると期待され、ブロードバンドサービスや高データレート接続の需要増大が市場を押し上げるため、低軌道衛星市場全体で大きなシェアを占める見込みです。
当レポートでは、世界の低軌道衛星市場について調査分析し、市場概要、競合情勢、企業プロファイル、セグメント別・地域別の市場動向・予測、など体系的な情報を提供しています。
目次
第1章 イントロダクション
第2章 エグゼクティブサマリー
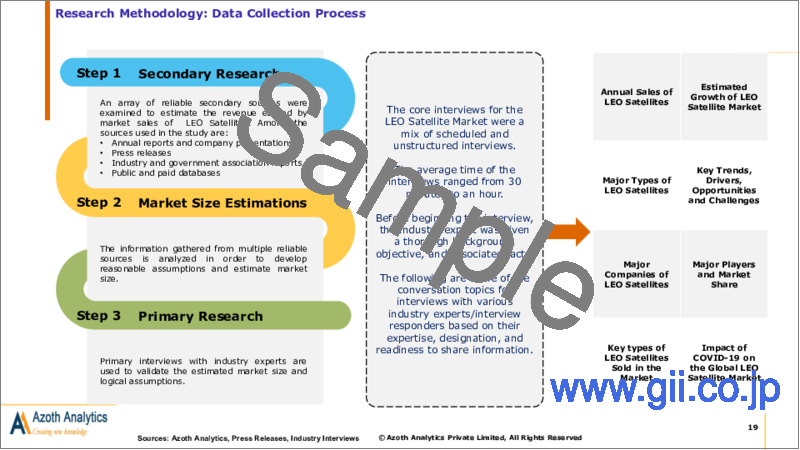
第3章 調査手法
第4章 市場力学
- 促進要因
- 抑制要因
- 機会
- 動向
- 市場力学の影響評価
第5章 バリューチェーン
- 原材料サプライヤー
- メーカー
- ディストリビューター
- 最終用途産業
第6章 COVID-19の影響評価
- 世界の低軌道衛星市場に与えるCOVID-19の影響度の評価
- 四半期毎のCOVID-19影響分析:地域別
第7章 ポーターのファイブフォース分析
第8章 マクロ経済指標の見通し
- 世界の情報技術部門への投資
- 製造業部門
- 宇宙産業への政府投資
- 宇宙に打ち上げられたオブジェクト総数
- 政府の軍事投資
第9章 平均販売価格分析
- 平均販売価格:地域別
- 平均販売価格:用途タイプ別
第10章 競合ポジショニング
- 企業の製品ポジショニング
- 市場ポジションマトリクス
- 市場シェア分析
- Northrop Grumman
- Kepler Communications
- SpaceX
- Boeing
- Lockheed Martin
- Thales
- Airbus SE
- L3Harris Technologies
- Honeywell
- OneWeb
第11章 容量分析(2018年~2028年)、単位
- 量別
- 2018年~2028年、単位
- 用途別(2018年~2028年)、単位
- 用途別(2018年~2021年、2023年~2028年)、CAGR
- 南北アメリカ:量別
- 2018年~2028年、単位
- 用途別(2018年~2028年)、単位
- 用途別(2018年~2021年、2023年~2028年)、CAGR
- 欧州:量別
- 2018年~2028年、単位
- 用途別(2018年~2028年)、単位
- 用途別(2018年~2021年、2023年~2028年)、CAGR
- アジア太平洋:量別
- 2018年~2028年、単位
- 用途別(2018年~2028年)、単位
- 用途別(2018年~2021年、2023年~2028年)、CAGR
- 中東・アフリカ:量別
- 2018年~2028年、単位
- 用途別(2018年~2028年)、単位
- 用途別(2018年~2021年、2023年~2028年)、CAGR
第12章 世界の低軌道衛星市場の動向と予測分析(2018年~2028年):10億米ドル、CAGR
- マクロ経済要因影響指数
- ダッシュボード
- 市場規模:金額別(2018年~2021年)
- 市場規模:金額別(2022年~2028年)
- 概要
第13章 世界の低軌道衛星市場の動向と予測分析(2018年~2028年):用途タイプ別
- 用途タイプ別:スナップショット
- 通信
- 宇宙探査
- 地球観測・リモートセンシング
- その他用途
第14章 世界の低軌道衛星市場の動向と予測分析(2018年~2028年):重量タイプ別
- 重量タイプ別:スナップショット
- マイクロ(10~100Kg)
- ミニ(100~500kg)
- 10kg未満
第15章 世界の低軌道衛星市場の動向と予測分析(2018年~2028年):最終用途産業タイプ別
- 最終用途産業タイプ別:スナップショット
- 住宅
- 商業
- 政府・軍事
第16章 世界の低軌道衛星市場の動向と予測分析(2018年~2028年):地域別
- 調査対象地域
第17章 南北アメリカの低軌道衛星市場の動向と予測分析(2018年~2028年):10億米ドル、CAGR
- マクロ経済要因影響指数
- 市場力学の影響分析
- ダッシュボード
- 市場規模:金額別(2018年~2021年)
- 市場規模:金額別(2022年~2028年)
第18章 南北アメリカの低軌道衛星市場:用途タイプ別
第19章 南北アメリカの低軌道衛星市場:重量タイプ別
第20章 南北アメリカの低軌道衛星市場:最終用途産業タイプ別
第21章 南北アメリカの低軌道衛星市場:国別
第22章 欧州の低軌道衛星市場の動向と予測分析(2018年~2028年):10億米ドル、CAGR
第23章 欧州の低軌道衛星市場:用途タイプ別
第24章 欧州の低軌道衛星市場:重量タイプ別
第25章 欧州の低軌道衛星市場:最終用途産業タイプ別
第26章 欧州の低軌道衛星市場:国別
第27章 アジア太平洋の低軌道衛星市場の動向と予測分析(2018年~2028年):10億米ドル、CAGR
第28章 アジア太平洋の低軌道衛星市場:用途タイプ別
第29章 アジア太平洋の低軌道衛星市場:重量タイプ別
第30章 アジア太平洋の低軌道衛星市場:最終用途産業タイプ別
第31章 アジア太平洋の低軌道衛星市場:国別
第32章 中東・アフリカの低軌道衛星市場の動向と予測分析(2018年~2028年):10億米ドル、CAGR
第33章 中東・アフリカの低軌道衛星市場:用途タイプ別
第34章 中東・アフリカの低軌道衛星市場:重量タイプ別
第35章 中東・アフリカの低軌道衛星市場:最終用途産業タイプ別
List of Figures
List of Figures
- Figure 1: LEO Satellite Market for next 7 years (in USD Billions)
- Figure 2: LEO Satellite Market Size, By Price Type, 2018 & 2028 (USD Billion)
- Figure 3: LEO Satellite Market Size, By Capacity Type, 2021 (%)
- Figure 4: Average LEO Satellite Price, By Region, 2021 (USD Mn/LEO Satellite)
- Figure 5: Average Leo Satellite Price, By Application Type, 2021 (USD Mn/LEO Satellite)
- Figure 6: Market Share of Prominent Companies of LEO Satellite, 2021 (%)
- Figure 7: Northrop Grumman Revenues, 2019-2021 (USD Billion)
- Figure 8: Northrop Grumman Group Revenue, By Business Segments, 2021 (%)
- Figure 9: Northrop Grumman Group Revenue, By Geographical Segments, 2021 (%)
- Figure 10: Boeing International Revenues, 2019-2021 (USD Billion)
- Figure 11: Boeing Int. Revenue, By Business Segments, 2021 (%)
- Figure 12: Boeing Int. Revenue, By Geographical Segments, 2021 (%)
- Figure 13: Lockheed Martin Revenues, 2018-2020 (USD Billion)
- Figure 14: Lockheed Martin Revenue, By Business Segments, 2021 (%)
- Figure 15: Lockheed Martin Revenue, By Geographical Segments, 2021 (%)
- Figure 16: Thales Revenues, 2019-2021 (USD Billion)
- Figure 17: Thales Revenue, By Business Segments, 2021 (%)
- Figure 18: Thales Revenue, By Geographical Segments, 2021 (%)
- Figure 19: Airbus Revenues, 2019-2021 (USD Billion)
- Figure 20: Airbus Revenue, By Business Segments, 2021 (%)
- Figure 21: Airbus Revenue, By Geographical Segments, 2021 (%)
- Figure 22: L3Harris Tech Group Revenues, 2019-2021 (USD Billion)
- Figure 23: L3Harris Tech Revenue , By Business Segments, 2021(%)
- Figure 24: L3Harris Tech Revenue, By Geographical Segment, 2021 (%)
- Figure 25: Honeywell Revenues, 2019-2021 (USD Billion)
- Figure 26: Honeywell Revenue, By Business Segments, 2021 (%)
- Figure 27: Honeywell Revenue, By Geographical Segments, 2021 (%)
- Figure 28: Global Low Earth Orbit Satellite Market Size, By Volume, 2018-2028 (Units)
- Figure 29: Global Low Earth Orbit Satellite Market Size, By Application Type, By Volume, 2018-2028 (Units)
- Figure 30: Global Low Earth Orbit Satellite Market CAGR (%), By Volume, 2018-2021,2023-2028
- Figure 31: Americas Low Earth Orbit Satellite Market Size, By Volume, 2018-2028 (Units)
- Figure 32: Americas Low Earth Orbit Satellite Market Size, By Application Type, By Volume, 2018-2028 (Units)
- Figure 33: Americas Low Earth Orbit Satellite Market CAGR (%), By Volume, 2018-2021,2023-2028
- Figure 34: Europe Low Earth Orbit Satellite Market Size, By Volume, 2018-2028 (Units)
- Figure 35: Europe Low Earth Orbit Satellite Market Size, By Application Type, By Volume, 2018-2028 (Units)
- Figure 36: Europe Low Earth Orbit Satellite Market CAGR (%), By Volume, 2018-2021,2023-2028
- Figure 37: Asia Pacific Low Earth Orbit Satellite Market Size, By Volume, 2018-2028 (Units)
- Figure 38: Asia Pacific Low Earth Orbit Satellite Market Size, By Application Type, By Volume, 2018-2028 (Units)
- Figure 39: Asia Pacific Low Earth Orbit Satellite Market CAGR (%), By Volume, 2018-2021,2023-2028
- Figure 40: Middle East and Africa Low Earth Orbit Satellite Market Size, By Volume, 2018-2028 (Units)
- Figure 41: Middle East and Africa Low Earth Orbit Satellite Market Size, By Application Type, By Volume, 2018-2028 (Units)
- Figure 42: Middle East and Africa Low Earth Orbit Satellite Market CAGR (%), By Volume, 2018-2021,2023-2028
- Figure 43: At a CAGR of 25.45% during 2023-2028, the global market value is expected to reach USD 23.82 Billion in 2028
- Figure 44: Volume sales of LEO Satellite is expected to sustain a staggering sales of 29451 units in 2028
- Figure 45: Basis Point Analysis of Low Earth Orbit Satellite Market, By Region (2022,2028)
- Figure 46: Market Opportunity Analysis of Low Earth Orbit Satellite Market, By Region (2023-2028)
- Figure 47: Global Low Earth Orbit Satellite Market Size, By Value, 2018-2021(USD Billion)
- Figure 48: Global Low Earth Orbit Satellite Market Size, By Value, 2022-2028 (USD Billion)
- Figure 49: Global Low Earth Orbit Satellite Market Share, By Application, 2021 (%)
- Figure 50: Global Low Earth Orbit Satellite Market CAGR, By Application Type, By Value, 2018-2021, 2023-2028 (%)
- Figure 51: Basis Point Analysis of Global Low Earth Orbit Satellite Market, By Application Type (2022,2028)
- Figure 52: Market Opportunity Analysis of Global Low Earth Orbit Satellite Market, By Application Type (2023-2028)
- Figure 53: Global Low Earth Orbit Satellite Market Size, By Communications, By Value, 2018-2021 (USD Billion)
- Figure 54: Global Low Earth Orbit Satellite Market Size, By Communications, By Value, 2022-2028 (USD Billion)
- Figure 55: Global Communications LEO Satellite Market Absolute Opportunity, 2018-2028 (USD Billion)
- Figure 56: Global Low Earth Orbit Satellite Market Size, By Space Exploration, By Value, 2018-2021 (USD Billion)
- Figure 57: Low Earth Orbit Satellite Market Size, By Space Exploration, By Value, 2022-2028 (USD Billion)
- Figure 58: Global Space Exploration LEO Satellite Absolute Opportunity, 2018-2028 (USD Billion)
- Figure 59: Global Low Earth Orbit Satellite Market Size, By Earth Observation & Remote Sensing, By Value, 2018-2021 (USD Billion)
- Figure 60: Global Low Earth Orbit Satellite Market Size, By Earth Observation & Remote Sensing, By Value, 2022-2028 (USD Billion)
- Figure 61: Global Earth Observation & Remote Sensing LEO Satellite Absolute Opportunity, 2018-2028 (USD Billion)
- Figure 62: Global Low Earth Orbit Satellite Market Size, By Other Applications, By Value, 2018-2021 (USD Billion)
- Figure 63: Global Low Earth Orbit Satellite Market Size, By Other Applications, By Value, 2022-2028 (USD Billion)
- Figure 64: Global Other Applications LEO Satellite Absolute Opportunity, 2018-2028 (USD Billion)
- Figure 65: Global Low Earth Orbit Satellite Market CAGR, By Weight Type, By Value, 2018-2021, 2023-2028 (%)
- Figure 66: Basis Point Analysis of Global Low Earth Orbit Satellite Market, By Weight Type (2022,2028)
- Figure 67: Market Opportunity Analysis of Global Low Earth Orbit Satellite Market, By Weight Type(2023-2028)
- Figure 68: Global Low Earth Orbit Satellite Market Size, By Micro (10-100 KG), By Value, 2018-2021 (USD Billion)
- Figure 69: Global Low Earth Orbit Satellite Market Size, By Micro (10-100 KG), By Value, 2022-2028 (USD Billion)
- Figure 70: Global Low Earth Orbit Satellite Market, By Micro (10-100 KG), Absolute Opportunity, By Value, 2018-2028 (USD Billion)
- Figure 71: Global Low Earth Orbit Satellite Market Size, By Mini (100-500 KG), By Value, 2018-2021 (USD Billion)
- Figure 72: Global Low Earth Orbit Satellite Market Size, By Mini (100-500 KG), By Value, 2022-2028 (USD Billion)
- Figure 73: Global Low Earth Orbit Satellite Market, By Mini (100-500 KG), Absolute Opportunity, By Value, 2018-2028 (USD Billion)
- Figure 74: Global Low Earth Orbit Satellite Market Size, By Below 10 KG, By Value, 2018-2021 (USD Billion)
- Figure 75: Global Low Earth Orbit Satellite Market Size, By Below 10 KG, By Value, 2022-2028 (USD Billion)
- Figure 76: Global Low Earth Orbit Satellite Market, By Below 10 KG, Absolute Opportunity, By Value, 2018-2028 (USD Billion)
- Figure 77: Global Low Earth Orbit Satellite Market CAGR, By End User, By Value, 2018-2021, 2023-2028 (%)
- Figure 78: Basis Point Analysis of Global Low Earth Orbit Satellite Market, By End User (2022,2028)
- Figure 79: Market Opportunity Analysis of Global Low Earth Orbit Satellite Market, By End User (2023-2028)
- Figure 80: Global Low Earth Orbit Satellite Market Size, By Residential, By Value, 2018-2021 (USD Billion)
- Figure 81: Global Low Earth Orbit Satellite Market Size, By Residential, By Value, 2022-2028 (USD Billion)
- Figure 82: Global Low Earth Orbit Satellite Market, By Residential, Absolute Opportunity, By Value, 2018-2028 (USD Billion)
- Figure 83: Global Low Earth Orbit Satellite Market Size, By Commercial, By Value, 2018-2021 (USD Billion)
- Figure 84: Global Low Earth Orbit Satellite Market Size, By Commercial, By Value, 2022-2028 (USD Billion)
- Figure 85: Global Low Earth Orbit Satellite Market, By Commercial, Absolute Opportunity, By Value, 2018-2028 (USD Billion)
- Figure 86: Global Low Earth Orbit Satellite Market Size, By Govt. & Military, By Value, 2018-2021 (USD Billion)
- Figure 87: Global Low Earth Orbit Satellite Market Size, By Govt. & Military, By Value, 2022-2028 (USD Billion)
- Figure 88: Global Low Earth Orbit Satellite Market, By Govt. & Military, Absolute Opportunity, By Value, 2018-2028 (USD Billion)
- Figure 89: Market Value of the Americas is expected to grow from USD 1.83 Bn to USD 8.55 Bn in 2028
- Figure 90: Americas LEO Satellite Market is expected to foresee an absolute opportunity of 15884 Units during 2018-2028
- Figure 91: Market Value by Application Type
- Figure 92: Market Value by Weight Type
- Figure 93: Top 3 Countries of LEO Satellite Market in Americas
- Figure 94: Basis Point Analysis of Americas LEO Satellite Market, By Country (2022,2028)
- Figure 95: Market Opportunity Analysis of Americas LEO Satellite Market, By Country (2023-2028)
- Figure 96: Americas Low Earth Orbit Satellite Market Size, By Value, 2018-2021(USD Billion)
- Figure 97: Americas Low Earth Orbit Satellite Market Size, By Value, 2022-2028 (USD Billion)
- Figure 98: Americas Low Earth Orbit Satellite Market Share, By Application, 2021 (%)
- Figure 99: Americas Low Earth Orbit Satellite Market CAGR, By Application Type, By Value, 2018-2021, 2023-2028 (%)
- Figure 100: Basis Point Analysis of Americas Low Earth Orbit Satellite Market, By Application Type (2022,2028)
- Figure 101: Americas Market Opportunity Analysis of Low Earth Orbit Satellite Market, By Application Type (2023-2028)
- Figure 102: Americas Low Earth Orbit Satellite Market Size, By Communications, By Value, 2018-2021 (USD Billion)
- Figure 103: Americas Low Earth Orbit Satellite Market Size, By Communications, By Value, 2022-2028 (USD Billion)
- Figure 104: Americas Communications LEO Satellite Market Absolute Opportunity, 2018-2028 (USD Billion)
- Figure 105: Americas Low Earth Orbit Satellite Market Size, By Space Exploration, By Value, 2018-2021 (USD Billion)
- Figure 106: Americas Low Earth Orbit Satellite Market Size, By Space Exploration, By Value, 2022-2028 (USD Billion)
- Figure 107: Americas Space Exploration LEO Satellite Absolute Opportunity, 2018-2028 (USD Billion)
- Figure 108: Americas Low Earth Orbit Satellite Market Size, By Earth Observation & Remote Sensing, By Value, 2018-2021 (USD Billion)
- Figure 109: Americas Low Earth Orbit Satellite Market Size, By Earth Observation & Remote Sensing, By Value, 2022-2028 (USD Billion)
- Figure 110: Americas Earth Observation & Remote Sensing Footprint in Global Market, 2021 (% of Global Market)
- Figure 111: Americas Low Earth Orbit Satellite Market Size, By Other Applications, By Value, 2018-2021 (USD Billion)
- Figure 112: Americas Low Earth Orbit Satellite Market Size, By Other Applications, By Value, 2022-2028 (USD Billion)
- Figure 113: Americas Other Applications Footprint in Global Market, 2021 (% of Global Market)
- Figure 114: Americas Low Earth Orbit Satellite Market CAGR, By Weight Type, By Value, 2018-2021, 2023-2028 (%)
- Figure 115: Americas Basis Point Analysis of Low Earth Orbit Satellite Market, By Weight Type (2022,2028)
- Figure 116: Americas Market Opportunity Analysis of Low Earth Orbit Satellite Market, By Weight Type(2023-2028)
- Figure 117: Americas Low Earth Orbit Satellite Market Size, By Micro (10-100 KG), By Value, 2018-2021 (USD Billion)
- Figure 118: Americas Low Earth Orbit Satellite Market Size, By Micro (10-100 KG), By Value, 2022-2028 (USD Billion)
- Figure 119: Americas Low Earth Orbit Satellite Market, By Micro (10-100 KG), Absolute Opportunity, By Value, 2018-2028 (USD Billion)
- Figure 120: Americas Low Earth Orbit Satellite Market Size, By Mini (100-500 KG), By Value, 2018-2021 (USD Billion)
- Figure 121: Americas Low Earth Orbit Satellite Market Size, By Mini (100-500 KG), By Value, 2022-2028 (USD Billion)
- Figure 122: Americas Mini(100-500 KG) Footprint in Global Market, 2021 (% of Global Market)
- Figure 123: Americas LEO Satellite Market Size, By Below 10 KG, By Value, 2018-2021 (USD Billion)
- Figure 124: Americas LEO Satellite Market Size, By Below 10 KG, By Value, 2022-2028 (USD Billion)
- Figure 125: Americas Below 10 KG Footprint in Global Market, 2021 (% of Global Market)
- Figure 126: Americas Low Earth Orbit Satellite Market CAGR, By End User, By Value, 2018-2021, 2023-2028 (%)
- Figure 127: Basis Point Analysis of Americas Low Earth Orbit Satellite Market, By End User (2022,2028)
- Figure 128: Americas Market Opportunity Analysis of Americas Low Earth Orbit Satellite Market, By End User (2023-2028)
- Figure 129: Americas Low Earth Orbit Satellite Market Size, By Residential, By Value, 2018-2021 (USD Billion)
- Figure 130: Americas Low Earth Orbit Satellite Market Size, By Residential, By Value, 2022-2028 (USD Billion)
- Figure 131: Americas Low Earth Orbit Satellite Market, By Residential, Absolute Opportunity, By Value, 2018-2028 (USD Billion)
- Figure 132: Americas Low Earth Orbit Satellite Market Size, By Commercial, By Value, 2018-2021 (USD Billion)
- Figure 133: Americas Low Earth Orbit Satellite Market Size, By Commercial, By Value, 2022-2028 (USD Billion)
- Figure 134: Americas Low Earth Orbit Satellite Market, By Commercial, Absolute Opportunity, By Value, 2018-2028 (USD Billion)
- Figure 135: Americas Low Earth Orbit Satellite Market Size, By Govt. & Military, By Value, 2018-2021 (USD Billion)
- Figure 136: Americas Low Earth Orbit Satellite Market Size, By Govt. & Military, By Value, 2022-2028 (USD Billion)
- Figure 137: Americas Government & Military Footprint in Global Market, 2021 (% of Global Market)
- Figure 138: United States LEO Satellite Market, By Value, 2018-2028 (USD Billion)
- Figure 139: United States LEO Satellite Market, CAGR, By Value, 2018-2021, 2023-2028 (%)
- Figure 140: United States LEO Satellite Market Value, By Application Type, 2021 (USD Billion)
- Figure 141: United States LEO Satellite Market Share, By Application Type, By Value, 2021 (%)
- Figure 142: United States LEO Satellite Market Share, By Weight Type, By Value, 2021 (%)
- Figure 143: United States LEO Satellite Market Share, By End User Type, By Value, 2021 (%)
- Figure 144: Canada LEO Satellite Market, By Value, 2018-2028 (USD Billion)
- Figure 145: Canada LEO Satellite Market, CAGR, By Value, 2018-2021, 2023-2028 (%)
- Figure 146: Canada LEO Satellite Market Value, By Application Type, 2021 (USD Billion)
- Figure 147: Canada LEO Satellite Market Share, By Application Type, By Value, 2021 (%)
- Figure 148: Canada LEO Satellite Market Share, By Weight Type, By Value, 2021 (%)
- Figure 149: Canada LEO Satellite Market Share, By End User Type, By Value, 2021 (%)
- Figure 150: Rest of Americas LEO Satellite Market, By Value, 2018-2028 (USD Billion)
- Figure 151: Rest of Americas LEO Satellite Market, CAGR, By Value, 2018-2021, 2023-2028 (%)
- Figure 152: Rest of Americas LEO Satellite Market Value, By Application Type, 2021 (USD Billion)
- Figure 153: Rest of Americas LEO Satellite Market Share, By Application Type, By Value, 2021 (%)
- Figure 154: Rest of Americas LEO Satellite Market Share, By Weight Type, By Value, 2021 (%)
- Figure 155: Rest of Americas LEO Satellite Market Share, By End User Type, By Value, 2021 (%)
- Figure 156: Market Value of the Europe is expected to grow from USD 1.24 Bn to USD 5.64 Bn in 2028
- Figure 157: Europe LEO Satellite Market is expected to foresee an absolute opportunity of 4805 Units during 2018-2028
- Figure 158: Market Value by Application Type
- Figure 159: Market Value by Weight Type
- Figure 160: Top 3 Countries of LEO Satellite Market in Europe
- Figure 161: Basis Point Analysis of Europe LEO Satellite Market, By Country (2022,2028)
- Figure 162: Market Opportunity Analysis of Europe LEO Satellite Market, By Country (2023-2028)
- Figure 163: Europe Low Earth Orbit Satellite Market Size, By Value, 2018-2021(USD Billion)
- Figure 164: Europe Low Earth Orbit Satellite Market Size, By Value, 2022-2028 (USD Billion)
- Figure 165: Europe Low Earth Orbit Satellite Market Share, By Application, 2021 (%)
- Figure 166: Europe Low Earth Orbit Satellite Market CAGR, By Application Type, By Value, 2018-2021, 2023-2028 (%)
- Figure 167: Basis Point Analysis of Europe Low Earth Orbit Satellite Market, By Application Type (2022,2028)
- Figure 168: Europe Market Opportunity Analysis of Low Earth Orbit Satellite Market, By Application Type (2023-2028)
- Figure 169: Europe Low Earth Orbit Satellite Market Size, By Communications, By Value, 2018-2021 (USD Billion)
- Figure 170: Europe Low Earth Orbit Satellite Market Size, By Communications, By Value, 2022-2028 (USD Billion)
- Figure 171: Europe Communications LEO Satellite Market Absolute Opportunity, 2018-2028 (USD Billion)
- Figure 172: Europe Low Earth Orbit Satellite Market Size, By Space Exploration, By Value, 2018-2021 (USD Billion)
- Figure 173: Europe Low Earth Orbit Satellite Market Size, By Space Exploration, By Value, 2022-2028 (USD Billion)
- Figure 174: Europe Space Exploration LEO Satellite Absolute Opportunity, 2018-2028 (USD Billion)
- Figure 175: Europe Low Earth Orbit Satellite Market Size, By Earth Observation & Remote Sensing, By Value, 2018-2021 (USD Billion)
- Figure 176: Europe Low Earth Orbit Satellite Market Size, By Earth Observation & Remote Sensing, By Value, 2022-2028 (USD Billion)
- Figure 177: Europe Earth Observation & Remote Sensing Footprint in Global Market, 2021 (% of Global Market)
- Figure 178: Europe Low Earth Orbit Satellite Market Size, By Other Applications, By Value, 2018-2021 (USD Billion)
- Figure 179: Europe Low Earth Orbit Satellite Market Size, By Other Applications, By Value, 2022-2028 (USD Billion)
- Figure 180: Europe Other Applications Footprint in Global Market, 2021 (% of Global Market)
- Figure 181: Europe Low Earth Orbit Satellite Market CAGR, By Weight Type, By Value, 2018-2021, 2023-2028 (%)
- Figure 182: Europe Basis Point Analysis of Low Earth Orbit Satellite Market, By Weight Type (2022,2028)
- Figure 183: Europe Market Opportunity Analysis of Low Earth Orbit Satellite Market, By Weight Type(2023-2028)
- Figure 184: Europe Low Earth Orbit Satellite Market Size, By Micro (10-100 KG), By Value, 2018-2021 (USD Billion)
- Figure 185: Europe Low Earth Orbit Satellite Market Size, By Micro (10-100 KG), By Value, 2022-2028 (USD Billion)
- Figure 186: Europe Low Earth Orbit Satellite Market, By Micro (10-100 KG), Absolute Opportunity, By Value, 2018-2028 (USD Billion)
- Figure 187: Europe Low Earth Orbit Satellite Market Size, By Mini (100-500 KG), By Value, 2018-2021 (USD Billion)
- Figure 188: Europe Low Earth Orbit Satellite Market Size, By Mini (100-500 KG), By Value, 2022-2028 (USD Billion)
- Figure 189: Europe Mini(100-500 KG) Footprint in Global Market, 2021 (% of Global Market)
- Figure 190: Europe LEO Satellite Market Size, By Below 10 KG, By Value, 2018-2021 (USD Billion)
- Figure 191: Europe LEO Satellite Market Size, By Below 10 KG, By Value, 2022-2028 (USD Billion)
- Figure 192: Europe Below 10 KG Footprint in Global Market, 2021 (% of Global Market)
- Figure 193: Europe Low Earth Orbit Satellite Market CAGR, By End User, By Value, 2018-2021, 2023-2028 (%)
- Figure 194: Basis Point Analysis of Europe Low Earth Orbit Satellite Market, By End User (2022,2028)
- Figure 195: Europe Market Opportunity Analysis of Americas Low Earth Orbit Satellite Market, By End User (2023-2028)
- Figure 196: Europe Low Earth Orbit Satellite Market Size, By Residential, By Value, 2018-2021 (USD Billion)
- Figure 197: Europe Low Earth Orbit Satellite Market Size, By Residential, By Value, 2022-2028 (USD Billion)
- Figure 198: Europe Low Earth Orbit Satellite Market, By Residential, Absolute Opportunity, By Value, 2018-2028 (USD Billion)
- Figure 199: Europe Low Earth Orbit Satellite Market Size, By Commercial, By Value, 2018-2021 (USD Billion)
- Figure 200: Europe Low Earth Orbit Satellite Market Size, By Commercial, By Value, 2022-2028 (USD Billion)
- Figure 201: Europe Low Earth Orbit Satellite Market, By Commercial, Absolute Opportunity, By Value, 2018-2028 (USD Billion)
- Figure 202: Europe Low Earth Orbit Satellite Market Size, By Govt. & Military, By Value, 2018-2021 (USD Billion)
- Figure 203: Europe Low Earth Orbit Satellite Market Size, By Govt. & Military, By Value, 2022-2028 (USD Billion)
- Figure 204: Europe Government & Military Footprint in Global Market, 2021 (% of Global Market)
- Figure 205: Germany LEO Satellite Market, By Value, 2018-2028 (USD Billion)
- Figure 206: Germany LEO Satellite Market, CAGR, By Value, 2018-2021, 2023-2028 (%)
- Figure 207: Germany LEO Satellite Market Value, By Application Type, 2021 (USD Billion)
- Figure 208: Germany LEO Satellite Market Share, By Application Type, By Value, 2021 (%)
- Figure 209: Germany LEO Satellite Market Share, By Weight Type, By Value, 2021 (%)
- Figure 210: Germany LEO Satellite Market Share, By End User Type, By Value, 2021 (%)
- Figure 211: United kingdom LEO Satellite Market, By Value, 2018-2028 (USD Billion)
- Figure 212: United kingdom LEO Satellite Market, CAGR, By Value, 2018-2021, 2023-2028 (%)
- Figure 213: United kingdom LEO Satellite Market Value, By Application Type, 2021 (USD Billion)
- Figure 214: United kingdom LEO Satellite Market Share, By Application Type, By Value, 2021 (%)
- Figure 215: United kingdom LEO Satellite Market Share, By Weight Type, By Value, 2021 (%)
- Figure 216: United kingdom LEO Satellite Market Share, By End User Type, By Value, 2021 (%)
- Figure 217: France LEO Satellite Market, By Value, 2018-2028 (USD Billion)
- Figure 218: France LEO Satellite Market, CAGR, By Value, 2018-2021, 2023-2028 (%)
- Figure 219: France LEO Satellite Market Value, By Application Type, 2021 (USD Billion)
- Figure 220: France LEO Satellite Market Share, By Application Type, By Value, 2021 (%)
- Figure 221: France LEO Satellite Market Share, By Weight Type, By Value, 2021 (%)
- Figure 222: France LEO Satellite Market Share, By End User Type, By Value, 2021 (%)
- Figure 223: Russia LEO Satellite Market, By Value, 2018-2028 (USD Billion)
- Figure 224: Russia LEO Satellite Market, CAGR, By Value, 2018-2021, 2023-2028 (%)
- Figure 225: Russia LEO Satellite Market Value, By Application Type, 2021 (USD Billion)
- Figure 226: Russia LEO Satellite Market Share, By Application Type, By Value, 2021 (%)
- Figure 227: Russia LEO Satellite Market Share, By Weight Type, By Value, 2021 (%)
- Figure 228: Russia LEO Satellite Market Share, By End User Type, By Value, 2021 (%)
- Figure 229: Rest of Europe LEO Satellite Market, By Value, 2018-2028 (USD Billion)
- Figure 230: Rest of Europe LEO Satellite Market, CAGR, By Value, 2018-2021, 2023-2028 (%)
- Figure 231: Rest of Europe LEO Satellite Market Value, By Application Type, 2021 (USD Billion)
- Figure 232: Rest of Europe LEO Satellite Market Share, By Application Type, By Value, 2021 (%)
- Figure 233: Rest of Europe LEO Satellite Market Share, By Weight Type, By Value, 2021 (%)
- Figure 234: Rest of Europe LEO Satellite Market Share, By End User Type, By Value, 2021 (%)
- Figure 235: Market Value of the Asia Pacific is expected to grow from USD 1.20 Bn to USD 6.53 Bn in 2028
- Figure 236: Asia Pacific LEO Satellite Market is expected to foresee an absolute opportunity of 6135 Units during 2018-2028
- Figure 237: Market Value by Application Type
- Figure 238: Market Value by Weight Type
- Figure 239: Top 3 Countries of LEO Satellite Market in Asia Pacific
- Figure 240: Basis Point Analysis of Asia Pacific LEO Satellite Market, By Country (2022,2028)
- Figure 241: Market Opportunity Analysis of Asia Pacific LEO Satellite Market, By Country (2023-2028)
- Figure 242: Asia Pacific Low Earth Orbit Satellite Market Size, By Value, 2018-2021(USD Billion)
- Figure 243: Asia Pacific Low Earth Orbit Satellite Market Size, By Value, 2022-2028 (USD Billion)
- Figure 244: Asia Pacific Low Earth Orbit Satellite Market Share, By Application, 2021 (%)
- Figure 245: Asia Pacific Low Earth Orbit Satellite Market CAGR, By Application Type, By Value, 2018-2021, 2023-2028 (%)
- Figure 246: Basis Point Analysis of Asia Pacific Low Earth Orbit Satellite Market, By Application Type (2022,2028)
- Figure 247: Asia Pacific Market Opportunity Analysis of Low Earth Orbit Satellite Market, By Application Type (2023-2028)
- Figure 248: Asia Pacific Low Earth Orbit Satellite Market Size, By Communications, By Value, 2018-2021 (USD Billion)
- Figure 249: Asia Pacific Low Earth Orbit Satellite Market Size, By Communications, By Value, 2022-2028 (USD Billion)
- Figure 250: Asia Pacific Communications LEO Satellite Market Absolute Opportunity, 2018-2028 (USD Billion)
- Figure 251: Asia Pacific Low Earth Orbit Satellite Market Size, By Space Exploration, By Value, 2018-2021 (USD Billion)
- Figure 252: Asia Pacific Low Earth Orbit Satellite Market Size, By Space Exploration, By Value, 2022-2028 (USD Billion)
- Figure 253: Asia Pacific Space Exploration LEO Satellite Absolute Opportunity, 2018-2028 (USD Billion)
- Figure 254: Asia Pacific Low Earth Orbit Satellite Market Size, By Earth Observation & Remote Sensing, By Value, 2018-2021 (USD Billion)
- Figure 255: Asia Pacific Low Earth Orbit Satellite Market Size, By Earth Observation & Remote Sensing, By Value, 2022-2028 (USD Billion)
- Figure 256: Asia Pacific Earth Observation & Remote Sensing Footprint in Global Market, 2021 (% of Global Market)
- Figure 257: Asia Pacific Low Earth Orbit Satellite Market Size, By Other Applications, By Value, 2018-2021 (USD Billion)
- Figure 258: Asia Pacific Low Earth Orbit Satellite Market Size, By Other Applications, By Value, 2022-2028 (USD Billion)
- Figure 259: Asia Pacific Other Applications Footprint in Global Market, 2021 (% of Global Market)
- Figure 260: Asia Pacific Low Earth Orbit Satellite Market CAGR, By Weight Type, By Value, 2018-2021, 2023-2028 (%)
- Figure 261: Asia Pacific Basis Point Analysis of Low Earth Orbit Satellite Market, By Weight Type (2022,2028)
- Figure 262: Asia Pacific Market Opportunity Analysis of Low Earth Orbit Satellite Market, By Weight Type(2023-2028)
- Figure 263: Asia Pacific Low Earth Orbit Satellite Market Size, By Micro (10-100 KG), By Value, 2018-2021 (USD Billion)
- Figure 264: Asia Pacific Low Earth Orbit Satellite Market Size, By Micro (10-100 KG), By Value, 2022-2028 (USD Billion)
- Figure 265: Asia Pacific Low Earth Orbit Satellite Market, By Micro (10-100 KG), Absolute Opportunity, By Value, 2018-2028 (USD Billion)
- Figure 266: Asia Pacific Low Earth Orbit Satellite Market Size, By Mini (100-500 KG), By Value, 2018-2021 (USD Billion)
- Figure 267: Asia Pacific Low Earth Orbit Satellite Market Size, By Mini (100-500 KG), By Value, 2022-2028 (USD Billion)
- Figure 268: Asia Pacific Mini(100-500 KG) Footprint in Global Market, 2021 (% of Global Market)
- Figure 269: Asia Pacific LEO Satellite Market Size, By Below 10 KG, By Value, 2018-2021 (USD Billion)
- Figure 270: Asia Pacific LEO Satellite Market Size, By Below 10 KG, By Value, 2022-2028 (USD Billion)
- Figure 271: Asia Pacific Below 10 KG Footprint in Global Market, 2021 (% of Global Market)
- Figure 272: Asia Pacific Low Earth Orbit Satellite Market CAGR, By End User, By Value, 2018-2021, 2023-2028 (%)
- Figure 273: Basis Point Analysis of Asia Pacific Low Earth Orbit Satellite Market, By End User (2022,2028)
- Figure 274: Asia Pacific Market Opportunity Analysis of Americas Low Earth Orbit Satellite Market, By End User (2023-2028)
- Figure 275: Asia Pacific Low Earth Orbit Satellite Market Size, By Residential, By Value, 2018-2021 (USD Billion)
- Figure 276: Asia Pacific Low Earth Orbit Satellite Market Size, By Residential, By Value, 2022-2028 (USD Billion)
- Figure 277: Asia Pacific Low Earth Orbit Satellite Market, By Residential, Absolute Opportunity, By Value, 2018-2028 (USD Billion)
- Figure 278: Asia Pacific Low Earth Orbit Satellite Market Size, By Commercial, By Value, 2018-2021 (USD Billion)
- Figure 279: Asia Pacific Low Earth Orbit Satellite Market Size, By Commercial, By Value, 2022-2028 (USD Billion)
- Figure 280: Asia Pacific Low Earth Orbit Satellite Market, By Commercial, Absolute Opportunity, By Value, 2018-2028 (USD Billion)
- Figure 281: Asia Pacific Low Earth Orbit Satellite Market Size, By Govt. & Military, By Value, 2018-2021 (USD Billion)
- Figure 282: Asia Pacific Low Earth Orbit Satellite Market Size, By Govt. & Military, By Value, 2022-2028 (USD Billion)
- Figure 283: Asia Pacific Government & Military Footprint in Global Market, 2021 (% of Global Market)
- Figure 284: China LEO Satellite Market, By Value, 2018-2028 (USD Billion)
- Figure 285: China LEO Satellite Market, CAGR, By Value, 2018-2021, 2023-2028 (%)
- Figure 286: China LEO Satellite Market Value, By Application Type, 2021 (USD Billion)
- Figure 287: China LEO Satellite Market Share, By Application Type, By Value, 2021 (%)
- Figure 288: China LEO Satellite Market Share, By Weight Type, By Value, 2021 (%)
- Figure 289: China LEO Satellite Market Share, By End User Type, By Value, 2021 (%)
- Figure 290: India LEO Satellite Market, By Value, 2018-2028 (USD Billion)
- Figure 291: India LEO Satellite Market, CAGR, By Value, 2018-2021, 2023-2028 (%)
- Figure 292: India LEO Satellite Market Value, By Application Type, 2021 (USD Billion)
- Figure 293: India LEO Satellite Market Share, By Application Type, By Value, 2021 (%)
- Figure 294: India LEO Satellite Market Share, By Weight Type, By Value, 2021 (%)
- Figure 295: India LEO Satellite Market Share, By End User Type, By Value, 2021 (%)
- Figure 296: Japan LEO Satellite Market, By Value, 2018-2028 (USD Billion)
- Figure 297: Japan LEO Satellite Market, CAGR, By Value, 2018-2021, 2023-2028 (%)
- Figure 298: Japan LEO Satellite Market Value, By Application Type, 2021 (USD Billion)
- Figure 299: Japan LEO Satellite Market Share, By Application Type, By Value, 2021 (%)
- Figure 300: Japan LEO Satellite Market Share, By Weight Type, By Value, 2021 (%)
- Figure 301: Japan LEO Satellite Market Share, By End User Type, By Value, 2021 (%)
- Figure 302: South Korea LEO Satellite Market, By Value, 2018-2028 (USD Billion)
- Figure 303: South Korea LEO Satellite Market, CAGR, By Value, 2018-2021, 2023-2028 (%)
- Figure 304: South Korea LEO Satellite Market Value, By Application Type, 2021 (USD Billion)
- Figure 305: South Korea LEO Satellite Market Share, By Application Type, By Value, 2021 (%)
- Figure 306: South Korea LEO Satellite Market Share, By Weight Type, By Value, 2021 (%)
- Figure 307: South Korea LEO Satellite Market Share, By End User Type, By Value, 2021 (%)
- Figure 308: Rest of Asia Pacific LEO Satellite Market, By Value, 2018-2028 (USD Billion)
- Figure 309: Rest of Asia Pacific LEO Satellite Market, CAGR, By Value, 2018-2021, 2023-2028 (%)
- Figure 310: Rest of Asia Pacific LEO Satellite Market Value, By Application Type, 2021 (USD Billion)
- Figure 311: Rest of Asia Pacific LEO Satellite Market Share, By Application Type, By Value, 2021 (%)
- Figure 312: Rest of Asia Pacific LEO Satellite Market Share, By Weight Type, By Value, 2021 (%)
- Figure 313: Rest of Asia Pacific LEO Satellite Market Share, By End User Type, By Value, 2021 (%)
- Figure 314: Market Value of the Middle East & Africa is expected to grow from USD 0.74 Bn to USD 3.10 Bn in 2028
- Figure 315: Middle East & Africa LEO Satellite Market is expected to foresee an absolute opportunity of 1526 Units during 2018-2028
- Figure 316: Market Value by Application Type
- Figure 317: Market Value by Weight Type
- Figure 318: Market Value by End User Industry
- Figure 319: Middle East & Africa LEO Satellite Market Size, By Value, 2018-2021(USD Billion)
- Figure 320: Middle East & Africa Low Earth Orbit Satellite Market Size, By Value, 2022-2028 (USD Billion)
- Figure 321: Middle East & Africa Low Earth Orbit Satellite Market Share, By Application, 2021 (%)
- Figure 322: Middle East & Africa Low Earth Orbit Satellite Market CAGR, By Application Type, By Value, 2018-2021, 2023-2028 (%)
- Figure 323: Basis Point Analysis of Middle East & Africa Low Earth Orbit Satellite Market, By Application Type (2022,2028)
- Figure 324: Middle East & Africa Market Opportunity Analysis of Low Earth Orbit Satellite Market, By Application Type (2023-2028)
- Figure 325: Middle East & Africa Low Earth Orbit Satellite Market Size, By Communications, By Value, 2018-2021 (USD Billion)
- Figure 326: Middle East & Africa Low Earth Orbit Satellite Market Size, By Communications, By Value, 2022-2028 (USD Billion)
- Figure 327: Middle East & Africa Communications LEO Satellite Market Absolute Opportunity, 2018-2028 (USD Billion)
- Figure 328: Middle East & Africa Low Earth Orbit Satellite Market Size, By Space Exploration, By Value, 2018-2021 (USD Billion)
- Figure 329: Middle East & Africa Low Earth Orbit Satellite Market Size, By Space Exploration, By Value, 2022-2028
Executive Summary
According to Azoth Analytics research report, the Global Low Earth Orbit Satellite market is projected to display a notable growth represented By a CAGR of 25.45% during 2023-2028. The global Low Earth Orbit Satellite market was valued at USD 5.01 Billion in the year 2021 with the Americas region leading the regional market share.
The Global Low Earth Orbit Satellite Market is driven by an increasing investment in Satellite Industry by governments and organizations like SpaceX, and Boeing across the world. Additionally, the increasing internet penetration rate among the growing population in several developing countries is anticipated to propel the growth of the Global Low Earth Orbit Satellite market.
In the Application segment, the Communications Low Earth Orbit Satellite are expected to grow with a significant CAGR and also it is anticipated to hold a major share in the overall Low Earth Orbit Satellite market as increasing demand for broadband services and high data rate connectivity boosting the market.
One of the most important emerging trends that could impact LEO Satellite industry is the increasing significance of AI, ML and Cloud Computing in the Satellite Industry. LEO satellites can promote business by adopting digitalization and the Internet of Things (IoT), particularly in the oil and gas sector. By providing high-quality connectivity to remote oil fields (offshore and onshore), LEO satellite technology can enable oil companies to enhance their digital capabilities, machine learning, and security initiatives at remote sites.
In the Weight Segment, the Micro-sized Low Earth Orbit Satellite and the satellites which weigh under 10 KG hold the largest share in the market as the large players of LEO Satellite manufacturers are acquiring the small players to increase their market share and revenue and expanding their respective LEO Satellite production and manufacturing across the world in countries like USA, China, Russia and in the United Kingdom.
Scope of the Report
- The report presents the analysis of the Low Earth Orbit Satellite Market for the historical period of 2018-2021 and the forecast period of 2023-2028.
- The report analyses the Low Earth Orbit Satellite Market by Value (USD Billion).
- The report analyses the Low Earth Orbit Satellite Market by Application Type (Communications, Space Exploration, Earth Observation & Remote Sensing, Others).
- The report analyses the Low Earth Orbit Satellite Market by Weight Type (Micro (10-100 KG), Mini (100-500 KG), Below 10 KG).
- The report analyses the Low Earth Orbit Satellite Market by End User Industry (Residential, Commercial, Government & Military)
- The Global Low Earth Orbit Satellite Market has been analysed By Region (Americas, Europe, Asia Pacific, and MEA).
- The Global Low Earth Orbit Satellite Market has been analysed By Country (United States, Canada, Germany, U.K, France, Russia, China, India, Japan, South Korea).
- The key insights of the report have been presented through the leading company shares. Also, the attractiveness of the market has been presented by region, by Application, by Weight, by End User.
- Also, the major opportunities, trends, drivers, opportunities and challenges of the industry has been analysed in the report.
- The report tracks competitive developments, strategies, and recent developments. The companies analysed in the report include Northrop Grumman, Kepler Communications, SpaceX, Boeing, Lockheed Martin, Thales, Airbus SE, L3Harris Technologies, Honeywell, OneWeb.
Key Target Audience
- Low Earth Orbit Satellite Companies
- Research and Development (R&D) Organizations
- Government Bodies & Regulating Authorities
- Investment Banks and Equity Firms
Table of Contents
1. Introduction
- 1.1 Overview
- 1.2 Scope of Research
2. Executive Summary
- 2.1 Market Dashboard
- 2.2 Regional Insights
- 2.3 Market Ecosystem Factors
3. Research Methodology
- 3.1 Data Collection Process
- 3.2 Market Trajectory Estimation
- 3.3 Market Size Calculation
4. Market Dynamics
- 4.1 Drivers
- 4.2 Restraints
- 4.3 Opportunities
- 4.4 Trends
- 4.5 Impact assessment of Market Dynamics
5. Value Chain
- 5.1 Raw Material Suppliers
- 5.2 Manufacturers
- 5.3 Distributors
- 5.4 End Use Industries
6. Covid-19 Impact Assessment
- 6.1 Assessment of Degree of Impact of Covid-19 on Global LEO Satellite Market
- 6.2 Region-Wise Quarterly Covid Impact Analysis
7. Porter's Five Forces Analysis
8. Macro Economic Indicator Outlook
- 8.1 Global Information Technology Sector Investments
- 8.2 Manufacturing Sector
- 8.3 Government Investments in Space Industry
- 8.4 Total Objects Launched into Space
- 8.5 Government Investments in Military
9. Average Selling Price Analysis
- 9.1 Average Selling Price, By Region
- 9.2 Average Selling Price, By Application Type
10. Competitive Positioning
- 10.1 Companies' Product Positioning
- 10.2 Market Position Matrix
- 10.3 Market Share Analysis
- 10.3.1 Northrop Grumman
- 10.3.2 Kepler Communications
- 10.3.3 SpaceX
- 10.3.4 Boeing
- 10.3.5 Lockheed Martin
- 10.3.6 Thales
- 10.3.7 Airbus SE
- 10.3.8 L3Harris Technologies
- 10.3.9 Honeywell
- 10.3.10 OneWeb
11. Volumetric Analysis, Units, 2018-2028
- 11.1 Global Low Earth Orbit Satellite Market, By Volume
- 11.1.1 Global Low Earth Orbit Satellite Market, 2018-2028 (Units)
- 11.1.2 Global Low Earth Orbit Satellite Market, By Application, 2018-2028 (Units)
- 11.1.3 Global Low Earth Orbit Satellite Market, By Application, 2018-2021, 2023-2028 CAGR (%)
- 11.2 Americas Low Earth Orbit Satellite Market, By Volume
- 11.2.1 Americas Low Earth Orbit Satellite Market, 2018-2028 (Units)
- 11.2.2 Americas Low Earth Orbit Satellite Market, By Application, 2018-2028 (Units)
- 11.2.3 Americas Low Earth Orbit Satellite Market, By Application, 2018-2021, 2023-2028 CAGR (%)
- 11.3 Europe Low Earth Orbit Satellite Market, By Volume
- 11.3.1 Europe Low Earth Orbit Satellite Market, 2018-2028 (Units)
- 11.3.2 Europe Low Earth Orbit Satellite Market, By Application, 2018-2028 (Units)
- 11.3.3 Europe Low Earth Orbit Satellite Market, By Application, 2018-2021, 2023-2028 CAGR (%)
- 11.4 Asia Pacific Low Earth Orbit Satellite Market, By Volume
- 11.4.1 Asia Pacific Low Earth Orbit Satellite Market, 2018-2028 (Units)
- 11.4.2 Asia Pacific Low Earth Orbit Satellite Market, By Application, 2018-2028 (Units)
- 11.4.3 Asia Pacific Low Earth Orbit Satellite Market, By Application, 2018-2021, 2023-2028 CAGR (%)
- 11.5 Middle East & Africa Low Earth Orbit Satellite Market, By Volume
- 11.5.1 Middle East & Africa Low Earth Orbit Satellite Market, 2018-2028 (Units)
- 11.5.2 Middle East & Africa Low Earth Orbit Satellite Market, By Application, 2018-2028 (Units)
- 11.5.3 Middle East & Africa Low Earth Orbit Satellite Market, By Application, 2018-2021, 2023-2028 CAGR (%)
12. Global Low Earth Orbit Satellite Market Trends and Forecast Analysis, 2018-2028, USD Billion & CAGR
- 12.1 Macro Economic Factor Impact Index
- 12.2 Low Earth Orbit Satellite Market: Dashboard
- 12.3 Low Earth Orbit Satellite Market Size, By Value, 2018-2021(USD Billion)
- 12.4 Low Earth Orbit Satellite Market Size, By Value, 2022-2028 (USD Billion)
- 12.5 Low Earth Orbit Satellite Market: Summary
13. Global Low Earth Orbit Satellite Market Trend And Forecast Analysis, 2018-2028, By Application Type
- 13.1 Low Earth Orbit Satellite Market Trend And Forecast Analysis, By Application Type: Snapshot
- 13.2 Communications
- 13.3 Space Exploration
- 13.4 Earth Observation & Remote Sensing
- 13.5 Other Applications
14. Global Low Earth Orbit Satellite Market Trend And Forecast Analysis, 2018-2028, By Capacity Type
- 14.1 Low Earth Orbit Satellite Market Trend And Forecast Analysis, By Capacity Type: Snapshot
- 14.2 Micro (10-100 KG)
- 14.2 Mini (100-500 KG)
- 14.2 Below 10 KG
15. Global Low Earth Orbit Satellite Market Trend And Forecast Analysis, 2018-2028, By End User Type
- 15.1 Low Earth Orbit Satellite Market Trend And Forecast Analysis, By End User Type: Snapshot
- 15.2 Residential
- 15.3 Commercial
- 15.4 Government & Military
16. Global Low Earth Orbit Satellite Market Trend And Forecast Analysis, 2018-2028, By Region
- 16.1 Regional Coverage of the Study
17. Americas Low Earth Orbit Satellite Market Trends and Forecast Analysis, 2018-2028, USD Billion & CAGR
- 17.1 Macro Economic Factor Impact Index
- 17.2 Impact analysis of market dynamics on LEO Satellite Market
- 17.3 Americas LEO Satellite Market: Dashboard
- 17.4 Americas LEO Satellite Market Size, By Value, 2018-2021(USD Billion)
- 17.5 Americas LEO Satellite Market Size, By Value, 2022-2028 (USD Billion)
18. Americas Leo Satellite Market, By Application Type
- 18.1 Americas Low Earth Orbit Satellite Market: Application Type Overview
- 18.2 Americas Low Earth Orbit Satellite Market: Application Type, By Communications
- 18.3 Americas Low Earth Orbit Satellite Market: Application Type, By Space Exploration
- 18.4 Americas Low Earth Orbit Satellite Market: Application Type, By Earth Observation & Remote Sensing
- 18.5 Americas Low Earth Orbit Satellite Market: Application Type, By Other Applications
19. Americas Leo Satellite Market, By Weight Type
- 19.1 Americas Low Earth Orbit Satellite Market: Weight Type Overview
- 19.2 Americas Low Earth Orbit Satellite Market: Weight Type, By Micro (10-100 KG)
- 19.3 Americas Low Earth Orbit Satellite Market: Weight Type, By Mini (100-500 KG)
- 19.4 Americas Low Earth Orbit Satellite Market: Weight Type, By Below 10 KG
20. Americas Leo Satellite Market, By End User Type
- 20.1 Americas Low Earth Orbit Satellite Market: End User Type Overview
- 20.2 Americas Low Earth Orbit Satellite Market: End User Type, By Residential
- 20.3 Americas Low Earth Orbit Satellite Market: End User Type, By Commercial
- 20.4 Americas Low Earth Orbit Satellite Market: End User Type, By Government & Military
21. Americas Leo Satellite Market, By Country
- 21.1 United States
- 21.2 Canada
- 21.3 Rest of Americas
22. Europe Low Earth Orbit Satellite Market Trends and Forecast Analysis, 2018-2028, USD Billion & CAGR
- 22.1 Macro Economic Factor Impact Index
- 22.2 Impact analysis of market dynamics on LEO Satellite Market
- 22.3 Europe LEO Satellite Market: Dashboard
- 22.4 Europe LEO Satellite Market Size, By Value, 2018-2021(USD Billion)
- 22.5 Europe LEO Satellite Market Size, By Value, 2022-2028 (USD Billion)
23. Europe Leo Satellite Market, By Application Type
- 23.1 Europe Low Earth Orbit Satellite Market: Application Type Overview
- 23.2 Europe Low Earth Orbit Satellite Market: Application Type, By Communications
- 23.3 Europe Low Earth Orbit Satellite Market: Application Type, By Space Exploration
- 23.4 Europe Low Earth Orbit Satellite Market: Application Type, By Earth Observation & Remote Sensing
- 23.5 Europe Low Earth Orbit Satellite Market: Application Type, By Other Applications
24. Europe Leo Satellite Market, By Weight Type
- 24.1 Europe Low Earth Orbit Satellite Market: Weight Type Overview
- 24.2 Europe Low Earth Orbit Satellite Market: Weight Type, By Micro (10-100 KG)
- 24.3 Europe Low Earth Orbit Satellite Market: Weight Type, By Mini (100-500 KG)
- 24.4 Europe Low Earth Orbit Satellite Market: Weight Type, By Below 10 KG
25. Europe Leo Satellite Market, By End User Type
- 25.1 Europe Low Earth Orbit Satellite Market: End User Type Overview
- 25.2 Europe Low Earth Orbit Satellite Market: End User Type, By Residential
- 25.3 Europe Low Earth Orbit Satellite Market: End User Type, By Commercial
- 25.4 Europe Low Earth Orbit Satellite Market: End User Type, By Government & Military
26. Europe Leo Satellite Market, By Country
- 26.1 Germany
- 26.2 United Kingdom
- 26.3 France
- 26.4 Russia
- 26.5 Rest of Europe
27. Asia Pacific Low Earth Orbit Satellite Market Trends and Forecast Analysis, 2018-2028, USD Billion & CAGR
- 27.1 Macro Economic Factor Impact Index
- 27.2 Impact analysis of market dynamics on LEO Satellite Market
- 27.3 Asia Pacific LEO Satellite Market: Dashboard
- 27.4 Asia Pacific LEO Satellite Market Size, By Value, 2018-2021(USD Billion)
- 27.5 Asia Pacific LEO Satellite Market Size, By Value, 2022-2028 (USD Billion)
28. Asia Pacific Leo Satellite Market, By Application Type
- 28.1 Asia Pacific Low Earth Orbit Satellite Market: Application Type Overview
- 28.2 Asia Pacific Low Earth Orbit Satellite Market: Application Type, By Communications
- 28.3 Asia Pacific Low Earth Orbit Satellite Market: Application Type, By Space Exploration
- 28.4 Asia Pacific Low Earth Orbit Satellite Market: Application Type, By Earth Observation & Remote Sensing
- 28.5 Asia Pacific Low Earth Orbit Satellite Market: Application Type, By Other Applications
29. Asia Pacific Leo Satellite Market, By Weight Type
- 29.1 Asia Pacific Low Earth Orbit Satellite Market: Weight Type Overview
- 29.2 Asia Pacific Low Earth Orbit Satellite Market: Weight Type, By Micro (10-100 KG)
- 29.3 Asia Pacific Low Earth Orbit Satellite Market: Weight Type, By Mini (100-500 KG)
- 29.4 Asia Pacific Low Earth Orbit Satellite Market: Weight Type, By Below 10 KG
30. Asia Pacific Leo Satellite Market, By End User Type
- 30.1 Asia Pacific Low Earth Orbit Satellite Market: End User Type Overview
- 30.2 Asia Pacific Low Earth Orbit Satellite Market: End User Type, By Residential
- 30.3 Asia Pacific Low Earth Orbit Satellite Market: End User Type, By Commercial
- 30.4 Asia Pacific Low Earth Orbit Satellite Market: End User Type, By Government & Military
31. Asia Pacific Leo Satellite Market, By Country
- 31.1 China
- 31.2 India
- 31.3 Japan
- 31.4 South Korea
- 31.5 Rest of Asia Pacific
32. Middle East & Africa Low Earth Orbit Satellite Market Trends and Forecast Analysis, 2018-2028, USD Billion & CAGR
- 32.1 Macro Economic Factor Impact Index
- 32.2 Impact analysis of market dynamics on LEO Satellite Market
- 32.3 Middle East & Africa LEO Satellite Market Size, By Value, 2018-2021(USD Billion)
- 32.4 Middle East & Africa LEO Satellite Market Size, By Value, 2022-2028 (USD Billion)
33. Middle East & Africa Leo Satellite Market, By Application Type
- 33.1 Middle East & Africa Low Earth Orbit Satellite Market: Application Type Overview
- 33.2 Middle East & Africa Low Earth Orbit Satellite Market: Application Type, By Communications
- 33.3 Middle East & Africa Low Earth Orbit Satellite Market: Application Type, By Space Exploration
- 33.4 Middle East & Africa Low Earth Orbit Satellite Market: Application Type, By Earth Observation & Remote Sensing
- 33.5 Middle East & Africa Low Earth Orbit Satellite Market: Application Type, By Other Applications
34. Middle East & Africa Leo Satellite Market, By Weight Type
- 34.1 Middle East & Africa Low Earth Orbit Satellite Market: Weight Type Overview
- 34.2 Middle East & Africa Low Earth Orbit Satellite Market: Weight Type, By Micro (10-100 KG)
- 34.3 Middle East & Africa Low Earth Orbit Satellite Market: Weight Type, By Mini (100-500 KG)
- 34.4 Middle East & Africa Low Earth Orbit Satellite Market: Weight Type, By Below 10 KG
35. Middle East & Africa Leo Satellite Market, By End User Type
- 35.1 Middle East & Africa Low Earth Orbit Satellite Market: End User Type Overview
- 35.2 Middle East & Africa Low Earth Orbit Satellite Market: End User Type, By Residential
- 35.3 Middle East & Africa Low Earth Orbit Satellite Market: End User Type, By Commercial
- 35.4 Middle East & Africa Low Earth Orbit Satellite Market: End User Type, By Government & Military