|
|
市場調査レポート
商品コード
1167450
コンフォートフットウェアの世界市場 (2022年):フットウェアの種類別・販売チャネル別・エンドユーザー別の分析 (2023年~2028年)Global Comfort Footwear Market (2022 Edition): Analysis by Footwear Type, Sales Channel, End-User (2023-2028) |
||||||
|
|
|||||||


| コンフォートフットウェアの世界市場 (2022年):フットウェアの種類別・販売チャネル別・エンドユーザー別の分析 (2023年~2028年) |
|
出版日: 2022年11月30日
発行: Azoth Analytics
ページ情報: 英文 250 Pages
納期: 即納可能
|
- 全表示
- 概要
- 図表
- 目次
世界のコンフォートフットウェア市場は、2023年から2028年の間に10.32%のCAGRで著しい成長を示すと予測されています。2028年の市場規模は473億7,000万米ドルと予測され、アジア太平洋が最大の市場シェアを占めています。
市場成長を後押しする2つの主な要因として、フットウェア産業全体の拡大と、快適なフットウェアに対する顧客の人気拡大が挙げられます。また、高齢者人口が継続的に増加しているため、先進国全体の人口動態の変化も快適なフットウェアの需要を増加させています。
アジア太平洋は、市場機会の面で魅力的な地域の一つであると予想されます。アジア太平洋では26BPTの成長が見込まれる一方、南北アメリカは0.16BPTの減少が予想されています。中国、インド、ブラジルなどは、メーカーにとって大きなビジネスチャンスとなることが期待される国です。
当レポートでは、世界のコンフォートフットウェア市場について分析し、市場の概略や基本構造、主な市場促進・抑制要因、市場規模の実績値 (2017年~2021年) と予測値 (2023年~2028年)、フットウェアの種類別・販売チャネル別・エンドユーザー別の詳細動向、地域別・主要国の市場構造・動向、市場の競合情勢と魅力、主要企業のプロファイル・戦略展開状況などを調査しております。
目次
第1章 イントロダクション
第2章 エグゼクティブサマリー
第3章 分析手法
第4章 市場力学
- 促進要因
- 抑制要因
- 機会
- 動向
- 市場力学の影響評価
第5章 バリューチェーン分析
- 原材料サプライヤー
- メーカー
- 流通業者
- エンドユース産業
第6章 新型コロナウイルス感染症 (COVID-19) の影響評価
- コンフォートフットウェア市場に対するCOVID-19の影響度の評価
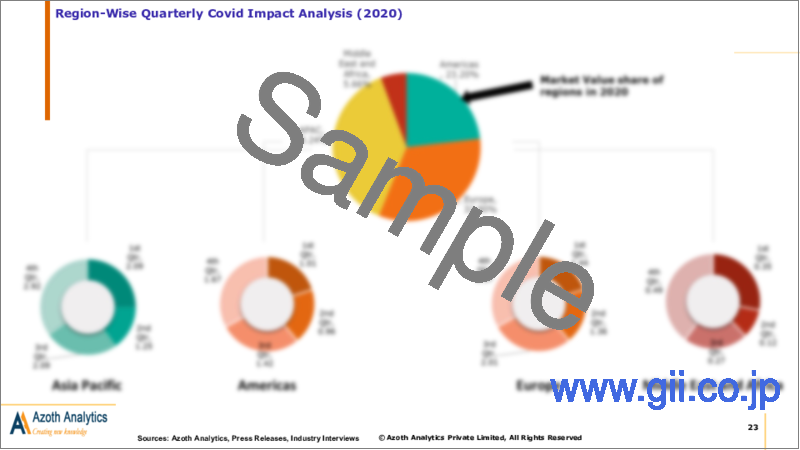
- COVID-19の影響分析:地域別 (四半期ベース)
第7章 ポーターのファイブフォース分析
第8章 マクロ経済指標の見通し
- 世界のGDP成長率:地域別
- 都市人口:全世界・地域別 (総人口の%)
- 世界の対外直接投資 (FDI) の純流入額:地域別 (GDPの%)
- 総人口:地域別
- 65歳以上の人口の割合:地域別 (%)
第9章 平均販売価格の分析
- 平均販売価格:地域別
- 平均販売価格:靴の種類別
第10章 競争上のポジショニング
- 企業の製品ポジショニング
- 市場ポジション・マトリックス
- 市場シェア分析
- ASICS
- Skechers
- New Balance
- CROCS, INC.
- Bata Corporation
- Brooks Sports, Inc.
- Birkenstock
- Caleres Inc.
- Clarks
- Wolverine Worldwide Inc.
第11章 世界のコンフォートフットウェア市場の動向と予測分析 (100万米ドル・CAGR、2018年~2028年)
- マクロ経済要因の影響指数
- 世界のコンフォートフットウェア市場:ダッシュボード
- 世界のコンフォートフットウェアの市場規模 (単位:10億米ドル、2018年~2021年)
- 世界のコンフォートフットウェアの市場規模 (単位:10億米ドル、2022年~2028年)
- 世界のコンフォートフットウェア市場:概要
第12章 世界のコンフォートフットウェア市場の動向と予測分析:フットウェアの種類別 (2018年~2028年)
- 市場概況:フットウェアの種類別
- 靴
- サンダル
- スリッポン
- スリッパ
- その他のフットウェア
第13章 世界のコンフォートフットウェア市場の動向と予測分析:販売チャネル別 (2018年~2028年)
- 市場概況:販売チャネル別
- オンライン
- オフライン
第14章 世界のコンフォートフットウェア市場の動向と予測分析:エンドユーザー別 (2018年~2028年)
- 市場概況:エンドユーザー別
- 男性
- 女性
第15章 世界のコンフォートフットウェア市場の動向と予測分析:地域別 (2018年~2028年)
- 分析対象地域
第16章 南北アメリカのコンフォートフットウェア市場の動向と予測分析 (100万米ドル・CAGR、2018年~2028年)
- マクロ経済要因の影響指数
- コンフォートフットウェア市場に対する市場力学の影響分析
- 南北アメリカのコンフォートフットウェア市場:ダッシュボード
- 南北アメリカのコンフォートフットウェアの市場規模 (単位:100万米ドル、2018年~2021年)
- 南北アメリカのコンフォートフットウェアの市場規模 (単位:100万米ドル、2022年~2028年)
- 市場区分
- フットウェアの種類別
- 販売チャネル別
- エンドユーザー別
- 国別
第17章 欧州のコンフォートフットウェア市場の動向と予測分析 (100万米ドル・CAGR、2018年~2028年)
第18章 アジア太平洋のコンフォートフットウェア市場の動向と予測分析 (100万米ドル・CAGR、2018年~2028年)
第19章 中東・アフリカのコンフォートフットウェア市場の動向と予測分析 (100万米ドル・CAGR、2018年~2028年)
List of Figures
List of Figures
- Figure 1: Comfort Footwear Market for next 7 years (in USD Billions)
- Figure 2: Comfort Footwear Market Size, By Sales channel, 2018 & 2028 (USD Million)
- Figure 3: Comfort Footwear Market Size, By Footwear Type, 2021 (%)
- Figure 4: Average Selling Price, By Region, 2021 (USD/Unit)
- Figure 5: Average Selling Price, By Footwear Type, 2021 (USD/Unit)
- Figure 6: Market Share of Prominent Companies of Comfort Footwear, 2021 (%)
- Figure 7: ASICS Revenues, 2019-2021 (USD Million)
- Figure 8: ASICS Revenue, By Business Segment, 2021 (%)
- Figure 9: ASICS Revenue, By Geographic Segment, 2021 (%)
- Figure 10: Skechers, Inc. Revenues, 2019-2021 (USD Million)
- Figure 11: Skechers, Revenue By Business Segment, 2021 (%)
- Figure 12: Skechers, Inc., Revenue By Geographic Segment, 2021 (%)
- Figure 13: CROCS, INC. Revenues, 2019-2021 (USD Million)
- Figure 14: CROCS, INC. Revenue By Business Segment, 2021 (%)
- Figure 15: CROCS, INC. Revenue By Geographic Segment, 2021 (%)
- Figure 16: Caleres Inc. Revenues, 2019-2021 (USD Million)
- Figure 17: Caleres Inc. Revenue By Business Segment, 2021 (%)
- Figure 18: Caleres Inc. Revenue By Geographic Segment, 2021 (%)
- Figure 19: Wolverine Worldwide Inc. Revenues, 2019-2021 (USD Million)
- Figure 20: Wolverine Worldwide Inc. Fisher Revenue By Business Segment, 2021 (%)
- Figure 21: Wolverine Worldwide Inc. Fisher Revenue By Geographic Segment, 2021 (%)
- Figure 22: At a CAGR of 10.32% during 2023-2028, the global market value is expected to reach USD 47.37 billion in2028
- Figure 23: Online sales value of Comfort Footwear is expected to sustain a staggering sales of USD 16.83 billion units in 2028
- Figure 24: Basis Point Analysis of Global Comfort Footwear Market, By Region (2022,2028)
- Figure 25: Market Opportunity Analysis of Global Comfort Footwear Market, By Region (2023-2028)
- Figure 26: Global Comfort Footwear Market Size, By Value, 2018-2021(USD Billion)
- Figure 27: Global Comfort Footwear Market Share, By Footwear Type, 2021 (%)
- Figure 28: Global Comfort Footwear Market Size, By Value, 2022-2028 (USD Billion)
- Figure 29: Global Comfort Footwear Market CAGR, By Footwear Type, By Value, 2018-2021, 2023-2028 (%)
- Figure 30: Basis Point Analysis of Global Comfort Footwear Market, By Footwear Type (2022,2028)
- Figure 31: Market Opportunity Analysis of Global Comfort Footwear Market, By Footwear Type (2023-2028)
- Figure 32: Global Comfort Footwear Market Size, By Shoes, By Value, 2018-2021 (USD Billion)
- Figure 33: Global Comfort Footwear Market Size, By Shoes, By Value, 2022-2028 (USD Billion)
- Figure 34: Global Shoes Comfort Footwear Absolute Opportunity, 2018-2028 (USD Billion)
- Figure 35: Global Comfort Footwear Market Size, By Sandals, By Value, 2018-2021 (USD Billion)
- Figure 36: Global Comfort Footwear Market Size, By Sandals, By Value, 2022-2028 (USD Billion)
- Figure 37: Global Sandals Comfort Footwear Absolute Opportunity, 2018-2028 (USD Billion)
- Figure 38: Global Comfort Footwear Market Size, By Slip-ons, By Value, 2018-2021 (USD Billion)
- Figure 39: Global Comfort Footwear Market Size, By Slip-ons, By Value, 2022-2028 (USD Billion)
- Figure 40: Global Slip-ons Comfort Footwear Absolute Opportunity, 2018-2028 (USD Billion)
- Figure 41: Global Comfort Footwear Market Size, By Slippers, By Value, 2018-2021 (USD Billion)
- Figure 42: Global Comfort Footwear Market Size, By Slippers, By Value, 2022-2028 (USD Billion)
- Figure 43: Global Slippers Comfort Footwear Absolute Opportunity, 2018-2028 (USD Billion)
- Figure 44: Global Comfort Footwear Market Size, By Others Footwear, By Value, 2018-2021 (USD Billion)
- Figure 45: Global Comfort Footwear Market Size, By Others Footwear, By Value, 2022-2028 (USD Billion)
- Figure 46: Global Others Footwear Comfort Footwear Absolute Opportunity, 2018-2028 (USD Billion)
- Figure 47: Global Comfort Footwear Market CAGR, By Sales Channel, By Value, 2018-2021, 2023-2028 (%)
- Figure 48: Basis Point Analysis of Global Comfort Footwear Market, By Sales Channel (2022,2028)
- Figure 49: Market Opportunity Analysis of Global Comfort Footwear Market, By Sales Channel (2023-2028)
- Figure 50: Global Comfort Footwear Market Size, By Online, By Value, 2018-2021 (USD Billion)
- Figure 51: Global Comfort Footwear Market Size, By Online, By Value, 2022-2028 (USD Billion)
- Figure 52: Global Comfort Footwear Market, By Online, Absolute Opportunity, By Value, 2018-2028 (USD Billion)
- Figure 53: Global Comfort Footwear Market Size, By Offline, By Value, 2018-2021 (USD Billion)
- Figure 54: Global Comfort Footwear Market Size, By Offline, By Value, 2022-2028 (USD Billion)
- Figure 55: Global Comfort Footwear Market, By Offline, Absolute Opportunity, By Value2018-2028 (USD Billion)
- Figure 56: Global Comfort Footwear Market CAGR, By End User, By Value, 2018-2021, 2023-2028 (%)
- Figure 57: Basis Point Analysis of Global Comfort Footwear Market, By End User (2022,2028)
- Figure 58: Market Opportunity Analysis of Global Comfort Footwear Market, By End User (2023-2028)
- Figure 59: Global Comfort Footwear Market Size, By Men, By Value, 2018-2021 (USD Billion)
- Figure 60: Global Comfort Footwear Market Size, By Men, By Value, 2022-2028 (USD Billion)
- Figure 61: Global Comfort Footwear Market, By Men, Absolute Opportunity, By Value, 2018-2028 (USD Billion)
- Figure 62: Global Comfort Footwear Market Size, By Women, By Value, 2018-2021 (USD Billion)
- Figure 63: Global Comfort Footwear Market Size, By Women, By Value, 2022-2028 (USD Billion)
- Figure 64: Global Comfort Footwear Market, By Women, Absolute Opportunity, By Value2018-2028 (USD Billion)
- Figure 65: Market Value of the Americas is expected to grow from USD 5.55 Bn to USD 10.89 Billion in 2028
- Figure 66: Americas Comfort Footwear Market is expected to foresee an absolute opportunity of USD 10.89 Billion during 2018-2028
- Figure 67: Market Value by Footwear Type
- Figure 68: Market Value by Sales Channel
- Figure 69: Market Value by End User
- Figure 70: Basis Point Analysis of Americas Comfort Footwear Market, By Country (2022,2028)
- Figure 71: Market Opportunity Analysis of Americas Comfort Footwear Market, By Country (2023-2028)
- Figure 72: Americas Comfort Footwear Market Size, By Value, 2018-2021(USD Billion)
- Figure 73: Americas Comfort Footwear Market Size, By Value, 2022-2028 (USD Billion)
- Figure 74: Americas Comfort Footwear Market Share, By Footwear Type, 2021 (%)
- Figure 75: Americas Comfort Footwear Market CAGR, By Footwear Type, By Value, 2018-2022, 2023-2028 (%)
- Figure 76: Basis Point Analysis of Americas Comfort Footwear Market, By Footwear Type (2022,2028)
- Figure 77: Market Opportunity Analysis of Americas Comfort Footwear Market, By Footwear Type (2023-2028)
- Figure 78: Americas Comfort Footwear Market Size, By Shoes, By Value, 2018-2021 (USD Billion)
- Figure 79: Americas Comfort Footwear Market Size, By Shoes, By Value, 2022-2028 (USD Billion)
- Figure 80: Americas Shoes Comfort Footwear Footprint in Global Market, 2021 (% of Global Market)
- Figure 81: Americas Comfort Footwear Market Size, By Sandals, By Value, 2018-2021 (USD Billion)
- Figure 82: Americas Comfort Footwear Market Size, By Sandals, By Value, 2022-2028 (USD Billion)
- Figure 83: Americas Sandals Comfort Footwear Footprint in Global Market, 2021 (% of Global Market)
- Figure 84: Americas Comfort Footwear Market Size, By Slip-ons, By Value, 2018-2021 (USD Billion)
- Figure 85: Americas Comfort Footwear Market Size, By Slip-ons, By Value, 2022-2028 (USD Billion)
- Figure 86: Americas Slip-ons Comfort Footwear Footprint in Global Market, 2021 (% of Global Market)
- Figure 87: Americas Comfort Footwear Market Size, By Slippers, By Value, 2018-2021 (USD Billion)
- Figure 88: Americas Comfort Footwear Market Size, By Slippers, By Value, 2022-2028 (USD Billion)
- Figure 89: Americas Slippers Comfort Footwear Footprint in Global Market, 2021 (% of Global Market)
- Figure 90: Americas Comfort Footwear Market Size, By Others Footwear, By Value, 2018-2021 (USD Billion)
- Figure 91: Americas Comfort Footwear Market Size, By Others Footwear, By Value, 2022-2028 (USD Billion)
- Figure 92: Americas Others Footwear Comfort Footwear Footprint in Global Market, 2021 (% of Global Market)
- Figure 93: Americas Comfort Footwear Market CAGR, By Sales Channel, By Value, 2018-2021, 2023-2028 (%)
- Figure 94: Basis Point Analysis of Americas Comfort Footwear Market, By Sales Channel (2022,2028)
- Figure 95: Market Opportunity Analysis of Americas Comfort Footwear Market, By Sales Channel (2023-2028)
- Figure 96: Americas Comfort Footwear Market Size, By Online , By Value, 2018-2021 (USD Billion)
- Figure 97: Americas Comfort Footwear Market Size, By Online, By Value, 2022-2028 (USD Billion)
- Figure 98: Americas Online Comfort Footwear Footprint in Global Market, 2021 (% of Global Market)
- Figure 99: Americas Comfort Footwear Market Size, By Offline, By Value, 2018-2021 (USD Billion)
- Figure 100: Americas Comfort Footwear Market Size, By Offline, By Value, 2022-2028 (USD Billion)
- Figure 101: Americas Offline Comfort Footwear Footprint in Global Market, 2021 (% of Global Market)
- Figure 102: Americas Comfort Footwear Market CAGR, By End User, By Value, 2018-2021, 2023-2028 (%)
- Figure 103: Basis Point Analysis of Americas Comfort Footwear Market, By End User (2022,2028)
- Figure 104: Market Opportunity Analysis of Americas Comfort Footwear Market, By End User (2023-2028)
- Figure 105: Americas Comfort Footwear Market Size, By Men , By Value, 2018-2021 (USD Billion)
- Figure 106: Americas Comfort Footwear Market Size, By Men, By Value, 2022-2028 (USD Billion)
- Figure 107: Americas Men Comfort Footwear Footprint in Global Market, 2021 (% of Global Market)
- Figure 108: Americas Comfort Footwear Market Size, By Women, By Value, 2018-2021 (USD Billion)
- Figure 109: Americas Comfort Footwear Market Size, By Women, By Value, 2022-2028 (USD Billion)
- Figure 110: Americas Women Comfort Footwear Footprint in Global Market, 2021 (% of Global Market)
- Figure 111: United States Comfort Footwear Market, By Value, 2018-2028 (USD Billion)
- Figure 112: United States Comfort Footwear Market, CAGR, By Value, 2018-2021, 2023-2028 (%)
- Figure 113: United States Comfort Footwear Footprint in the Americas Market, 2021 (% of Region Market)
- Figure 114: United States Comfort Footwear Market Share, By Footwear Type, By Value, 2021 (%)
- Figure 115: United States Comfort Footwear Market Share, By Sales Channel, By Value, 2021 (%)
- Figure 116: United States Comfort Footwear Market Share, By End User, By Value, 2021 (%)
- Figure 117: Canada Comfort Footwear Market, By Value, 2018-2028 (USD Billion)
- Figure 118: Canada Comfort Footwear Market, CAGR, By Value, 2018-2021, 2023-2028 (%)
- Figure 119: Canada Comfort Footwear Footprint in the Americas Market, 2021 (% of Region Market)
- Figure 120: Canada Comfort Footwear Market Share, By Footwear Type, By Value, 2021 (%)
- Figure 121: Canada Comfort Footwear Market Share, By Sales Channel, By Value, 2021 (%)
- Figure 122: Canada Comfort Footwear Market Share, By End User, By Value, 2021 (%)
- Figure 123: Brazil Comfort Footwear Market, By Value, 2018-2028 (USD Billion)
- Figure 124: Brazil Comfort Footwear Market, CAGR, By Value, 2018-2021, 2023-2028 (%)
- Figure 125: Brazil Comfort Footwear Footprint in the Americas Market, 2021 (% of Region Market)
- Figure 126: Brazil Comfort Footwear Market Share, By Footwear Type, By Value, 2021 (%)
- Figure 127: Brazil Comfort Footwear Market Share, By Sales Channel, By Value, 2021 (%)
- Figure 128: Brazil Comfort Footwear Market Share, By End User, By Value, 2021 (%)
- Figure 129: Market Value of the Europe is expected to grow from USD 7.89 Bn in 2021 to USD 15.63 Billion in 2028
- Figure 130: Europe Comfort Footwear Market is expected to foresee an absolute opportunity of USD 7.91 Billion during 2018-2028
- Figure 131: Market Value by Footwear Type
- Figure 132: Market Value by Sales Channel
- Figure 133: Market Value by End User
- Figure 134: Basis Point Analysis of Europe Comfort Footwear Market, By Country (2022,2028)
- Figure 135: Market Opportunity Analysis of Europe Comfort Footwear Market, By Country (2023-2028)
- Figure 136: Europe Comfort Footwear Market Size, By Value, 2018-2021(USD Billion)
- Figure 137: Europe Comfort Footwear Market Size, By Value, 2022-2028 (USD Billion)
- Figure 138: Europe Comfort Footwear Market Share, By Footwear Type, 2021 (%)
- Figure 139: Europe Comfort Footwear Market CAGR, By Footwear Type, By Value, 2018-2022, 2023-2028 (%)
- Figure 140: Basis Point Analysis of Europe Comfort Footwear Market, By Footwear Type (2022,2028)
- Figure 141: Market Opportunity Analysis of Europe Comfort Footwear Market, By Footwear Type (2023-2028)
- Figure 142: Europe Comfort Footwear Market Size, By Shoes, By Value, 2018-2021 (USD Billion)
- Figure 143: Europe Comfort Footwear Market Size, By Shoes, By Value, 2022-2028 (USD Billion)
- Figure 144: Europe Shoes Comfort Footwear Footprint in Global Market, 2021 (% of Global Market)
- Figure 145: Europe Comfort Footwear Market Size, By Sandals, By Value, 2018-2021 (USD Billion)
- Figure 146: Europe Comfort Footwear Market Size, By Sandals, By Value, 2022-2028 (USD Billion)
- Figure 147: Europe Sandals Comfort Footwear Footprint in Global Market, 2021 (% of Global Market)
- Figure 148: Europe Comfort Footwear Market Size, By Slip-ons, By Value, 2018-2021 (USD Billion)
- Figure 149: Europe Comfort Footwear Market Size, By Slip-ons, By Value, 2022-2028 (USD Billion)
- Figure 150: Europe Slip-ons Comfort Footwear Footprint in Global Market, 2021 (% of Global Market)
- Figure 151: Europe Comfort Footwear Market Size, By Slippers, By Value, 2018-2021 (USD Billion)
- Figure 152: Europe Comfort Footwear Market Size, By Slippers, By Value, 2022-2028 (USD Billion)
- Figure 153: Europe Slippers Comfort Footwear Footprint in Global Market, 2021 (% of Global Market)
- Figure 154: Europe Comfort Footwear Market Size, By Others Footwear, By Value, 2018-2021 (USD Billion)
- Figure 155: Europe Comfort Footwear Market Size, By Others Footwear, By Value, 2022-2028 (USD Billion)
- Figure 156: Europe Others Footwear Comfort Footwear Footprint in Global Market, 2021 (% of Global Market)
- Figure 157: Europe Comfort Footwear Market CAGR, By Sales Channel, By Value, 2018-2021, 2023-2028 (%)
- Figure 158: Basis Point Analysis of Europe Comfort Footwear Market, By Sales Channel (2022,2028)
- Figure 159: Market Opportunity Analysis of Europe Comfort Footwear Market, By Sales Channel (2023-2028)
- Figure 160: Europe Comfort Footwear Market Size, By Online , By Value, 2018-2021 (USD Billion)
- Figure 161: Europe Comfort Footwear Market Size, By Online, By Value, 2022-2028 (USD Billion)
- Figure 162: Europe Online Comfort Footwear Footprint in Global Market, 2021 (% of Global Market)
- Figure 163: Europe Comfort Footwear Market Size, By Offline, By Value, 2018-2021 (USD Billion)
- Figure 164: Europe Comfort Footwear Market Size, By Offline, By Value, 2022-2028 (USD Billion)
- Figure 165: Europe Offline Comfort Footwear Footprint in Global Market, 2021 (% of Global Market)
- Figure 166: Europe Comfort Footwear Market CAGR, By End User, By Value, 2018-2021, 2023-2028 (%)
- Figure 167: Basis Point Analysis of Europe Comfort Footwear Market, By End User (2022,2028)
- Figure 168: Market Opportunity Analysis of Europe Comfort Footwear Market, By End User (2023-2028)
- Figure 169: Europe Comfort Footwear Market Size, By Men , By Value, 2018-2021 (USD Billion)
- Figure 170: Europe Comfort Footwear Market Size, By Men, By Value, 2022-2028 (USD Billion)
- Figure 171: Europe Men Comfort Footwear Footprint in Global Market, 2021 (% of Global Market)
- Figure 172: Europe Comfort Footwear Market Size, By Women, By Value, 2018-2021 (USD Billion)
- Figure 173: Europe Comfort Footwear Market Size, By Women, By Value, 2022-2028 (USD Billion)
- Figure 174: Europe Women Comfort Footwear Footprint in Global Market, 2021 (% of Global Market)
- Figure 175: Germany Comfort Footwear Market, By Value, 2018-2028 (USD Billion)
- Figure 176: Germany Comfort Footwear Market, CAGR, By Value, 2018-2021, 2023-2028 (%)
- Figure 177: Germany Comfort Footwear Footprint in the Europe Market, 2021 (% of Region Market)
- Figure 178: Germany Comfort Footwear Market Share, By Footwear Type, By Value, 2021 (%)
- Figure 179: Germany Comfort Footwear Market Share, By Sales Channel, By Value, 2021 (%)
- Figure 180: Germany Comfort Footwear Market Share, By End User, By Value, 2021 (%)
- Figure 181: UK Comfort Footwear Market, By Value, 2018-2028 (USD Billion)
- Figure 182: UK Comfort Footwear Market, CAGR, By Value, 2018-2021, 2023-2028 (%)
- Figure 183: UK Comfort Footwear Footprint in the Europe Market, 2021 (% of Region Market)
- Figure 184: UK Comfort Footwear Market Share, By Footwear Type, By Value, 2021 (%)
- Figure 185: UK Comfort Footwear Market Share, By Sales Channel, By Value, 2021 (%)
- Figure 186: UK Comfort Footwear Market Share, By End User, By Value, 2021 (%)
- Figure 187: France Comfort Footwear Market, By Value, 2018-2028 (USD Billion)
- Figure 188: France Comfort Footwear Market, CAGR, By Value, 2018-2021, 2023-2028 (%)
- Figure 189: France Comfort Footwear Footprint in the Europe Market, 2021 (% of Region Market)
- Figure 190: France Comfort Footwear Market Share, By Footwear Type, By Value, 2021 (%)
- Figure 191: France Comfort Footwear Market Share, By Sales Channel, By Value, 2021 (%)
- Figure 192: France Comfort Footwear Market Share, By End User, By Value, 2021 (%)
- Figure 193: Market Value of the Asia Pacific is expected to grow from USD 9.18 Bn in 2021 to USD 18.28 Billion in 2028
- Figure 194: Asia Pacific Comfort Footwear Market is expected to foresee an absolute opportunity of USD 9.33 Billion during 2018-2028
- Figure 195: Market Value by Footwear Type
- Figure 196: Market Value by Sales Channel
- Figure 197: Market Value by End User
- Figure 198: Basis Point Analysis of Asia Pacific Comfort Footwear Market, By Country (2022,2028)
- Figure 199: Market Opportunity Analysis of Asia Pacific Comfort Footwear Market, By Country (2023-2028)
- Figure 200: Asia Pacific Comfort Footwear Market Size, By Value, 2018-2021(USD Billion)
- Figure 201: Asia Pacific Comfort Footwear Market Size, By Value, 2022-2028 (USD Billion)
- Figure 202: Asia Pacific Comfort Footwear Market Share, By Footwear Type, 2021 (%)
- Figure 203: Asia Pacific Comfort Footwear Market CAGR, By Footwear Type, By Value, 2018-2022, 2023-2028 (%)
- Figure 204: Basis Point Analysis of Asia Pacific Comfort Footwear Market, By Footwear Type (2022,2028)
- Figure 205: Market Opportunity Analysis of Asia Pacific Comfort Footwear Market, By Footwear Type (2023-2028)
- Figure 206: Asia Pacific Comfort Footwear Market Size, By Shoes, By Value, 2018-2021 (USD Billion)
- Figure 207: Asia Pacific Comfort Footwear Market Size, By Shoes, By Value, 2022-2028 (USD Billion)
- Figure 208: Asia Pacific Shoes Comfort Footwear Footprint in Global Market, 2021 (% of Global Market)
- Figure 209: Asia Pacific Comfort Footwear Market Size, By Sandals, By Value, 2018-2021 (USD Billion)
- Figure 210: Asia Pacific Comfort Footwear Market Size, By Sandals, By Value, 2022-2028 (USD Billion)
- Figure 211: Asia Pacific Sandals Comfort Footwear Footprint in Global Market, 2021 (% of Global Market)
- Figure 212: Asia Pacific Comfort Footwear Market Size, By Slip-ons, By Value, 2018-2021 (USD Billion)
- Figure 213: Asia Pacific Comfort Footwear Market Size, By Slip-ons, By Value, 2022-2028 (USD Billion)
- Figure 214: Asia Pacific Slip-ons Comfort Footwear Footprint in Global Market, 2021 (% of Global Market)
- Figure 215: Asia Pacific Comfort Footwear Market Size, By Slippers, By Value, 2018-2021 (USD Billion)
- Figure 216: Asia Pacific Comfort Footwear Market Size, By Slippers, By Value, 2022-2028 (USD Billion)
- Figure 217: Asia Pacific Slippers Comfort Footwear Footprint in Global Market, 2021 (% of Global Market)
- Figure 218: Asia Pacific Comfort Footwear Market Size, By Others Footwear, By Value, 2018-2021 (USD Billion)
- Figure 219: Asia Pacific Comfort Footwear Market Size, By Others Footwear, By Value, 2022-2028 (USD Billion)
- Figure 220: Asia Pacific Others Footwear Comfort Footwear Footprint in Global Market, 2021 (% of Global Market)
- Figure 221: Asia Pacific Comfort Footwear Market CAGR, By Sales Channel, By Value, 2018-2021, 2023-2028 (%)
- Figure 222: Basis Point Analysis of Asia Pacific Comfort Footwear Market, By Sales Channel (2022,2028)
- Figure 223: Market Opportunity Analysis of Asia Pacific Comfort Footwear Market, By Sales Channel (2023-2028)
- Figure 224: Asia Pacific Comfort Footwear Market Size, By Online , By Value, 2018-2021 (USD Billion)
- Figure 225: Asia Pacific Comfort Footwear Market Size, By Online, By Value, 2022-2028 (USD Billion)
- Figure 226: Asia Pacific Online Comfort Footwear Footprint in Global Market, 2021 (% of Global Market)
- Figure 227: Asia Pacific Comfort Footwear Market Size, By Offline, By Value, 2018-2021 (USD Billion)
- Figure 228: Asia Pacific Comfort Footwear Market Size, By Offline, By Value, 2022-2028 (USD Billion)
- Figure 229: Asia Pacific Offline Comfort Footwear Footprint in Global Market, 2021 (% of Global Market)
- Figure 230: Asia Pacific Comfort Footwear Market CAGR, By End User, By Value, 2018-2021, 2023-2028 (%)
- Figure 231: Basis Point Analysis of Asia Pacific Comfort Footwear Market, By End User (2022,2028)
- Figure 232: Market Opportunity Analysis of Asia Pacific Comfort Footwear Market, By End User (2023-2028)
- Figure 233: Asia Pacific Comfort Footwear Market Size, By Men , By Value, 2018-2021 (USD Billion)
- Figure 234: Asia Pacific Comfort Footwear Market Size, By Men, By Value, 2022-2028 (USD Billion)
- Figure 235: Asia Pacific Men Comfort Footwear Footprint in Global Market, 2021 (% of Global Market)
- Figure 236: Asia Pacific Comfort Footwear Market Size, By Women, By Value, 2018-2021 (USD Billion)
- Figure 237: Asia Pacific Comfort Footwear Market Size, By Women, By Value, 2022-2028 (USD Billion)
- Figure 238: Asia Pacific Women Comfort Footwear Footprint in Global Market, 2021 (% of Global Market)
- Figure 239: China Comfort Footwear Market, By Value, 2018-2028 (USD Billion)
- Figure 240: China Comfort Footwear Market, CAGR, By Value, 2018-2021, 2023-2028 (%)
- Figure 241: China Comfort Footwear Footprint in the Europe Market, 2021 (% of Region Market)
- Figure 242: China Comfort Footwear Market Share, By Footwear Type, By Value, 2021 (%)
- Figure 243: China Comfort Footwear Market Share, By Sales Channel, By Value, 2021 (%)
- Figure 244: China Comfort Footwear Market Share, By End User, By Value, 2021 (%)
- Figure 245: India Comfort Footwear Market, By Value, 2018-2028 (USD Billion)
- Figure 246: India Comfort Footwear Market, CAGR, By Value, 2018-2021, 2023-2028 (%)
- Figure 247: India Comfort Footwear Footprint in the Europe Market, 2021 (% of Region Market)
- Figure 248: India Comfort Footwear Market Share, By Footwear Type, By Value, 2021 (%)
- Figure 249: India Comfort Footwear Market Share, By Sales Channel, By Value, 2021 (%)
- Figure 250: India Comfort Footwear Market Share, By End User, By Value, 2021 (%)
- Figure 251: Japan Comfort Footwear Market, By Value, 2018-2028 (USD Billion)
- Figure 252: Japan Comfort Footwear Market, CAGR, By Value, 2018-2021, 2023-2028 (%)
- Figure 253: Japan Comfort Footwear Footprint in the Europe Market, 2021 (% of Region Market)
- Figure 254: Japan Comfort Footwear Market Share, By Footwear Type, By Value, 2021 (%)
- Figure 255: Japan Comfort Footwear Market Share, By Sales Channel, By Value, 2021 (%)
- Figure 256: Japan Comfort Footwear Market Share, By End User, By Value, 2021 (%)
- Figure 257: South Korea Comfort Footwear Market, By Value, 2018-2028 (USD Billion)
- Figure 258: South Korea Comfort Footwear Market, CAGR, By Value, 2018-2021, 2023-2028 (%)
- Figure 259: South Korea Comfort Footwear Footprint in the Europe Market, 2021 (% of Region Market)
- Figure 260: South Korea Comfort Footwear Market Share, By Footwear Type, By Value, 2021 (%)
- Figure 261: South Korea Comfort Footwear Market Share, By Sales Channel, By Value, 2021 (%)
- Figure 262: South Korea Comfort Footwear Market Share, By End User, By Value, 2021 (%)
- Figure 263: Market Value of the Middle East & Africa is expected to grow from USD 1.35 Bn in 2021 to USD 2.58 Billion in 2028
- Figure 264: Middle East & Africa Comfort Footwear Market is expected to foresee an absolute opportunity of USD 1.24 Billion during 2018-2028
- Figure 265: Market Value by Footwear Type
- Figure 266: Market Value by Sales Channel
- Figure 267: Market Value by End User
- Figure 268: Middle East & Africa Comfort Footwear Market Size, By Value, 2018-2021(USD Billion)
- Figure 269: Middle East & Africa Comfort Footwear Market Size, By Value, 2022-2028 (USD Billion)
- Figure 270: Middle East & Africa Comfort Footwear Market Share, By Footwear Type, 2021 (%)
- Figure 271: Middle East & Africa Comfort Footwear Market CAGR, By Footwear Type, By Value, 2018-2022, 2023-2028 (%)
- Figure 272: Basis Point Analysis of Middle East & Africa Comfort Footwear Market, By Footwear Type (2022,2028)
- Figure 273: Market Opportunity Analysis of Middle East & Africa Comfort Footwear Market, By Footwear Type (2023-2028)
- Figure 274: Middle East & Africa Comfort Footwear Market Size, By Shoes, By Value, 2018-2021 (USD Billion)
- Figure 275: Middle East & Africa Comfort Footwear Market Size, By Shoes, By Value, 2022-2028 (USD Billion)
- Figure 276: Middle East & Africa Shoes Comfort Footwear Footprint in Global Market, 2021 (% of Global Market)
- Figure 277: Middle East & Africa Comfort Footwear Market Size, By Sandals, By Value, 2018-2021 (USD Billion)
- Figure 278: Middle East & Africa Comfort Footwear Market Size, By Sandals, By Value, 2022-2028 (USD Billion)
- Figure 279: Middle East & Africa Sandals Comfort Footwear Footprint in Global Market, 2021 (% of Global Market)
- Figure 280: Middle East & Africa Comfort Footwear Market Size, By Slip-ons, By Value, 2018-2021 (USD Billion)
- Figure 281: Middle East & Africa Comfort Footwear Market Size, By Slip-ons, By Value, 2022-2028 (USD Billion)
- Figure 282: Middle East & Africa Slip-ons Comfort Footwear Footprint in Global Market, 2021 (% of Global Market)
- Figure 283: Middle East & Africa Comfort Footwear Market Size, By Slippers, By Value, 2018-2021 (USD Billion)
- Figure 284: Middle East & Africa Comfort Footwear Market Size, By Slippers, By Value, 2022-2028 (USD Billion)
- Figure 285: Middle East & Africa Slippers Comfort Footwear Footprint in Global Market, 2021 (% of Global Market)
- Figure 286: Middle East & Africa Comfort Footwear Market Size, By Others Footwear, By Value, 2018-2021 (USD Billion)
- Figure 287: Middle East & Africa Comfort Footwear Market Size, By Others Footwear, By Value, 2022-2028 (USD Billion)
- Figure 288: Middle East & Africa Others Footwear Comfort Footwear Footprint in Global Market, 2021 (% of Global Market)
- Figure 289: Middle East & Africa Comfort Footwear Market CAGR, By Sales Channel, By Value, 2018-2021, 2023-2028 (%)
- Figure 290: Basis Point Analysis of Middle East & Africa Comfort Footwear Market, By Sales Channel (2022,2028)
- Figure 291: Market Opportunity Analysis of Middle East & Africa Comfort Footwear Market, By Sales Channel (2023-2028)
- Figure 292: Middle East & Africa Comfort Footwear Market Size, By Online , By Value, 2018-2021 (USD Billion)
- Figure 293: Middle East & Africa Comfort Footwear Market Size, By Online, By Value, 2022-2028 (USD Billion)
- Figure 294: Middle East & Africa Online Comfort Footwear Footprint in Global Market, 2021 (% of Global Market)
- Figure 295: Middle East & Africa Comfort Footwear Market Size, By Offline, By Value, 2018-2021 (USD Billion)
- Figure 296: Middle East & Africa Comfort Footwear Market Size, By Offline, By Value, 2022-2028 (USD Billion)
- Figure 297: Middle East & Africa Offline Comfort Footwear Footprint in Global Market, 2021 (% of Global Market)
- Figure 298: Middle East & Africa Comfort Footwear Market CAGR, By End User, By Value, 2018-2021, 2023-2028 (%)
- Figure 299: Basis Point Analysis of Middle East & Africa Comfort Footwear Market, By End User (2022,2028)
- Figure 300: Market Opportunity Analysis of Middle East & Africa Comfort Footwear Market, By End User (2023-2028)
- Figure 301: Middle East & Africa Comfort Footwear Market Size, By Men, By Value, 2018-2021 (USD Billion)
- Figure 302: Middle East & Africa Comfort Footwear Market Size, By Men, By Value, 2022-2028 (USD Billion)
- Figure 303: Middle East & Africa Men Comfort Footwear Footprint in Global Market, 2021 (% of Global Market)
- Figure 304: Middle East & Africa Comfort Footwear Market Size, By Women, By Value, 2018-2021 (USD Billion)
- Figure 305: Middle East & Africa Comfort Footwear Market Size, By Women, By Value, 2022-2028 (USD Billion)
- Figure 306: Middle East & Africa Women Comfort Footwear Footprint in Global Market, 2021 (% of Global Market)
List of Tables
Table A1: Global Impact of Drivers and Restraints
Table A2: Key Company Financials, 2019-2021
Table A3: Key Company Financials, 2019-2021
Table A4: Key Company Financials, 2019-2021
Table A5: Key Company Financials, 2019-2021
Table A6: Key Company Financials, 2019-2021
Table A7: Global Impact of Macro Economic Factors, By Region
Table A8: Americas Impact of Macro Economic Factors, By Country
Table A9: Americas Impact of Drivers and Restraints
Table A10: United States Comfort Footwear Market, By Footwear Type, By Value, 2018-2021 (USD Million)
Table A11: United States Comfort Footwear Market, By Footwear Type, By Value, 2022-2028 (USD Million)
Table A12: United States Comfort Footwear Market, By Sales Channel, By Value, 2018-2021 (USD Million)
Table A13: United States Comfort Footwear Market, By Sales Channel, By Value, 2022-2028 (USD Million)
Table A14: United States Comfort Footwear Market, By End User, By Value, 2018-2021 (USD Million)
Table A15: United States Comfort Footwear Market, By End User, By Value, 2022-2028 (USD Million)
Table A16: Canada Comfort Footwear Market, By Footwear Type, By Value, 2018-2021 (USD Million)
Table A17: Canada Comfort Footwear Market, By Footwear Type, By Value, 2022-2028 (USD Million)
Table A18: Canada Comfort Footwear Market, By Sales Channel, By Value, 2018-2021 (USD Million)
Table A19: Canada Comfort Footwear Market, By Sales Channel, By Value, 2022-2028 (USD Million)
Table A20: Canada Comfort Footwear Market, By End User, By Value, 2018-2021 (USD Million)
Table A21: Canada Comfort Footwear Market, By End User, By Value, 2022-2028 (USD Million)
Table A22: Brazil Comfort Footwear Market, By Footwear Type, By Value, 2018-2021 (USD Million)
Table A23: Brazil Comfort Footwear Market, By Footwear Type, By Value, 2022-2028 (USD Million)
Table A24: Brazil Comfort Footwear Market, By Sales Channel, By Value, 2018-2021 (USD Million)
Table A25: Brazil Comfort Footwear Market, By Sales Channel, By Value, 2022-2028 (USD Million)
Table A 26: Brazil Comfort Footwear Market, By End User, By Value, 2018-2021 (USD Million)
Table A27: Brazil Comfort Footwear Market, By End User, By Value, 2022-2028 (USD Million)
Table A28: Europe Impact of Macro Economic Factors, By Country
Table A29: Europe Impact of Drivers and Restraints
Table A30: Germany Comfort Footwear Market, By Footwear Type, By Value, 2018-2021 (USD Million)
Table A31: Germany Comfort Footwear Market, By Footwear Type, By Value, 2022-2028 (USD Million)
Table A32: Germany Comfort Footwear Market, By Sales Channel, By Value, 2018-2021 (USD Million)
Table A33: Germany Comfort Footwear Market, By Sales Channel, By Value, 2022-2028 (USD Million)
Table A34: Germany Comfort Footwear Market, By End User, By Value, 2018-2021 (USD Million)
Table A35: Germany Comfort Footwear Market, By End User, By Value, 2022-2028 (USD Million)
Table A36: UK Comfort Footwear Market, By Footwear Type, By Value, 2018-2021 (USD Million)
Table A37: UK Comfort Footwear Market, By Footwear Type, By Value, 2022-2028 (USD Million)
Table A38: UK Comfort Footwear Market, By Sales Channel, By Value, 2018-2021 (USD Million)
Table A39: UK Comfort Footwear Market, By Sales Channel, By Value, 2022-2028 (USD Million)
Table A40: UK Comfort Footwear Market, By End User, By Value, 2018-2021 (USD Million)
Table A41: UK Comfort Footwear Market, By End User, By Value, 2022-2028 (USD Million)
Table A42: France Comfort Footwear Market, By Footwear Type, By Value, 2018-2021 (USD Million)
Table A43: France Comfort Footwear Market, By Footwear Type, By Value, 2022-2028 (USD Million)
Table A44: France Comfort Footwear Market, By Sales Channel, By Value, 2018-2021 (USD Million)
Table A45: France Comfort Footwear Market, By Sales Channel, By Value, 2022-2028 (USD Million)
Table A46: France Comfort Footwear Market, By End User, By Value, 2018-2021 (USD Million)
Table A47: France Comf
Executive Summary
The Global Comfort Footwear Market is projected to display significant growth represented by a CAGR of 10.32% during 2023-2028. The global Comfort Footwear Market is expected to be valued at USD 47.37 Billion in the year 2028 with Asia Pacific leading the regional market share.
According to many podiatrists, defining a comfortable shoe is totally based on individual preference. It depends on an individual foot structure, as well as the purpose for when or how someone is going to be using them. For example, shoes for plantar fasciitis should have ample arch support (likewise, people with flat feet have fallen arches and need flexible medial posts for stability). People with bunions should look for shoes with a wide toe box and soft, flexible materials so their toes don't feel constricted. So, it all varies from person to person and therefore there are some shoe brands that promote comfort more than others. These companies are focusing on using special comfort technologies and utilizing special materials so that a person's feet stay more comfortable inside their provided footwear product.
Companies around the world use key strategies such as Component launches, business expansions, mergers and acquisitions, patents and approvals, agreements and collaborations. The expansion of the overall footwear industry and a rising inclination of customers for comfort footwear are two major drivers boosting market expansion. Changing population demographics across developed countries due to which the population of older adults has been increasing continuously is also one of the leading factors for increasing the demand for comfort footwear.
Asia Pacific is anticipated to be amongst the attractive regions in terms of opportunities. Asia Pacific is expected to grow by 26 basis points while the Americas is expected to decline by 16 basis points. China, India and Brazil are among the countries that are expected to present flourishing opportunities for manufacturers.
Scope of the Report
- The report presents the analysis of the Global Comfort Footwear Market for the historical period of 2017-2021 and the forecast period of 2023-2028.
- The report analyses the Global Comfort Footwear Market by Value (USD Billion).
- The report analyses the Global Comfort Footwear Market by Footwear Type (Shoes, Sandals, Slip-on, Slippers, Other Footwear)
- The report analyses the Global Comfort Footwear Market by Sales Channel (Online, Offline)
- The report analyses the Global Comfort Footwear Market by End-User (Men, Women)
- The Global Comfort Footwear Market has been analysed By Region and By Country.
- The key insights of the report have been presented through the frameworks of the attractiveness of the market has been presented by region, by Footwear Type, by Sales Channel, by End User.
- Also, the major opportunities, trends, drivers and challenges of the industry has been analysed in the report.
- The report tracks competitive developments, strategies, mergers and acquisitions and new product development. The companies analysed in the report include ASICS, Skechers, New Balance, CROCS, INC., Bata Corporation, Brooks Sports, Inc., Birkenstock, Caleres Inc., Clarks, Wolverine Worldwide Inc.
Key Target Audience
- Footwear Companies
- Consulting and Advisory Firms
- Government and Policy Makers
- Regulatory Authorities
Table of Contents
1. Introduction
- 1.1 Comfort Footwear Overview
- 1.2 Scope of Research
2. Executive Summary
- 2.1 Market Dashboard
- 2.2 Regional Insights
- 2.3 Market Ecosystem Factors
3. Research Methodology
- 3.1 Data Collection Process
- 3.2 Market Trajectory Estimation
- 3.3 Market Size Calculation
4. Market Dynamics
- 4.1 Drivers
- 4.2 Restraints
- 4.3 Opportunities
- 4.4 Trends
- 4.5 Impact assessment of Market Dynamics
5. Value Chain Analysis
- 5.1 Raw material Suppliers
- 5.2 Manufacturers
- 5.3 Distributors
- 5.4 End-Use Industry
6. Covid-19 Impact Assessment
- 6.1 Assessment of the Degree of Impact of Covid-19 on the Comfort Footwear Market
- 6.2 Region-Wise Quarterly Covid Impact Analysis
7. Porter's Five Forces Analysis
8. Macro Economic Indicator Outlook
- 8.1 Global, Region-wise GDP Growth
- 8.2 Global and Region wise Urban Population (% of total population)
- 8.3 Global FDI, Net Inflows by Region (% of GDP)
- 8.4 Total Population by Region (Billions)
- 8.5 Proportion of Population over 65 years across regions (%)
9. Average Selling Price Analysis
- 9.1 Average Selling Price, By Region
- 9.2 Average Selling Price, By Footwear Type
10. Competitive Positioning
- 10.1 Companies' Product Positioning
- 10.2 Market Position Matrix
- 10.3 Market Share Analysis
- 10.3.1 ASICS
- 10.3.2 Skechers
- 10.3.3 New Balance
- 10.3.4 CROCS, INC.
- 10.3.5 Bata Corporation
- 10.3.6 Brooks Sports, Inc.
- 10.3.7 Birkenstock
- 10.3.8 Caleres Inc.
- 10.3.9 Clarks
- 10.3.10 Wolverine Worldwide Inc.
11. Global Comfort Footwear Market Trends and Forecast Analysis, 2018-2028, USD Million & CAGR
- 11.1 Macro Economic Factor Impact Index
- 11.2 Global Comfort Footwear Market: Dashboard
- 11.3 Global Comfort Footwear Market Size, By Value, 2018-2021(USD Billion)
- 11.4 Global Comfort Footwear Market Size, By Value, 2022-2028 (USD Billion)
- 11.5 Global Comfort Footwear Market: Summary
12. Global Comfort Footwear Market Trend And Forecast Analysis, 2018-2028, By Footwear Type
- 12.1 Global Comfort Footwear Market Trend And Forecast Analysis, By Footwear Type: Snapshot
- 12.2 Shoes
- 12.3 Sandals
- 12.4 Slip-on
- 12.5 Slippers
- 12.6 Others Footwear
13. Global Comfort Footwear Market Trend And Forecast Analysis, 2018-2028, By Sales Channel
- 13.1 Global Comfort Footwear Market Trend And Forecast Analysis, By Sales Channel: Snapshot
- 13.2 Online
- 13.3 Offline
14. Global Comfort Footwear Market Trend And Forecast Analysis, 2018-2028, By End User
- 14.1 Global Comfort Footwear Market Trend And Forecast Analysis, By End User: Snapshot
- 14.2 Men
- 14.3 Women
15. Global Comfort Footwear Market Trend And Forecast Analysis, 2018-2028, By Region
- 15.1 Regional Coverage of the Study
16. Americas Comfort Footwear Market Trends and Forecast Analysis, 2018-2028, USD Million & CAGR
- 16.1 Macro Economic Factor Impact Index
- 16.2 Impact analysis of market dynamics on the Comfort Footwear Market
- 16.3 Americas Comfort Footwear Market: Dashboard
- 16.4 Americas Comfort Footwear Market Size, By Value, 2018-2021(USD Million)
- 16.5 Americas Comfort Footwear Market Size, By Value, 2022-2028 (USD Million)
- 16.6 Americas Comfort Footwear Market Trend And Forecast Analysis: Segmentation
- 16.6.1 By Footwear Type
- 16.6.2 By Sales Channel
- 16.6.3 By End-User
- 16.6.4 By Country
- 16.6.4.1 United States
- 16.6.4.2 Canada
- 16.6.4.3 Brazil
17. Europe Comfort Footwear Market Trends and Forecast Analysis, 2018-2028, USD Million & CAGR
- 17.1 Macro Economic Factor Impact Index
- 17.2 Impact analysis of market dynamics on Comfort Footwear Market
- 17.3 Europe Comfort Footwear Market: Dashboard
- 17.4 Europe Comfort Footwear Market Size, By Value, 2018-2021(USD Million)
- 17.5 Europe Comfort Footwear Market Size, By Value, 2022-2028 (USD Million)
- 17.6 Europe Comfort Footwear Market Trend And Forecast Analysis: Segmentation
- 17.6.1 By Footwear Type
- 17.6.2 By Sales Channel
- 17.6.3 By End-User
- 17.6.4 By Country
- 17.6.4.1 Germany
- 17.6.4.2 United Kingdom
- 17.6.4.3 France
18. Asia Pacific Comfort Footwear Market Trends and Forecast Analysis, 2018-2028, USD Million & CAGR
- 18.1 Macro Economic Factor Impact Index
- 18.2 Impact analysis of market dynamics on Comfort Footwear Market
- 18.3 Asia Pacific Comfort Footwear Market: Dashboard
- 18.4 Asia Pacific Comfort Footwear Market Size, By Value, 2018-2021(USD Million)
- 18.5 Asia Pacific Comfort Footwear Market Size, By Value, 2022-2028 (USD Million)
- 18.6 Asia Pacific Comfort Footwear Market Trend And Forecast Analysis: Segmentation
- 18.6.1 By Footwear Type
- 18.6.2 By Sales Channel
- 18.6.3 By End-User
- 18.6.4 By Country
- 18.6.4.1 China
- 18.6.4.2 India
- 18.6.4.3 Japan
- 18.6.4.4 South Korea
19. Middle East & Africa Comfort Footwear Market Trends and Forecast Analysis, 2018-2028, USD Million & CAGR
- 19.1 Impact analysis of market dynamics on the Comfort Footwear Market
- 19.2 Middle East & Africa Comfort Footwear Market: Snapshot
- 19.3 Middle East & Africa Comfort Footwear Market Size, By Value, 2018-2021(USD Million)
- 19.4 Middle East & Africa Comfort Footwear Market Size, By Value, 2022-2028 (USD Million)
- 19.5 Middle East & Africa Comfort Footwear Market Trend and Forecast Analysis: Segmentation
- 19.5.1 By Footwear Type
- 19.5.2 By Sales Channel
- 19.5.3 By End-User