|
|
市場調査レポート
商品コード
1109044
サイバー保険の世界市場 - 保険の種類別 (スタンドアロン、パッケージ)・組織別・用途別・地域別・国別の分析 (2022年版):市場の考察と予測、新型コロナウイルス感染症 (COVID-19) の影響 (2022年~2027年)Global Cyber Insurance Market - Analysis By Insurance Type (Standalone, Packaged), Organization, Application, By Region, By Country (2022 Edition): Market Insights and Forecast with Impact of COVID-19 (2022-2027) |
||||||
|
|
|||||||


| サイバー保険の世界市場 - 保険の種類別 (スタンドアロン、パッケージ)・組織別・用途別・地域別・国別の分析 (2022年版):市場の考察と予測、新型コロナウイルス感染症 (COVID-19) の影響 (2022年~2027年) |
|
出版日: 2022年07月31日
発行: Azoth Analytics
ページ情報: 英文 220 Pages
納期: 即納可能
|
- 全表示
- 概要
- 図表
- 目次
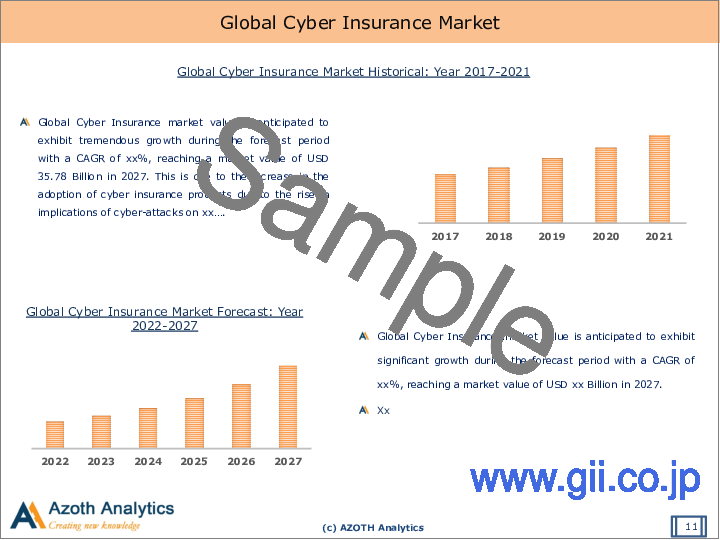
世界のサイバー保険市場は、2021年に99億8,000万米ドルと評価されました。サイバー保険は、技術の進歩に後押しされ、中小企業や大規模産業で普及が進んでいます。また、企業攻撃に関する報道が増加したことで、市場における企業のサイバー保険契約確保への意欲が高まりました。また、デジタル化、技術の急速な発展、クラウドベースのストレージシステム、ビッグデータ、IoT、人工知能(AI)のビジネスへの導入の増加は、頻繁にセキュリティ侵害にさらされており、様々な企業が市場でサイバーセキュリティ保険を採用するきっかけとなりました。
保険の種類別では、2027年にはスタンドアロン型セグメントが最大のシェアを占めると予想されます。これは、スタンドアロン型保険の多くがメディア責任保険を提供しており、名誉毀損やプライバシーの侵害、その他の不正行為を主張するクレームをカバーしているためです。さらに、スタンドアロン型保険は、事業中断、データ損失/破壊、資金移動損失など、さまざまな物的損害をカバーします。サイバー保険の世界市場では、南北アメリカが最大のシェアを占め、アジア太平洋と欧州がこれに続くと推定されます。南北アメリカは研究開発活動への投資が活発であり、それがサイバー保険技術の進歩に寄与しています。
クラウドコンピューティングは、従来のITの境界を侵食し、新しい市場を開拓し、モバイルデバイスを促進し、ユニファイドコミュニケーションを進展させるのに貢献しました。その結果、現代のサイバーセキュリティは、クラウド上の機密データを保護するために、より洗練された保険モデルを使用するよう企業に促しています。こうしたすべての要因が、サイバー保険市場の成長を後押ししています。さらに、サイバー保険市場には世界的に多数のプレーヤーが存在することが、世界的に市場の成長を促す大きな要因になると予想されます。
目次
第1章 分析の範囲・手法
第2章 戦略提言
第3章 世界サイバー保険市場:商品概要
第4章 世界サイバー保険市場:分析
- 世界サイバー保険市場:市場指標
- 市場規模 (金額ベース、2017年~2027年)
- 世界のサイバー保険市場:成長と予測
- COVID-19が世界のサイバー保険市場に与える影響
第5章 世界のサイバー保険市場:セグメント別の分析 (保険の種類別)
- 市場区分:保険の種類別
- 競合ポジショニング:保険の種類別 (2021年・2027年)
- スタンドアロン型 (単位:10億米ドル、2017年~2027年)
- パッケージ別 (単位:10億米ドル、2017年~2027年)
第6章 世界のサイバー保険市場:セグメント別の分析 (組織別)
- 市場区分:組織別
- 競合ポジショニング:組織別 (2021年・2027年)
- 大企業 (単位:10億米ドル、2017年~2027年)
- 中小企業 (単位:10億米ドル、2017年~2027年)
第7章 世界のサイバー保険市場:セグメント別の分析 (用途別)
- 市場区分:用途別
- 競合ポジショニング:用途別 (2021年・2027年)
- 医療 (単位:10億米ドル、2017年~2027年)
- IT・通信 (単位:10億米ドル、2017年~2027年)
- BFSI (単位:10億米ドル、2017年~2027年)
- その他 (単位:10億米ドル、2017年~2027年)
第8章 世界のサイバー保険市場:地域分析
- 世界のサイバー保険市場の競合ポジショニング:地域別 (2021年・2027年)
第9章 南北アメリカのサイバー保険市場の分析 (2017年~2027年)
- 南北アメリカのサイバー保険市場:市場指標
- 南北アメリカのサイバー保険市場:規模と予測 (金額ベース、2017年~2027年)
- 南北アメリカのサイバー保険市場:大手企業
- 南北アメリカのサイバー保険市場:セグメント別分析
- 南北アメリカのサイバー保険市場:保険の種類別 (スタンドアロン、パッケージ)
- 南北アメリカのサイバー保険市場:組織別 (大企業、中小企業)
- 南北アメリカのサイバー保険市場:国別分析
- 南北アメリカのサイバー保険市場:用途別 (医療、IT・通信、BFSI、その他)
- 南北アメリカのサイバー保険市場:市場機会チャート、国別
- 南北アメリカのサイバー保険市場:競合ポジショニング、国別
- 米国のサイバー保険市場
- カナダのサイバー保険市場
第10章 欧州のサイバー保険市場の分析 (2017年~2027年)
- 欧州のサイバー保険市場:市場指標
- 欧州のサイバー保険市場:規模と予測 (金額ベース、2017年~2027年)
- 欧州のサイバー保険市場:大手企業
- 欧州のサイバー保険市場:セグメント別分析
- 欧州のサイバー保険市場:保険の種類別 (スタンドアロン、パッケージ)
- 欧州のサイバー保険市場:組織別 (大企業、中小企業)
- 欧州のサイバー保険市場:用途別 (医療、IT・通信、BFSI、その他)
- 欧州のサイバー保険市場:国別分析
- 欧州のサイバー保険市場:市場機会チャート、国別
- 欧州のサイバー保険市場:競合ポジショニング、国別
- 英国のサイバー保険市場
- ドイツのサイバー保険市場
- フランスのサイバー保険市場
第11章 アジア太平洋サイバー保険市場の分析 (2017年~2027年)
- アジア太平洋のサイバー保険市場:市場指標
- アジア太平洋のサイバー保険市場:規模と予測 (金額ベース、2017年~2027年)
- アジア太平洋のサイバー保険市場:大手企業
- アジア太平洋のサイバー保険市場:セグメント別分析
- アジア太平洋のサイバー保険市場:保険の種類別 (スタンドアロン、パッケージ)
- アジア太平洋のサイバー保険市場:組織別 (大企業、中小企業)
- アジア太平洋のサイバー保険市場:用途別 (医療、IT・通信、BFSI、その他)
- アジア太平洋のサイバー保険市場:国別分析
- アジア太平洋のサイバー保険市場:市場機会チャート、国別
- アジア太平洋のサイバー保険市場:競合ポジショニング、国別
- 中国のサイバー保険市場
- 日本のサイバー保険市場
- インドのサイバー保険市場
- 韓国のサイバー保険市場
- シンガポールのサイバー保険市場
第12章 中東・アフリカのサイバー保険市場の分析 (2017年~2027年)
- 欧州のサイバー保険市場:市場指標
- 欧州のサイバー保険市場:規模と予測 (金額ベース、2017年~2027年)
- 欧州のサイバー保険市場:保険の種類別 (スタンドアロン、パッケージ)
- 欧州のサイバー保険市場:組織別 (大企業、中小企業)
- 欧州のサイバー保険市場:用途別 (医療、IT・通信、BFSI、その他)
第13章 世界のサイバー保険市場力学
- 世界のサイバー保険市場の促進要因
- 世界のサイバー保険市場の抑制要因
- 世界のサイバー保険市場の動向
第14章 市場の魅力と戦略分析
- 世界のサイバー保険市場の魅力度チャート:保険の種類別 (2027年)
- 世界のサイバー保険市場の魅力度チャート:組織別 (2027年)
- 世界のサイバー保険市場の魅力度チャート:用途別 (2027年)
- 世界のサイバー保険市場の魅力度チャート:地域別 (2027年)
第15章 競合情勢
- 近年の動向
- 世界の大手企業の市場シェア
第16章 企業プロファイル (事業内容、財務分析、事業戦略)
- Allianz Group
- AIG
- AXA XL
- AON Plc.
- Liberty Mutual
- Chubb Limited
- Beazley
- Travelers
- Axis Capital
- CNA Financial
List of Figures
List of Figures
- Figure 1: Global Internet Penetration Rate, 2021 (In %)
- Figure 2: Global Number of Smartphone shipments 2019-2021 (in billion)
- Figure 3: Average Cost of data breaches Worldwide by Industry, 2020-2021 (USD Mn)
- Figure 4: Global Internet Users, By Region, Q1 2020 (In %)
- Figure 5: Global Smartphone Penetration Rate, 2018-2020 (In %)
- Figure 6: Global Number of Smartphone users 2018-2020 (in billion)
- Figure 7: Worldwide prevalence to cyber threats, 2021
- Figure 8: Internet Users Distribution in the World (2021)
- Figure 9: Global Internet Users, By Region, March 2021 (In Million)
- Figure 10: Global Cyber Insurance Coverage, By Sector, 2021 (In %)
- Figure 11: Types of incidents covered by Cyber Insurance policies worldwide (In %)
- Figure 12: Global Cyber Insurance Market Size, By Value, 2017-2027 (USD Billion)
- Figure 13: Global Cyber Insurance Market- By Insurance Type Market Share, 2021 & 2027
- Figure 14: Global Cyber Insurance Market- By Standalone, By Value (USD Billion), 2017-2027
- Figure 15: Global Cyber Insurance Market- By Packaged, By Value (USD Billion), 2017-2027
- Figure 16: Global Cyber Insurance Market- By Organization Market Share, 2021 & 2027
- Figure 17: Global Cyber Insurance Market- By Large Enterprise, By Value (USD Billion), 2017-2027
- Figure 18: Global Cyber Insurance Market- By SME's, By Value (USD Billion), 2017-2027
- Figure 19: Global Cyber Insurance Market- By Application Market Share, 2021 & 2027
- Figure 20: Global Cyber Insurance Market- By Healthcare, By Value (USD Billion), 2017-2027
- Figure 21: Global Cyber Insurance Market- By IT & Telecom, By Value (USD Billion), 2017-2027
- Figure 22: Global Cyber Insurance Market- By BFSI, By Value (USD Billion), 2017-2027
- Figure 23: Global Cyber Insurance Market- By Others, By Value (USD Billion), 2017-2027
- Figure 24: Global Cyber Insurance Market- By Region Market Share, 2021 & 2027
- Figure 25: North America Individuals Using the Internet, 2018-2020 ( In % of Population)
- Figure 26: North America GDP Per Capita, value (USD Million), 2018-20
- Figure 27: Americas Internet Users, By Countries, 2021 (In %)
- Figure 28: Top Cyber Insurance company share in Brazil, 2021 (%)
- Figure 29: Brazil Cyber Insurance Premiums growth (BRL Million), 2019-21
- Figure 30: Americas Cyber Insurance Market Size, By Value, 2017-2027 (USD Billion)
- Figure 31: Americas Cyber Insurance Market- By Insurance Type, By Value (USD Billion), 2017-2027
- Figure 32: Americas Cyber Insurance Market- By Organization, By Value (USD Billion), 2017-2027
- Figure 33: Americas Cyber Insurance Market- By Application, By Value (USD Billion), 2017-2027
- Figure 34: Market Opportunity Chart of Americas Cyber Insurance Market- By Country, By Value (Year-2027)
- Figure 35: Americas Cyber Insurance Market- By Country Market Share, 2021 & 2027
- Figure 36: United States Cyber Insurance Market Size, By Value, 2017-2027 (USD Billion)
- Figure 37: United States Cyber Insurance Market- By Insurance Type, By Value (USD Billion), 2017-2027
- Figure 38: United States Cyber Insurance Market- By Organization, By Value (USD Billion), 2017-2027
- Figure 39 United States Cyber Insurance Market- By Application, By Value (USD Billion), 2017-2027
- Figure 40: Canada Cyber Insurance Market Size, By Value, 2017-2027 (USD Billion)
- Figure 41: Canada Cyber Insurance Market- By Insurance Type, By Value (USD Billion), 2017-2027
- Figure 42: Canada Cyber Insurance Market- By Organization, By Value (USD Billion), 2017-2027
- Figure 43: Canada Cyber Insurance Market- By Application, By Value (USD Billion), 2017-2027
- Figure 44: Internet Penetration in European Union Countries, 2020, (In %)
- Figure 45: Europe Internet Users By Age (%), 2017-2019
- Figure 46: Europe Smartphone users by countries, 2020, (In Mn)
- Figure 47: Europe Smartphone penetration by countries, 2020, (In %)
- Figure 48: Europe Cyber Insurance Market Size, By Value, 2017-2027 (USD Billion)
- Figure 49: Europe Cyber Insurance Market- By Insurance Type, By Value (USD Billion), 2017-2027
- Figure 50: Europe Cyber Insurance Market- By Organization, By Value (USD Billion), 2017-2027
- Figure 51: Europe Cyber Insurance Market- By Application, By Value (USD Billion), 2017-2027
- Figure 52: Market Opportunity Chart of Europe Cyber Insurance Market- By Country, By Value (Year-2027)
- Figure 53: Europe Cyber Insurance Market- By Country Market Share, 2021 & 2027
- Figure 54: United Kingdom Cyber Insurance Market Size, By Value, 2017-2027 (USD Billion)
- Figure 55: United Kingdom Cyber Insurance Market- By Insurance Type, By Value (USD Billion), 2017-2027
- Figure 56: United Kingdom Cyber Insurance Market- By Organization, By Value (USD Billion), 2017-2027
- Figure 57: United Kingdom Cyber Insurance Market- By Application, By Value (USD Billion), 2017-2027
- Figure 58: Germany Cyber Insurance Market Size, By Value, 2017-2027 (USD Billion)
- Figure 59: Germany Cyber Insurance Market- By Insurance Type, By Value (USD Billion), 2017-2027
- Figure 60: Germany Cyber Insurance Market- By Organization, By Value (USD Billion), 2017-2027
- Figure 61: Germany Cyber Insurance Market- By Application, By Value (USD Billion), 2017-2027
- Figure 62: France Cyber Insurance Market Size, By Value, 2017-2027 (USD Billion)
- Figure 63: France Cyber Insurance Market- By Insurance Type, By Value (USD Billion), 2017-2027
- Figure 64: France Cyber Insurance Market- By Organization, By Value (USD Billion), 2017-2027
- Figure 65: France Cyber Insurance Market- By Application, By Value (USD Billion), 2017-2027
- Figure 66: Asia Pacific Internet Penetration, 2017-2020 ( in %)
- Figure 67: East Asia Pacific Individuals Using the Internet, 2018 - 2020 ( In % of Population)
- Figure 68: Asia Pacific Internet Users, By Countries, 2021 (In Million)
- Figure 69: Asia Pacific Smartphone Users, By Countries 2019 (In Million)
- Figure 70: Asia Pacific Smartphone Penetration, By Countries, 2020 (In Million)
- Figure 71: Asia Pacific Cyber Insurance Market Size, By Value, 2017-2027 (USD Billion)
- Figure 72: Asia Pacific Cyber Insurance Market- By Insurance Type, By Value (USD Billion), 2017-2027
- Figure 73: Asia Pacific Cyber Insurance Market- By Organization, By Value (USD Billion), 2017-2027
- Figure 74: Asia Pacific Cyber Insurance Market- By Application, By Value (USD Billion), 2017-2027
- Figure 75: Market Opportunity Chart of Asia Pacific Cyber Insurance Market- By Country, By Value (Year-2027)
- Figure 76: Asia Pacific Cyber Insurance Market- By Country Market Share, 2021 & 2027
- Figure 77: China Cyber Insurance Market Size, By Value, 2017-2027 (USD Billion)
- Figure 78: China Cyber Insurance Market- By Insurance Type, By Value (USD Billion), 2017-2027
- Figure 79: China Cyber Insurance Market- By Organization, By Value (USD Billion), 2017-2027
- Figure 80: China Cyber Insurance Market- By Application, By Value (USD Billion), 2017-2027
- Figure 81: Japan Cyber Insurance Market Size, By Value, 2017-2027 (USD Billion)
- Figure 82: Japan Cyber Insurance Market- By Insurance Type, By Value (USD Billion), 2017-2027
- Figure 83: Japan Cyber Insurance Market- By Organization, By Value (USD Billion), 2017-2027
- Figure 84: Japan Cyber Insurance Market- By Application, By Value (USD Billion), 2017-2027
- Figure 85: India Cyber Insurance Market Size, By Value, 2017-2027 (USD Billion)
- Figure 86: India Cyber Insurance Market- By Insurance Type, By Value (USD Billion), 2017-2027
- Figure 87: India Cyber Insurance Market- By Organization, By Value (USD Billion), 2017-2027
- Figure 88: India Cyber Insurance Market- By Application, By Value (USD Billion), 2017-2027
- Figure 89: South Korea Cyber Insurance Market Size, By Value, 2017-2027 (USD Billion)
- Figure 90: South Korea Cyber Insurance Market- By Insurance Type, By Value (USD Billion), 2017-2027
- Figure 91: South Korea Cyber Insurance Market- By Organization, By Value (USD Billion), 2017-2027
- Figure 92: South Korea Cyber Insurance Market- By Application, By Value (USD Billion), 2017-2027
- Figure 93: Singapore Cyber Insurance Market Size, By Value, 2017-2027 (USD Billion)
- Figure 94: Singapore Cyber Insurance Market- By Insurance Type, By Value (USD Billion), 2017-2027
- Figure 95: Singapore Cyber Insurance Market- By Organization, By Value (USD Billion), 2017-2027
- Figure 96: Singapore Cyber Insurance Market- By Application, By Value (USD Billion), 2017-2027
- Figure 97: Middle East and North Africa Population (in Million), 2018-2020
- Figure 98: Middle East and North Africa, GDP Per Capita, value (USD Million), 2018-20
- Figure 99: Middle East and North Africa, Internet Penetration (% of total population), 2018-2020
- Figure 100: Middle East and Africa Cyber Insurance Market Size, By Value, 2017-2027 (USD Billion)
- Figure 101: Middle East and Africa Cyber Insurance Market- By Insurance Type, By Value (USD Billion), 2017-2027
- Figure 102: Middle East and Africa Cyber Insurance Market- By Organization, By Value (USD Billion), 2017-2027
- Figure 103: Middle East and Africa Cyber Insurance Market- By Application, By Value (USD Billion), 2017-2027
- Figure 104: Market Attractiveness Chart of Global Cyber Insurance Market- By Insurance Type (Year-2027)
- Figure 105: Market Attractiveness Chart of Global Cyber Insurance Market- By Organization (Year-2027)
- Figure 106: Market Attractiveness Chart of Global Cyber Insurance Market- By Application (Year-2027)
- Figure 107: Market Attractiveness Chart of Global Cyber Insurance Market- By Region (Year-2027)
- Figure 108: Global leading Cyber Insurance company market share (%), 2021
- Figure 109: Allianz Group Annual Sales Revenue, 2017-2021 (USD Million)
- Figure 110: Allianz Group Net Income, 2017-2021 (USD Million)
- Figure 111: Allianz Group Sales Revenue, By Business Segment (%), FY2021
- Figure 112: Allianz Group Sales Revenue, By Geographical Segment (%), FY2021
- Figure 113: AIG Annual Sales Revenue, 2017-2021 (USD Million)
- Figure 114: AIG Net Income, 2017-2021 (USD Million)
- Figure 115: AIG Sales Revenue, By Business Segment (%), FY2021
- Figure 116: AIG Sales Revenue, By Geographical Segment (%), FY2021
- Figure 117: AXA XL Annual Sales Revenue, 2017-2021 (USD Million)
- Figure 118: AXA XL Net Income, 2017-2021 (USD Million)
- Figure 119: AXA XL Sales Revenue, By Business Segment (%), FY2021
- Figure 120: AXA XL Sales Revenue, By Geographical Segment (%), FY2021
- Figure 121: AON Plc Annual Sales Revenue, 2017-2021 (USD Million)
- Figure 122: AON Plc Net Income, 2017-2021 (USD Million)
- Figure 123: AON Plc Sales Revenue, By Business Segment (%), FY2021
- Figure 124: AON Plc Sales Revenue, By Geographical Segment (%), FY2021
- Figure 125: Liberty Mutual Annual Sales Revenue, 2017-2021 (USD Million)
- Figure 126: Liberty Mutual Net Income, 2017-2021 (USD Million)
- Figure 127: Liberty Mutual Sales Revenue, By Business Segment (%), FY2021
- Figure 128: Liberty Mutual Sales Revenue, By Business Segment (%), FY2020
- Figure 129: Chubb Limited Annual Sales Revenue, 2017-2021 (USD Million)
- Figure 130: Chubb Limited Net Income, 2017-2021 (USD Million)
- Figure 131: Chubb Limited Net Premium Earned, By Business Segment (%), FY2021
- Figure 132: Chubb Limited Net Premium Earned, By Geographical Segment (%), FY2021
- Figure 133: Beazley Annual Sales Revenue, 2017-2021 (USD Million)
- Figure 134: Beazley Net Income, 2017-2021 (USD Million)
- Figure 135: Beazley Sales Revenue, By Business Segment (%), FY2021
- Figure 136: Beazley Sales Revenue, By Geographical Segment (%), FY2021
- Figure 137: Beazley Sales Revenue, By Insurance Type (%), FY2021
- Figure 138: Beazley Sales Revenue, By Premium Written by claim settlement term (%), FY2021
- Figure 139: Travelers Annual Sales Revenue, 2017-2021 (USD Million)
- Figure 140: Travelers Net Income, 2017-2021 (USD Million)
- Figure 141: Travelers Sales Revenue, By Business Segment (%), FY2021
- Figure 142: Travelers Sales Revenue, By Geographical Segment (%), FY2021
- Figure 143: Axis Capital Annual Sales Revenue, 2017-2021 (USD Million)
- Figure 144: Axis Capital Net Income, 2017-2021 (USD Million)
- Figure 145: Axis Capital Net Premium earned, By Business Segment (%), FY2021
- Figure 146: Axis Capital Gross Premium Written, By Geographical Segment (%), FY2021
- Figure 147: CNA Financial Annual Sales Revenue, 2017-2021 (USD Million)
- Figure 148: CNA Financial Net Income, 2017-2021 (USD Million)
- Figure 149: CNA Financial Net Premium earned, By Business Segment (%), FY2021
- Figure 150: CNA Financial Net Premium earned, By Business Segment (%), FY2020
List of Tables
- Table A: Top Countries by Smartphone Users (2021)
- Table B: Top U.S. Cyber Insurance Companies
Executive Summary
The Global Cyber Insurance Market was valued at USD 9.98 Billion in the year 2021. Cyber insurance is growing in popularity across small, medium, and large-scale industries, driven by technological advances. In addition, the increasing media coverage of business attacks increased the desire for businesses to secure cyber insurance policies in the market. Also, the growing adoption of digitization, rapid developments in the technologies, cloud-based storage systems, Big Data, IoT, and artificial intelligence (AI) in business are frequently exposed to security breaches which have led various firms to adopt cybersecurity insurance in the market.
Based on the Insurance Type segment, the Standalone segment is expected to hold the largest share in the Cyber Insurance market in the year 2027. This is because most of the Standalone policies provide media liability insurance, which covers claims alleging libel or slander, invasion of privacy or other wrongdoings. In addition, the Standalone policy covers various property exposures, such as business interruption, data loss/destruction, and funds transfer loss. Americas region is estimated to have the maximum share in the global Cyber Insurance market followed by APAC & Europe. Americas is capable of investing heavily in R&D activities, which in turn contributes to the advancement of cyber insurance technology in the market.
Cloud computing has eroded traditional IT boundaries, opened up new markets, promoted mobile devices, and helped to advance unified communications. As a result, modern cyber security is pushing firms to use more sophisticated insurance models to protect sensitive data on the cloud. All these factors are propelling the growth of the cyber insurance market. Further, the presence of a majority of players worldwide in the cyber insurance market is expected to be the major factor driving the growth of the market globally. Leading players like Allianz have a product like Allianz Global Corporate & Specialty (AGCS) that has a long experience in cyber insurance, protecting organizations against cyber-crime and digital threats.
Scope of the Report
- The report presents the analysis of the Cyber Insurance market for the historical period of 2017-2021 and the forecast period of 2022-2027.
- The report analyses the Cyber Insurance Market by Value (USD Billion).
- The report analyses the Cyber Insurance Market by Insurance Type (Standalone, Packaged).
- The report analyses the Cyber Insurance Market by Organization (Large Enterprises, SMEs).
- The report analyses the Cyber Insurance Market by Application (Healthcare, IT & Telecom, BFSI, Others).
- The Global Cyber Insurance Market has been analysed by countries (United States, Canada, Brazil, United Kingdom, Germany, France, China, Japan, India, South Korea, Singapore).
- Also, the attractiveness of the market has been presented by region, by Insurance Type, by organization and by application.
- Also, the major opportunities, trends, drivers and challenges of the industry has been analysed in the report.
- The report tracks competitive developments, strategies, mergers and acquisitions and new product development. The companies analysed in the report include Allianz Group, AIG, AXA XL, AON Plc., Liberty Mutual, Chubb Limited, Beazley, Travelers, Axis Capital, CNA Financial.
Key Target Audience
- Cyber Insurance Industry Vendors
- Consulting and Advisory Firms
- Government and Policy Makers
- Regulatory Authorities
Table of Contents
1. Report Scope and Methodology
- 1.1 Scope of the Report
- 1.2 Research Methodology
- 1.3 Executive Summary
2. Strategic Recommendations
3. Global Cyber Insurance Market: Product Overview
4. Global Cyber Insurance Market: An Analysis
- 4.1 Global Cyber Insurance Market: Market Indicators
- 4.2 Market Size, By Value, 2017-2027
- 4.3 Global Cyber Insurance Market: Growth and Forecast
- 4.4 Impact of COVID-19 on Global Cyber Insurance Market
5. Global Cyber Insurance Market: Segment Analysis
- 5.1 Global Cyber Insurance Market Segmentation, By Insurance Type
- 5.2 Competitive Positioning of Cyber Insurance Market: By Insurance Type (2021 & 2027)
- 5.3 By Standalone, By Value (USD Billion), 2017-2027
- 5.4 By Packaged, By Value (USD Billion), 2017-2027
6. Global Cyber Insurance Market: Segment Analysis
- 6.1 Global Cyber Insurance Market Segmentation, By Organization
- 6.2 Competitive Positioning of Global Cyber Insurance Market, By Organization (2021 & 2027)
- 6.3 By Large Enterprise, By Value (USD Billion), 2017-2027
- 6.4 By SMEs, By Value (USD Billion), 2017-2027
7. Global Cyber Insurance Market: Segment Analysis
- 7.1 Global Cyber Insurance Market Segmentation, By Application
- 7.2 Competitive Positioning of Global Cyber Insurance Market, By Application (2021 & 2027)
- 7.3 By Healthcare, By Value (USD Billion), 2017-2027
- 7.4 By IT & Telecom, By Value (USD Billion), 2017-2027
- 7.5 By BFSI, By Value (USD Billion), 2017-2027
- 7.6 By Others, By Value (USD Billion), 2017-2027
8. Global Cyber Insurance Market: Regional Analysis
- 8.1 Competitive Positioning of Global Cyber Insurance Market: By Region (2021 & 2027)
9. Americas Cyber Insurance Market: An Analysis (2017-2027)
- 9.1 Americas Cyber Insurance Market: Market Indicators
- 9.2 Americas Cyber Insurance Market- Size and Forecast, By Value (2017-2027)
- 9.3 Americas Cyber Insurance Market: Prominent Companies
- 9.4 Americas Cyber Insurance Market: Segment Analysis
- 9.5 Americas Cyber Insurance Market By Insurance Type, (Standalone, Packaged), By Value
- 9.6 Americas Cyber Insurance Market By Organization, (Large Enterprise, SMEs), By Value
- 9.7 Americas Cyber Insurance Market By Application, (Healthcare, IT & Telecom, BFSI, Others), By Value
- 9.8 Americas Cyber Insurance Market: Country Analysis
- 9.9 Market Opportunity Chart of Americas Cyber Insurance Market- By Country, By Value (Year-2027)
- 9.10 Competitive Positioning of Americas Cyber Insurance Market- By Country
- 9.11 United States Cyber Insurance Market: Size and Forecast, By Value (2017-2027)
- 9.12 United States Cyber Insurance Market By Insurance Type, By Organization, By Application, By Value (2017-2027)
- 9.13 Canada Cyber Insurance Market: Size and Forecast, By Value (2017-2027)
- 9.14 Canada Cyber Insurance Market By Insurance Type, By Organization, By Application, By Value (2017-2027)
10. Europe Cyber Insurance Market: An Analysis (2017-2027)
- 10.1 Europe Cyber Insurance Market: Market Indicators
- 10.2 Europe Cyber Insurance Market- Size and Forecast, By Value (2017-2027)
- 10.3 Europe Cyber Insurance Market: Prominent Companies
- 10.4 Europe Cyber Insurance Market: Segment Analysis
- 10.5 Europe Cyber Insurance Market By Insurance Type, (Standalone, Packaged), By Value
- 10.6 Europe Cyber Insurance Market By Organization, (Large Enterprise, SMEs), By Value
- 10.7 Europe Cyber Insurance Market By Application, (Healthcare, IT & Telecom, BFSI, Others), By Value
- 10.8 Europe Cyber Insurance Market: Country Analysis
- 10.9 Market Opportunity Chart of Europe Cyber Insurance Market- By Country, By Value (Year-2027)
- 10.10 Competitive Positioning of Europe Cyber Insurance Market- By Country
- 10.11 United Kingdom Cyber Insurance Market: Size and Forecast, By Value (2017-2027)
- 10.12 United Kingdom Cyber Insurance Market By Insurance Type, By Organization, By Application, By Value (2017-2027)
- 10.13 Germany Cyber Insurance Market: Size and Forecast, By Value (2017-2027)
- 10.14 Germany Cyber Insurance Market By Insurance Type, By Organization, By Application, By Value (2017-2027)
- 10.15 France Cyber Insurance Market: Size and Forecast, By Value (2017-2027)
- 10.16 France Cyber Insurance Market By Insurance Type, By Organization, By Application, By Value (2017-2027)
11. Asia Pacific Cyber Insurance Market: An Analysis (2017-2027)
- 11.1 Asia Pacific Cyber Insurance Market: Market Indicators
- 11.2 Asia Pacific Cyber Insurance Market- Size and Forecast, By Value (2017-2027)
- 11.3 Asia Pacific Cyber Insurance Market: Prominent Companies
- 11.4 Asia Pacific Cyber Insurance Market: Segment Analysis
- 11.5 Asia Pacific Cyber Insurance Market By Insurance Type, (Standalone, Packaged), By Value
- 11.6 Asia Pacific Cyber Insurance Market By Organization, (Large Enterprise, SMEs), By Value
- 11.7 Asia Pacific Cyber Insurance Market By Application, (Healthcare, IT & Telecom, BFSI, Others), By Value
- 11.8 Asia Pacific Cyber Insurance Market: Country Analysis
- 11.9 Market Opportunity Chart of Asia Pacific Cyber Insurance Market- By Country, By Value (Year-2027)
- 11.10 Competitive Positioning of Asia Pacific Cyber Insurance Market- By Country
- 11.11 China Cyber Insurance Market: Size and Forecast, By Value (2017-2027)
- 11.12 China Cyber Insurance Market By Insurance Type, By Organization, By Application, By Value (2017-2027)
- 11.13 Japan Cyber Insurance Market: Size and Forecast, By Value (2017-2027)
- 11.14 Japan Cyber Insurance Market By Insurance Type, By Organization, By Application, By Value (2017-2027)
- 11.15 India Cyber Insurance Market: Size and Forecast, By Value (2017-2027)
- 11.16 India Cyber Insurance Market By Insurance Type, By Organization, By Application, By Value (2017-2027)
- 11.17 South Korea Cyber Insurance Market: Size and Forecast, By Value (2017-2027)
- 11.18 South Korea Cyber Insurance Market By Insurance Type, By Organization, By Application, By Value (2017-2027)
- 11.19 Singapore Cyber Insurance Market: Size and Forecast, By Value (2017-2027)
- 11.20 Singapore Cyber Insurance Market By Insurance Type, By Organization, By Application, By Value (2017-2027)
12. Middle East and Africa Cyber Insurance Market: An Analysis (2017-2027)
- 12.1 Middle East and Africa Cyber Insurance Market: Market Indicators
- 12.2 Middle East and Africa Cyber Insurance Market- Size and Forecast, By Value (2017-2027)
- 12.3 Middle East and Africa Cyber Insurance Market By Insurance Type, (Standalone, Packaged), By Value
- 12.4 Middle East and Africa Cyber Insurance Market By Organization, (Large Enterprise, SME's), By Value
- 12.5 Middle East and Africa Cyber Insurance Market By Application, (Healthcare, IT & Telecom, BFSI, Others), By Value
13. Global Cyber Insurance Market Dynamics
- 13.1 Global Cyber Insurance Market Drivers
- 13.2 Global Cyber Insurance Market Restraints
- 13.3 Global Cyber Insurance Market Trends
14. Market Attractiveness and Strategic Analysis
- 14.1 Market Attractiveness Chart of Global Cyber Insurance Market - By Insurance Type (2027)
- 14.2 Market Attractiveness Chart of Global Cyber Insurance Market - By Organization (2027)
- 14.3 Market Attractiveness Chart of Global Cyber Insurance Market - By Application (2027)
- 14.4 Market Attractiveness Chart of Global Cyber Insurance Market - By Region (2027)
15. Competitive Landscape
- 15.1 Recent Developments
- 15.2 Market Share of global leading companies
16. Company Profiles (Business Description, Financial Analysis, Business Strategy)
- 16.1 Allianz Group
- 16.2 AIG
- 16.3 AXA XL
- 16.4 AON Plc.
- 16.5 Liberty Mutual
- 16.6 Chubb Limited
- 16.7 Beazley
- 16.8 Travelers
- 16.9 Axis Capital
- 16.10 CNA Financial