|
|
市場調査レポート
商品コード
1109043
1-ブテンの世界市場:生産プロセス別、用途別、地域別、国別の分析 (2022年版):市場の考察・予測、新型コロナウイルス感染症 (COVID-19) の影響 (2017年~2027年)Global 1-Butene Market: Analysis By Production Process, Application, By Region, By Country (2022 Edition): Market Insights and Forecast with Impact of COVID-19 (2017-2027) |
||||||
|
|
|||||||


| 1-ブテンの世界市場:生産プロセス別、用途別、地域別、国別の分析 (2022年版):市場の考察・予測、新型コロナウイルス感染症 (COVID-19) の影響 (2017年~2027年) |
|
出版日: 2022年07月31日
発行: Azoth Analytics
ページ情報: 英文 190 Pages
納期: 即納可能
|
- 全表示
- 概要
- 図表
- 目次
エグゼクティブサマリー
世界の1-ブテンの市場は2027年に58億米ドルに達すると評価されています。地域別では、アジア太平洋が最も高いシェアを獲得しています。
1-ブテン市場は、使い捨ての防護服やPPEキットの販売増加、医薬品包装への使用などにより、巨大な将来性を持っています。
ブテン-1市場は、日常生活での数多くのプラスチック使用によるポリエチレンの需要増加などの要因によって牽引されると予想されます。また、ブテン-1はLDPE (低密度ポリエチレン) の製造に使用されており、HDPEが予測期間を通してブテン-1市場を牽引すると予想されます。
目次
第1章 分析の範囲・手法
第2章 戦略提言
第3章 世界の1-ブテン市場:製品概要
第4章 世界の1-ブテン市場:分析
- 市場規模 (金額ベース、2017年~2027年)
- 世界の1-ブテン市場 (数量ベース)
- 世界の1-ブテン市場:輸入額
- 世界の1-ブテン市場:輸出額
- 世界の1-ブテン市場:輸入量
- 世界の1-ブテン市場:輸出量
- 世界の1-ブテン市場:成長率と予測
- 1-ブテン市場に対するCOVID-19の影響
第5章 世界の1-ブテン市場:生産プロセス別の分析
- 競争シナリオ:生産プロセス別
- ブタン脱水素:市場規模と予測 (2017年~2027年)
- クルードC4の分離:市場規模と予測 (2017年~2027年)
- エチレン二量化:市場規模と予測 (2017年~2027年)
第6章 世界の1-ブテン市場:用途別の内訳
- 競合シナリオ:用途別 (2021年・2027年)
- ブタジエン:市場規模と予測 (2017年~2027年)
- 無水マレイン酸:市場規模と予測 (2017年~2027年)
- ポリエチレン/ポリプロピレン共重合体:市場規模と予測 (2017年~2027年)
- ポリエチレン:市場規模と予測 (2017年~2027年)
- ポリエチレン・LLDPE:市場規模と予測 (2017年~2027年)
- ポリエチレン・HDPE:市場規模と予測 (2017年~2027年)
- 二級ブチルアルコール/メチルエチルケトン:市場規模と予測 (2017年~2027年)
第7章 世界の1-ブテン市場:地域別の分析
- 世界の1-ブテン市場の競合シナリオ:地域別 (2021年・2027年)
第8章 北米の1-ブテン市場:分析 (2017年~2027年)
- 北米の1-ブテン市場:市場規模と予測 (金額ベース、2017年~2027年)
- 北米の1-ブテン市場 (数量ベース)
- 北米の1-ブテン市場:主要企業
- 市場区分:生産プロセス別 (ブタン脱水素、クルードC4分離、エチレン二量化)
- 市場区分:用途別 (ブタジエン、無水マレイン酸、ポリエチレン/ポリプロピレン共重合体、ポリエチレン、二級ブチルアルコール/メチルエチルケトン)
- 北米の1-ブテン市場:国別分析
- 北米の1-ブテン市場の市場機会チャート:国別 (金額ベース、2027年)
- 北米の1-ブテン市場の競合シナリオ:国別 (2021年・2027年)
- 米国の1-ブテン市場
- カナダの1-ブテン市場
第9章 欧州の1-ブテン市場:分析 (2017年~2027年)
- 欧州の1-ブテン市場:市場規模と予測 (金額ベース、2017年~2027年)
- 欧州の1-ブテン市場 (数量ベース)
- 欧州の1-ブテン市場:主要企業
- 市場区分:生産プロセス別 (ブタン脱水素、クルードC4分離、エチレン二量化)
- 市場区分:用途別 (ブタジエン、無水マレイン酸、ポリエチレン/ポリプロピレン共重合体、ポリエチレン、二級ブチルアルコール/メチルエチルケトン)
- 欧州の1-ブテン市場:国別分析
- 欧州の1-ブテン市場の市場機会チャート:国別 (金額ベース、2027年)
- 欧州の1-ブテン市場の競合シナリオ:国別 (2021年・2027年)
- ドイツの1-ブテン市場
- フランスの1-ブテン市場
- 英国の1-ブテン市場
- イタリアの1-ブテン市場
第10章 アジア太平洋の1-ブテン市場:分析 (2017年~2027年)
- アジア太平洋の1-ブテン市場:市場規模と予測 (金額ベース、2017年~2027年)
- アジア太平洋の1-ブテン市場 (数量ベース)
- アジア太平洋の1-ブテン市場:主要企業
- 市場区分:生産プロセス別 (ブタン脱水素、クルードC4分離、エチレン二量化)
- 市場区分:用途別 (ブタジエン、無水マレイン酸、ポリエチレン/ポリプロピレン共重合体、ポリエチレン、二級ブチルアルコール/メチルエチルケトン)
- アジア太平洋の1-ブテン市場:国別分析
- アジア太平洋の1-ブテン市場の市場機会チャート:国別 (金額ベース、2027年)
- アジア太平洋の1-ブテン市場の競合シナリオ:国別 (2021年・2027年)
- 中国の1-ブテン市場
- インドの1-ブテン市場
- 日本の1-ブテン市場
- 韓国の1-ブテン市場
第11章 ラテンアメリカ・中東・アフリカの1-ブテン市場:分析 (2017年~2027年)
- ラテンアメリカ・中東・アフリカの1-ブテン市場:市場規模と予測 (金額ベース、2017年~2027年)
- ラテンアメリカ・中東・アフリカの1-ブテン市場 (数量ベース)
第12章 世界の1-ブテンの市場力学
- 世界の1-ブテン市場の促進要因
- 世界の1-ブテン市場の抑制要因
- 世界の1-ブテン市場動向
第13章 市場の魅力
- 世界の1-ブテン市場の市場魅力チャート:生産プロセス別 (2027年)
- 世界の1-ブテン市場の市場魅力チャート:アプリケーション別 (2027年)
- 世界の1-ブテン市場の市場魅力チャート:地域別 (2027年)
第14章 競合情勢
- 主要な1-ブテン企業の市場シェア
第15章 製品のベンチマーク
- 主要な1-ブテン企業の製品ベンチマーク
第16章 企業プロファイル概要 (事業内容、財務分析、事業戦略)
- Evonik Industries
- BASF SE
- Linde plc.
- Exxon Mobil Corporation
- Lyondellbasell Industries N.V.
- China National Petroleum Corporation
- SABIC
- Mitsui Chemicals Group.
- Shell Chemicals
- Chevron Phillips Chemical
List of Figures
List of Figures
- Figure 1: Global Polyethylene demand, 2017-2021 (Million Tons)
- Figure 2: Global Polyethylene Production capacity, 2017-2021 (Million Tons)
- Figure 3: Global environmental concern of consumers, 2021, (in percentages)
- Figure 4: Global production volume of high density polyethylene resin, 2016 & 2022 (metric tons)
- Figure 5: Global Gasoline Consumption (Thousand barrels daily), 2015-2019
- Figure 6: Global Plastic Production (Million Tones), 2017-2019
- Figure 7: Global 1-Butene Market Size, By Value, 2017-2027 (USD Million)
- Figure 8: Volume Sales of 1-Butene (MT), 2021-2027
- Figure 9: Volume Sales of 1-Butene, By Application (MT), 2021-2027
- Figure 10: Volume Sales of 1-Butene, By Production Process (MT), 2021-2027
- Figure 11: Global 1-Butene Market- By Production Process Market Share, 2021 & 2027
- Figure 12: Global 1-Butene Market- By Production Process, By Butane Dehydrogenation, By Value (USD Million), 2017-2027
- Figure 13: Global 1-Butene Market- By Production Process, By Separation of Crude C4, By Value (USD Million), 2017-2027
- Figure 14: Global 1-Butene Market- By Production Process, By Ethylene Dimerization, By Value (USD Million), 2017-2027
- Figure 15: Global 1-Butene Market- By Application Share, 2021 & 2027
- Figure 16: Global 1-Butene Market- By Application, By Butadiene (USD Million), 2017-2027
- Figure 17: Global 1-Butene Market- By Application, By Maleic Anhydride (USD Million), 2017-2027
- Figure 18: Global 1-Butene Market- By Application, By Polyethylene/Polypropylene co-polymers (USD Million), 2017-2027
- Figure 19: Global 1-Butene Market- By Application, By Polyethylene (USD Million), 2017-2027
- Figure 20: Global 1-Butene Market- By Application, By Polyethylene, By LLDPE (USD Million), 2017-2027
- Figure 21: Global 1-Butene Market- By Application, By Polyethylene, By HDPE (USD Million), 2017-2027
- Figure 22: Global 1-Butene Market- By Application, By Secondary Butyl alcohol/Methyl Ethyl Ketone (USD Million), 2017-2027
- Figure 23: Global 1-Butene Market- By Region Market Share, 2021 & 2027
- Figure 24: North America packaging market by material, 2020
- Figure 25: North America Export value of maleic anhydride (USD Million), 2016-2020
- Figure 26: North America Export value of butene and isomers thereof (USD Million), 2016-2020
- Figure 27: North America packaging material growth rate, 2000-2020
- Figure 28: North America 1-Butene Market Size, By Value, 2017-2027 (USD Million)
- Figure 29: Volume Sales of 1-Butene (MT), 2021-2027
- Figure 30: Volume Sales of 1-Butene, By Application (MT), 2021-2027
- Figure 31: Volume Sales of 1-Butene, By Production Process (MT), 2021-2027
- Figure 32: North America 1-Butene Market - By Production Process, By Value (USD Million), 2017-2027
- Figure 33: North America 1-Butene Market - By Application, By Value (USD Million), 2017-2027
- Figure 34: Market Opportunity Chart of North America 1-Butene Market- By Country, By Value (Year-2027)
- Figure 35: North America 1-Butene Market- By Country Market Share, 2021 & 2027
- Figure 36: United States polyethylene production, 2016-2020 (1000 metric tons)
- Figure 37: U.S packaging market by segments, 2020 (%)
- Figure 38: United States high density polyethylene production, 2016-2020 (1000 metric tons)
- Figure 39 United States 1-Butene Market Size, By Value, 2017-2027 (USD Million)
- Figure 40: United States 1-Butene Market - By Production Process, By Value (USD Million), 2017-2027
- Figure 41: United States 1-Butene Market - By Application, By Value (USD Million), 2017-2027
- Figure 42: Canada Import value of butene and isomers thereof (USD Million), 2016-2020
- Figure 43: Canada proportion of total Imports of butene and isomers thereof (%), 2016-2020
- Figure 44: Canada Export value of maleic anhydride (USD Million), 2016-2020
- Figure 45: Canada import value of maleic anhydride (USD Million), 2016-2020
- Figure 46: Canada 1-Butene Market Size, By Value, 2017-2027 (USD Million)
- Figure 47: Canada 1-Butene Market - By Production Process, By Value (USD Million), 2017-2027
- Figure 48: Canada 1-Butene Market - By Application, By Value (USD Million), 2017-2027
- Figure 49: European Union Carbon dioxide emissions (million metric tons of CO2), 2016-2020
- Figure 50: Annual production of plastics in Europe, 2016-2020 (million metric tons)
- Figure 51: Annual demand of plastics in Europe by type, 2016-2020 (Mt)
- Figure 52: Europe packaging market value (Billion USD), 2020 & 2026 (estimated)
- Figure 53: Europe 1-Butene Market Size, By Value, 2017-2027 (USD Million)
- Figure 54: Volume Sales of 1-Butene (MT), 2021-2027
- Figure 55: Volume Sales of 1-Butene, By Application (MT), 2021-2027
- Figure 56: Volume Sales of 1-Butene, By Production Process (MT), 2021-2027
- Figure 57: Europe 1-Butene Market - By Production Process, By Value (USD Million), 2017-2027
- Figure 58: Europe 1-Butene Market - By Application, By Value (USD Million), 2017-2027
- Figure 59: Market Opportunity Chart of Europe 1-Butene Market- By Country, By Value (Year-2027)
- Figure 60: Europe 1-Butene Market- By Country Market Share, 2021 & 2027
- Figure 61: Germany Number of enterprises in the manufacture of plastics products, 2016-2020
- Figure 62: Germany production volume of general rubber goods (thousand metric tons), 2016-2020
- Figure 63: Germany Plastic consumption by sectors (%), 2021
- Figure 64: Germany 1-Butene Market Size, By Value, 2017-2027 (USD Million)
- Figure 65: Germany 1-Butene Market - By Production Process, By Value (USD Million), 2017-2027
- Figure 66: Germany 1-Butene Market - By Application, By Value (USD Million), 2017-2027
- Figure 67: France industry revenue of packaging activities, 2016-2021
- Figure 68: France export value of Methyl Ethyl Ketone(USD million), 2016-2020
- Figure 69: France Plastic consumption by different sectors (%), 2021
- Figure 70: France 1-Butene Market Size, By Value, 2017-2027 (USD Million)
- Figure 71: France 1-Butene Market - By Production Process, By Value (USD Million), 2017-2027
- Figure 72: France 1-Butene Market - By Application, By Value (USD Million), 2017-2027
- Figure 73: United Kingdom export value of maleic anhydride(USD Thousand), 2016-2020
- Figure 74: United Kingdom export value of Methyl Ethyl Ketone(USD million), 2016-2020
- Figure 75: EU-UK exports of food and drinks, 2020, (in %)
- Figure 76: United Kingdom plastic consumption by application, 2021
- Figure 77: United Kingdom 1-Butene Market Size, By Value, 2017-2027 (USD Million)
- Figure 78: United Kingdom 1-Butene Market - By Production Process, By Value (USD Million), 2017-2027
- Figure 79: United Kingdom 1-Butene Market - By Application, By Value (USD Million), 2017-2027
- Figure 80: Italy export value of butene and isomers thereof (USD Million), 2016-2020
- Figure 81: Italy import value of butene and isomers thereof (USD Million), 2016-2020
- Figure 82: Italy Import value of butadiene rubber (USD Million), 2016-2020
- Figure 83: Italy export value of butadiene rubber (USD Million), 2016-2020
- Figure 84: Italy 1-Butene Market Size, By Value, 2017-2027 (USD Million)
- Figure 85: Italy 1-Butene Market - By Production Process, By Value (USD Million), 2017-2027
- Figure 86: Italy 1-Butene Market - By Application, By Value (USD Million), 2017-2027
- Figure 87: Asia Pacific Import value of butene and isomers thereof (USD Million), 2016-2020
- Figure 88: Asia Pacific Export value of Methyl Ethyl Ketone (USD Million), 2016-2020
- Figure 89: Asia Pacific Import value of Maleic Anhydride (USD Million), 2016-2020
- Figure 90: Asia Pacific Export value of Maleic Anhydride (USD Million), 2016-2020
- Figure 91: Asia Pacific 1-Butene Market Size, By Value, 2017-2027 (USD Million)
- Figure 92: Volume Sales of 1-Butene (MT), 2021-2027
- Figure 93: Volume Sales of 1-Butene, By Application (MT), 2021-2027
- Figure 94: Volume Sales of 1-Butene, By Production Process (MT), 2021-2027
- Figure 95: Asia Pacific 1-Butene Market - By Production Process, By Value (USD Million), 2017-2027
- Figure 96: Asia Pacific 1-Butene Market - By Application, By Value (USD Million), 2017-2027
- Figure 97: Market Opportunity Chart of APAC 1-Butene Market- By Country, By Value (Year-2027)
- Figure 98: APAC 1-Butene Market- By Country Market Share, 2021 & 2027
- Figure 99: China LDPE Imports (Millions of tones), 2019-2022
- Figure 100: China food and beverages export destinations, (in %), 2020
- Figure 101: China food and beverages production segment, (in %), 2020
- Figure 102: China LLDPE Imports (Millions of tones), 2019-2022
- Figure 103: China HDPE Imports (Millions of tones), 2019-2022
- Figure 104: China HDPE Demand (Millions of tones), 2019-2022
- Figure 105: China LDPE Demand (Millions of tones), 2019-2022
- Figure 106: China LLDPE Demand (Millions of tones), 2019-2022
- Figure 107: China 1-Butene Market Size, By Value, 2017-2027 (USD Million)
- Figure 108: China 1-Butene Market - By Production Process, By Value (USD Million), 2017-2027
- Figure 109: China 1-Butene Market - By Application, By Value (USD Million), 2017-2027
- Figure 110: India share of plastics across different applications (%), 2020
- Figure 111: India food and beverages top export destinations, (in %), 2019-20
- Figure 112: India share of polyethylene across different applications (%), 2020
- Figure 113: India Maleic Anhydride production volume (1000 metric tons), 2018-2021
- Figure 114: India 1-Butene Market Size, By Value, 2017-2027 (USD Million)
- Figure 115: India 1-Butene Market - By Production Process, By Value (USD Million), 2017-2027
- Figure 116: India 1-Butene Market - By Application, By Value (USD Million), 2017-2027
- Figure 117: Japan sales of Polyethylene material (Thousand Ton) , 2021
- Figure 118: Japan production volume of butane and butylene (million tons), 2016-2021
- Figure 119: Japan Motor Vehicle Production (Million), 2017-2021
- Figure 120: Japan 1-Butene Market Size, By Value, 2017-2027 (USD Million)
- Figure 121: Japan 1-Butene Market - By Production Process, By Value (USD Million), 2017-2027
- Figure 122: Japan 1-Butene Market - By Application, By Value (USD Million), 2017-2027
- Figure 123: South Korea Domestic demand of plastic raw materials, by material type (1000 tons) , 2020
- Figure 124: South Korea Market size of packaging (in trillion South Korean won), 2010 to 2020
- Figure 125: South Korea butadiene exports (MT), 2020 & 2021
- Figure 126: South Korea 1-Butene Market Size, By Value, 2017-2027 (USD Million)
- Figure 127: South Korea 1-Butene Market - By Production Process, By Value (USD Million), 2017-2027
- Figure 128: South Korea 1-Butene Market - By Application, By Value (USD Million), 2017-2027
- Figure 129: Latin America and Middle East & Africa 1-Butene Market Size, By Value, 2017-2027 (USD Million)
- Figure 130: Volume Sales of 1-Butene (MT), 2021-2027
- Figure 131: Volume Sales of 1-Butene, By Application (MT), 2021-2027
- Figure 132: Volume Sales of 1-Butene, By Production Process (MT), 2021-2027
- Figure 133: Market Attractiveness Chart of Global 1-Butene Market- By Production Process (Year-2027)
- Figure 134: Market Attractiveness Chart of Global 1-Butene Market- By Application (Year-2027)
- Figure 135: Market Attractiveness Chart of Global 1-Butene Market- By Region (Year-2027)
- Figure 136: Global leading 1-Butene Companies Market Share (%), 2021
- Figure 137: Evonik Industries Annual Sales Revenue, 2017-2021 (USD Million)
- Figure 138: Evonik Industries Net Income, 2017-2021 (USD Million)
- Figure 139: Evonik Industries Sales Revenue, By Business Segment (%), FY2021
- Figure 140: Evonik Industries Sales Revenue, By Geographical Segment (%), FY2021
- Figure 141: BASF SE Sales, 2017-2021 (USD Million)
- Figure 142: BASF SE Net Income, 2017-2021 (USD Million)
- Figure 143: BASF SE Net Sales, By Business Segment (%), FY2021
- Figure 144: BASF SE Net Sales, By Geographical Segment (%), FY2021
- Figure 145: Linde plc Sales, 2018-2021 (USD Million)
- Figure 146: Linde plc Net Income, 2018-2021 (USD Million)
- Figure 147: Linde plc, By Business Segment (%), FY2021
- Figure 148: Linde plc, By Distribution Mode (%), FY2021
- Figure 149: Linde plc, By End Markets (%), FY2021
- Figure 150: Exxon Mobil Corporation Annual Sales Revenue, 2017-2021 (USD Million)
- Figure 151: Exxon Mobil Corporation Net Income, 2017-2021 (USD Million)
- Figure 152: Exxon Mobil Corporation Sales Revenue, By Business Segment (%), FY2021
- Figure 153: Exxon Mobil Corporation Sales Revenue, By Geographical Segment (%), FY2021
- Figure 154: LyondellBasell Industries N.V. Annual Sales Revenue, 2017-2021 (USD Million)
- Figure 155: LyondellBasell Industries N.V. Net Income, 2017-2021 (USD Million)
- Figure 156: LyondellBasell Industries N.V. Sales Revenue, By Focus Industries (%), FY2021
- Figure 157: LyondellBasell Industries N.V. Sales Revenue, By Geographical Segment (%), FY2021
- Figure 158: China National Petroleum Corporation Annual Sales Revenue (USD Million), 2018-2020
- Figure 159: China National Petroleum Corporation Net Income (USD Million), 2018-2020
- Figure 160: China National Petroleum Corporation, Oil production (mmt), 2018-2020
- Figure 161: China National Petroleum Corporation Gas production (bcm), 2018-2020
- Figure 162: China National Petroleum Corporation Refining and Chemicals (mmt), 2018-2020
- Figure 163: SABIC Annual Sales Revenue, 2016-2020 (USD Million)
- Figure 164: SABIC, Net Income, 2016-2020 (USD Million)
- Figure 165: SABIC Sales Revenue, By Business Segment (%), FY2020
- Figure 166: SABIC Sales Revenue, By Geographical Segment (%), FY2020
- Figure 167: Mitsui Chemicals Inc. Annual Sales Revenue, 2017-2021 (USD Million)
- Figure 168: Mitsui Chemicals Inc., Operating Income, 2017-2021 (USD Million)
- Figure 169: Mitsui Chemicals Inc. Sales Revenue, By Business Segment (%), FY2021
- Figure 170: Mitsui Chemicals Inc. Sales Revenue, By Geographical Segment (%), FY2021
- Figure 171: Shell Chemicals Annual Sales Revenue, 2017-2021 (USD Million)
- Figure 172: Shell Chemicals, Net Income, 2017-2021 (USD Million)
- Figure 173: Shell Chemicals Sales Revenue, By Business Segment (%), FY2021
- Figure 174: Shell Chemicals Sales Revenue, By Geographical Segment (%), FY2021
- Figure 175: Chevron Phillips Chemical Annual Sales Revenue, 2017-2021 (USD Million)
- Figure 176: Chevron Phillips Chemical, Net Income, 2017-2021 (USD Million)
- Figure 177: Chevron Phillips Chemical Sales Revenue, By Business Segment (%), FY2021
- Figure 178: Chevron Phillips Chemical Sales Revenue, By Geographical Segment (%), FY2021
List of Tables
- Table A: Import Value (USD Thousand) HS Code: 290123 Butene "butylene" and isomers thereof
- Table B: Export Value (USD Thousand) HS Code: 290123 Butene "butylene" and isomers thereof
- Table C: Import Volume (Tons) HS Code: 290123 Butene "butylene" and isomers thereof
- Table D: Export Volume (Tons) HS Code: 290123 Butene "butylene" and isomers thereof
- Table E: Product Benchmarking of Leading 1-Butene Companies
Executive Summary
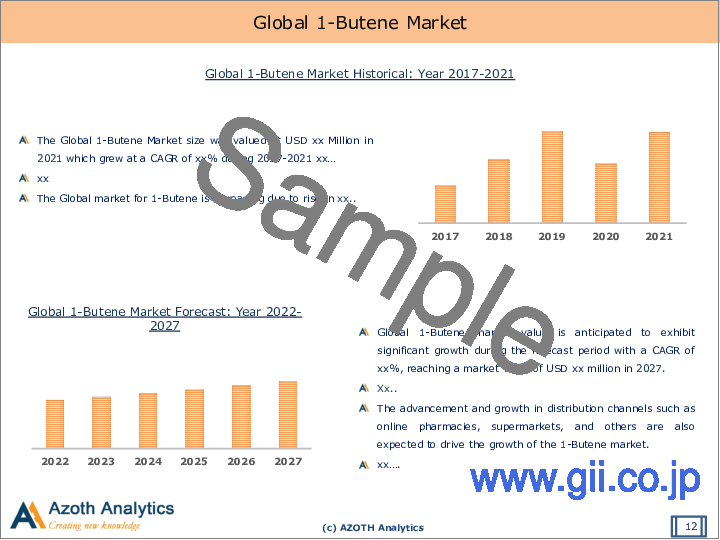
The global 1-Butene Market is valued at USD 5.80 Billion in the year 2027 with the Asia Pacific leading the regional market share. The chemical compound 1-butene, often known as 1-butylene, is one of the butane's isomers (butylene) and is a readily condensable colourless liquid from a colourless gas.
The 1-butene market has seen enormous prospects due to rising sales of disposable protective clothing, PPE kits, and uses in pharmaceutical packaging. The growth of the medical and pharmaceutical industries encourages small and medium-sized businesses to compete with established market leaders to raise sales. Improved disposable income and changing lifestyles have influenced consumption patterns, resulting in increased demand for packaged beverages and other FMCG products. E-commerce platforms also cater to all liquid-packaged consumer goods. Personal care, cosmetics, over-the-counter medications, topical solutions, and household care products are all included. Due to the rising demand for PPE kits from customers worldwide, 1-butene market manufacturers have gained from the coronavirus pandemic.
The Butene-1 market is anticipated to be driven by factors like the rising demand for polythene due to the numerous plastics uses in daily lives. Additionally, butene-1 is used to make LDPE, and it is anticipated that HDPE will drive the Butene-1 market throughout the forecast period.
Scope of the Report
- The report presents the analysis of the Global 1-Butene Market for the historical period of 2017-2021 and the forecast period of 2022-2027.
- The report analyses the Global 1-Butene Market by Value (USD Million).
- The report analyses the Global 1-Butene Market by Production Process (Butane Dehydrogenation, Separation of Crude C4, Ethylene Dimerization)
- The report analyses the Global 1-Butene Market by Application (Butadiene, Maleic Anhydride, Polyethylene/Polypropylene co-polymers, Polyethylene (LLDPE and HDPE), Secondary Butyl alcohol/Methyl Ethyl Ketone)
- The Global 1-Butene Market has been analysed By Region and By Country.
- The key insights of the report have been presented through the frameworks of the attractiveness of the market has been presented by region, by Production Process, by Application.
- Also, the major opportunities, trends, drivers and challenges of the industry have been analysed in the report.
- The report tracks competitive developments, strategies, mergers and acquisitions and new product development. The companies analysed in the report include Evonik Industries, BASF SE, Linde plc. Exxon Mobil Corporation, Lyondellbasell Industries N.V., China National Petroleum Corporation, SABIC, Mitsui Chemicals Group, Shell Chemicals, Chevron Phillips Chemical.
Key Target Audience
- Chemical Companies
- Consulting and Advisory Firms
- Government and Policy Makers
- Regulatory Authorities
Table of Contents
1. Report Scope and Methodology
- 1.1 Scope of the Report
- 1.2 Research Methodology
- 1.3 Executive Summary
2. Strategic Recommendations
3. Global 1-Butene Market: Product Overview
4. Global 1-Butene Market: An Analysis
- 4.1 Market Size, By Value, 2017-2027
- 4.2 Global 1-Butene Market: By Volume
- 4.3 Global 1-Butene Market: Import By Value
- 4.4 Global 1-Butene Market: Export By Value
- 4.5 Global 1-Butene Market: Import By Volume
- 4.6 Global 1-Butene Market: Export By Volume
- 4.7 Global 1-Butene Market: Growth & Forecast
- 4.8 Impact of COVID-19 on 1-Butene Market
5. Global 1-Butene Market: Analysis By Production Process
- 5.1 Competitive Scenario of Global 1-Butene Market: By Production Process (2021 & 2027)
- 5.2 By Butane Dehydrogenation - Market Size and Forecast (2017-2027)
- 5.3 By Separation of Crude C4 - Market Size and Forecast (2017-2027)
- 5.4 By Ethylene Dimerization - Market Size and Forecast (2017-2027)
6. Global 1-Butene Market: Segmentation By Application
- 6.1 Competitive Scenario of Global 1-Butene Market: By Application (2021 & 2027)
- 6.2 By Butadiene - Market Size and Forecast (2017-2027)
- 6.3 By Maleic Anhydride - Market Size and Forecast (2017-2027)
- 6.4 By Polyethylene/Polypropylene co-polymers - Market Size and Forecast (2017-2027)
- 6.5 By Polyethylene - Market Size and Forecast (2017-2027)
- 6.6 By Polyethylene, By LLDPE - Market Size and Forecast (2017-2027)
- 6.7 By Polyethylene, By HDPE - Market Size and Forecast (2017-2027)
- 6.8 By Secondary Butyl alcohol/Methyl Ethyl Ketone - Market Size and Forecast (2017-2027)
7. Global 1-Butene Market: Regional Analysis
- 7.1 Competitive Scenario of Global 1-Butene Market: By Region (2021 & 2027)
8 North America 1-Butene Market: An Analysis (2017-2027)
- 8.1 North America 1-Butene Market by value: Size and Forecast (2017-2027)
- 8.2 North America 1-Butene Market: By Volume
- 8.3 North America 1-Butene Market: Prominent Companies
- 8.4 Market Segmentation By Production Process (Butane Dehydrogenation, Separation of Crude C4, Ethylene Dimerization)
- 8.5 Market Segmentation By Application (Butadiene, Maleic Anhydride, Polyethylene/Polypropylene Co-Polymers, Polyethylene, Secondary Butyl Alcohol/ Methyl Ethyl Ketone)
- 8.6 North America 1-Butene Market: Country Analysis
- 8.7 Market Opportunity Chart of North America 1-Butene Market - By Country, By Value (Year-2027)
- 8.8 Competitive Scenario of North America 1-Butene Market - By Country (2021 & 2027)
- 8.9 United States 1-Butene Market: Size and Forecast (2017-2027)
- 8.10 United States 1-Butene Market Segmentation By Production Process, By Application (2017-2027)
- 8.11 Canada 1-Butene Market: Size and Forecast (2017-2027)
- 8.12 Canada 1-Butene Market Segmentation By Production Process, By Application (2017-2027)
9 Europe 1-Butene Market: An Analysis (2017-2027)
- 9.1 Europe 1-Butene Market by value: Size and Forecast (2017-2027)
- 9.2 Europe 1-Butene Market: By Volume
- 9.3 Europe 1-Butene Market: Prominent Companies
- 9.4 Market Segmentation By Production Process (Butane Dehydrogenation, Separation of Crude C4, Ethylene Dimerization)
- 9.5 Market Segmentation By Application (Butadiene, Maleic Anhydride, Polyethylene/Polypropylene Co-Polymers, Polyethylene, Secondary Butyl Alcohol/ Methyl Ethyl Ketone)
- 9.6 Europe 1-Butene Market: Country Analysis
- 9.7 Market Opportunity Chart of Europe 1-Butene Market - By Country, By Value (Year-2027)
- 9.8 Competitive Scenario of Europe 1-Butene Market - By Country (2021 & 2027)
- 9.9 Germany 1-Butene Market: Size and Forecast (2017-2027)
- 9.10 Germany 1-Butene Market Segmentation By Production Process, By Application (2017-2027)
- 9.11 France 1-Butene Market: Size and Forecast (2017-2027)
- 9.12 France 1-Butene Market Segmentation By Type, By Application, By End User (2017-2027)
- 9.13 United Kingdom 1-Butene Market: Size and Forecast (2017-2027)
- 9.14 United Kingdom 1-Butene Market Segmentation By Type, By Application, By End User (2017-2027)
- 9.15 Italy 1-Butene Market: Size and Forecast (2017-2027)
- 9.16 Italy 1-Butene Market Segmentation By Type, By Application, By End User (2017-2027)
10 Asia Pacific 1-Butene Market: An Analysis (2017-2027)
- 10.1 Asia Pacific 1-Butene Market by value: Size and Forecast (2017-2027)
- 10.2 Asia Pacific 1-Butene Market: By Volume
- 10.3 Asia Pacific 1-Butene Market: Prominent Companies
- 10.4 Market Segmentation By Production Process (Butane Dehydrogenation, Separation of Crude C4, Ethylene Dimerization)
- 10.5 Market Segmentation By Application (Butadiene, Maleic Anhydride, Polyethylene/Polypropylene Co-Polymers, Polyethylene, Secondary Butyl Alcohol/ Methyl Ethyl Ketone)
- 10.6 Asia Pacific 1-Butene Market: Country Analysis
- 10.7 Market Opportunity Chart of Asia Pacific 1-Butene Market - By Country, By Value (Year-2027)
- 10.8 Competitive Scenario of Asia Pacific 1-Butene Market - By Country (2021 & 2027)
- 10.9 China 1-Butene Market: Size and Forecast (2017-2027)
- 10.10 China 1-Butene Market Segmentation By Production Process, By Application (2017-2027)
- 10.11 India 1-Butene Market: Size and Forecast (2017-2027)
- 10.12 India 1-Butene Market Segmentation By Production Process, By Application (2017-2027)
- 10.13 Japan 1-Butene Market: Size and Forecast (2017-2027)
- 10.14 Japan 1-Butene Market Segmentation By Type, By Application, By End User (2017-2027)
- 10.15 South Korea 1-Butene Market: Size and Forecast (2017-2027)
- 10.16 South Korea 1-Butene Market Segmentation By Type, By Application, By End User (2017-2027)
11. LAMEA 1-Butene Market
- 11.1 LAMEA 1-Butene Market by value: Size and Forecast (2017-2027)
- 11.2 LAMEA 1-Butene Market: By Volume
12. Global 1-Butene Market Dynamics
- 12.1 Global 1-Butene Market Drivers
- 12.2 Global 1-Butene Market Restraints
- 12.3 Global 1-Butene Market Trends
13. Market Attractiveness
- 13.1 Market Attractiveness Chart of Global 1-Butene Market - By Production Process (Year 2027)
- 13.2 Market Attractiveness Chart of Global 1-Butene Market - By Application (Year 2027)
- 13.3 Market Attractiveness Chart of Global 1-Butene Market - By Region (Year 2027)
14. Competitive Landscape
- 14.1 Market Share of Leading 1-Butene Companies
15. Product Benchmarking
- 15.1 Product Benchmarking of Leading 1-Butene Companies
16. Company Profiles (Business Description, Financial Analysis, Business Strategy)
- 16.1 Evonik Industries
- 16.2 BASF SE
- 16.3 Linde plc.
- 16.4 Exxon Mobil Corporation
- 16.5 Lyondellbasell Industries N.V.
- 16.6 China National Petroleum Corporation
- 16.7 SABIC
- 16.8 Mitsui Chemicals Group.
- 16.9 Shell Chemicals
- 16.10 Chevron Phillips Chemical