|
|
市場調査レポート
商品コード
1073169
伸び計の世界市場 (2022年):製品・チャンバーテストプロセス・用途・地域・国別の分析・予測・COVID-19の影響 (2022-2027年)Global Extensometer Market (Value, Volume) - Analysis By Product, Chamber Testing Process, Application, By Region, By Country (2022 Edition): Market Insights and Forecast with Impact of COVID-19 (2022-2027) |
||||||
|
|
|||||||


| 伸び計の世界市場 (2022年):製品・チャンバーテストプロセス・用途・地域・国別の分析・予測・COVID-19の影響 (2022-2027年) |
|
出版日: 2022年04月30日
発行: Azoth Analytics
ページ情報: 英文 210 Pages
納期: 即納可能
|
- 全表示
- 概要
- 図表
- 目次
世界の伸び計の市場規模は2021年に14億637万米ドルの規模を示しています。地域別では、アジア太平洋地域が市場シェアをリードしています。
伸び計は、降伏強度や引張強度、伸び、ひずみ率などを測定するさまざまな引張試験で使用されるため、業界の成長を牽引しています。また、急速な都市化と都市人口の増加に伴い、世界的に製造拠点が増加し、市場を押し上げています。さらに、天然資源の需要に伴い、さまざまな調査・計測用途の鉱山機械の需要も増加すると推測されています。
当レポートでは、世界の伸び計の市場を調査し、市場および製品の概要、市場成長への各種影響因子の分析、市場規模の推移・予測、各種区分・地域/主要国別の内訳、競合環境、市場シェア、主要企業のプロファイルなどをまとめています。
目次
第1章 調査範囲・調査手法
第2章 戦略的推奨事項
第3章 世界の伸び計市場:製品の展望
第4章 世界の伸び計市場:市場規模・予測
第5章 世界の伸び計市場:製品・チャンバーテストプロセス・用途別
- 競合上の位置付け:製品別
- 市場規模・予測:非接触
- 市場規模・予測:接触
- 競合上の位置付け:チャンバーテストプロセス別
- 市場規模・予測:自動ひずみ管理
- 市場規模・予測:手動
- 競合上の位置付け:用途別
- 市場規模・予測:金属
- 市場規模・予測:プラスチック
- 市場規模・予測:先端材料
- 市場規模・予測:生体材料
- 市場規模・予測:複合材料
- 市場規模・予測:その他
第6章 世界の伸び計市場:地域分析
- 競合上の位置付け:地域別
第7章 北米の伸び計市場の分析
第8章 欧州の伸び計市場の分析
第9章 アジア太平洋の伸び計市場の分析
第10章 ラテンアメリカの伸び計市場の分析
第11章 中東・アフリカの伸び計市場の分析
第12章 世界の伸び計市場:市場力学
- 促進要因
- 抑制要因
- 動向
第13章 市場の魅力
- 製品別
- チャンバーテストプロセス別
- 用途別
- 地域別
第14章 競合情勢
- 市場シェア分析
- ポーターファイブフォース分析
第15章 企業の分析
- Mechatronics Inc.
- Tinius Olsen
- Zwick Roell Group
- 3R
- Shenzhen Wance Testing Machine Co., Ltd.
- Instron
- LIMESS Messtechnik und Software GmbH
- Quantum Geotechnic
- Reliant Technology
- Devco
List of Figures
List of Figures
- Figure 1: Global Extensometer Market Size, By Value (USD Millions), By Volume (e000 Units), 2017-2027
- Figure 2: Global Industry (Including Construction), value added (annual growth), 2014-19
- Figure 3: GDP per capita (Current USD), 2020
- Figure 4: Global urban population (% of total population), 2017-2020
- Figure 5: Global manufacturing value added (% of GDP), 2017-2020
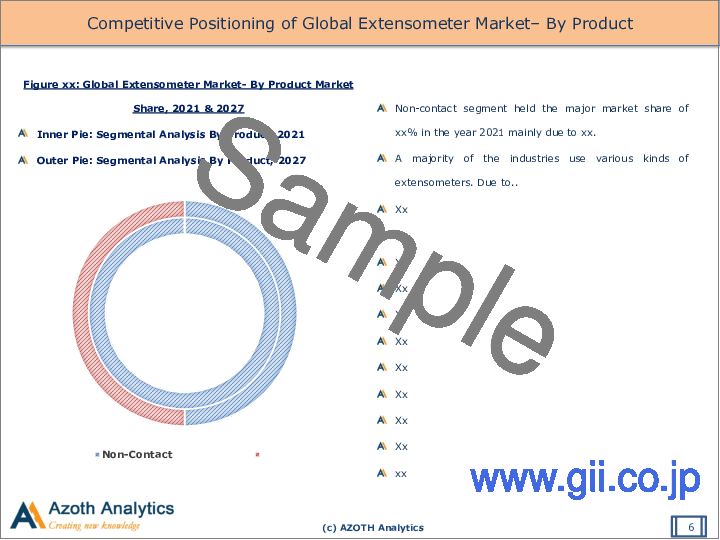
- Figure 6: Global Extensometer Market- By Product Market Share, 2021 & 2027
- Figure 7: Global Extensometer Market- By Non-Contact, By Value (USD Million), 2017-2027
- Figure 8: Global Extensometer Market: By Non-Contact, By Sub-type, By Value (USD Million), 2017-2027
- Figure 9: Global Extensometer Market: By Contact, By Value (USD Million), 2017-2027
- Figure 10: Global Extensometer Market: By Contact, By Sub-type, By Value (USD Million), 2017-2027
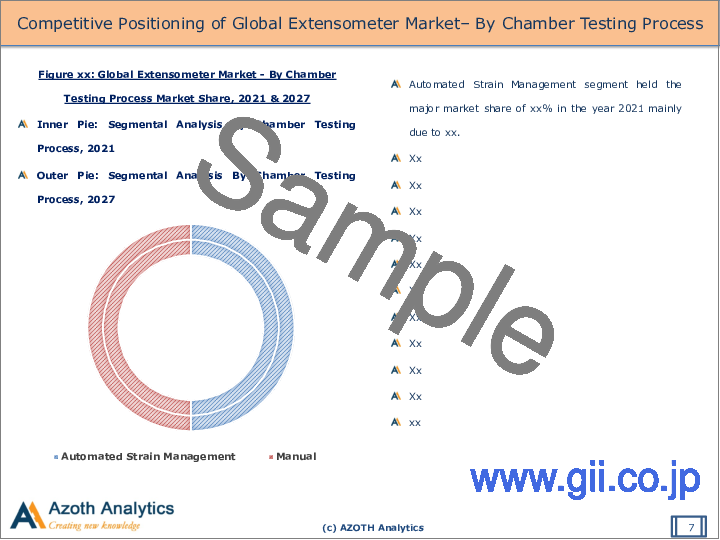
- Figure 11: Global Extensometer Market - By Chamber Testing Process Market Share, 2021 & 2027
- Figure 12: Global Extensometer Market- By Automated Strain Management, By Value (USD Million), 2017-2027
- Figure 13: Global Extensometer Market- By Manual, By Value (USD Million), 2017-2027
- Figure 14: Global Extensometer Market - By Application Market Share, 2021 & 2027
- Figure 15: Global Extensometer Market- By Metals, By Value (USD Million), 2017-2027
- Figure 16: Global Extensometer Market- By Plastics, By Value (USD Million), 2017-2027
- Figure 17: Global Extensometer Market- By Advance Materials, By Value (USD Million), 2017-2027
- Figure 18: Global Extensometer Market- By Bio Materials, By Value (USD Million), 2017-2027
- Figure 19: Global Extensometer Market- By Composites, By Value (USD Million), 2017-2027
- Figure 20: Global Extensometer Market- By Others, By Value (USD Million), 2017-2027
- Figure 21: Global Extensometer Market- By Region Market Share, 2021 & 2027
- Figure 22: North America Extensometer Market Size, By Value (USD Million), By Volume (e000 units), 2017-2027
- Figure 23: North America Industry (Including Construction), value added (annual growth), 2014-19
- Figure 24: North America GDP per capita (Current USD), 2017-2020
- Figure 25: North America urban population (% of total population), 2017-2020
- Figure 26: North America manufacturing value added (% of GDP), 2017-2020
- Figure 27: North America Extensometer Market- By Product, By Value (USD Million), By Volume (e000 units), 2017-2027
- Figure 28: North America Extensometer Market- By Non-Contact, By Value (USD Million), By Volume (e000 units), 2017-2027
- Figure 29: North America Extensometer Market- By Contact, By Value (USD Million), By Volume (e000 units), 2017-2027
- Figure 30: North America Extensometer Market- By Chamber Testing Process, By Value (USD Million), 2017-2027
- Figure 31: North America Extensometer Market- By Application, By Value (USD Million), 2017-2027
- Figure 32: Market Opportunity Chart of North America Extensometer Market- By Country, By Value (Year-2027)
- Figure 33: North America Extensometer Market- By Country Market Share, 2021 & 2027
- Figure 34: United States Extensometer Market Size, By Value (USD Million), By Volume (e000 Units), 2017-2027
- Figure 35: United States Industry (Including Construction), value added (annual growth), 2014-19
- Figure 36: United States GDP per capita (Current USD), 2017-2020
- Figure 37: United States urban population (% of total population), 2017-2020
- Figure 38: United States manufacturing value added (% of GDP), 2016-2019
- Figure 39: United States Extensometer Market- By Product, By Value (USD Million), By Volume (e000 units), 2017-2027
- Figure 40: United States Extensometer Market- By Non-Contact, By Value (USD Million), By Volume (e000 units), 2017-2027
- Figure 41: United States Extensometer Market- By Contact, By Value (USD Million), By Volume (e000 units), 2017-2027
- Figure 42: United States Extensometer Market- By Chamber Testing Process, By Value (USD Million), 2017-2027
- Figure 43: United States Extensometer Market- By Application, By Value (USD Million), 2017-2027
- Figure 44: Canada Extensometer Market Size, By Value, By Volume (e000 units), 2017-2027 (USD Million)
- Figure 45: Canada Industry (Including Construction), value added (annual growth), 2015-2020
- Figure 46: Canada GDP per capita (Current USD), 2017-2020
- Figure 47: Canada urban population (% of total population), 2017-2020
- Figure 48: Canada manufacturing value added (% of GDP), 2015-2018
- Figure 49: Canada Extensometer Market- By Product, By Value (USD Million), By Volume (e000 units), 2017-2027
- Figure 50: Canada Extensometer Market- By Non-Contact, By Value (USD Million), By Volume (e000 units), 2017-2027
- Figure 51: Canada Extensometer Market- By Contact, By Value (USD Million), By Volume (e000 units), 2017-2027
- Figure 52: Canada Extensometer Market- By Chamber Testing Process, By Value (USD Million), 2017-2027
- Figure 53: Canada Extensometer Market- By Application, By Value (USD Million), 2017-2027
- Figure 54: Europe Extensometer Market Size, By Value, By Volume (e000 units), 2017-2027 (USD Million)
- Figure 55: Europe Industry (Including Construction), value added (annual growth), 2015-2020
- Figure 56: Europe GDP per capita (Current USD), 2017-2020
- Figure 57: Europe urban population (% of total population), 2017-2020
- Figure 58: Europe manufacturing value added (% of GDP), 2016-2019
- Figure 59: Europe Extensometer Market- By Product, By Value (USD Million), By Volume (e000 units), 2017-2027
- Figure 60: Europe Extensometer Market- By Non-Contact, By Value (USD Million), By Volume (e000 units), 2017-2027
- Figure 61: Europe Extensometer Market- By Contact, By Value (USD Million), By Volume (e000 units), 2017-2027
- Figure 62: Europe Extensometer Market- By Chamber Testing Process, By Value (USD Million), 2017-2027
- Figure 63: Europe Extensometer Market- By Application, By Value (USD Million), 2017-2027
- Figure 64: Market Opportunity Chart of Europe Extensometer Market- By Country, By Value (Year-2027)
- Figure 65: Europe Extensometer Market- By Country Market Share, 2021 & 2027
- Figure 66: Germany Extensometer Market Size, By Value, By Volume (e000 units), 2017-2027 (USD Million)
- Figure 67: Germany Industry (Including Construction), value added (annual growth), 2015-2020
- Figure 68: Germany GDP per capita (Current USD), 2017-2020
- Figure 69: Germany urban population (% of total population), 2017-2020
- Figure 70: Germany manufacturing value added (% of GDP), 2016-2020
- Figure 71: Germany Extensometer Market- By Product, By Value (USD Million), By Volume (e000 units), 2017-2027
- Figure 72: Germany Extensometer Market- By Non-Contact, By Value (USD Million), By Volume (e000 units), 2017-2027
- Figure 73: Germany Extensometer Market- By Contact, By Value (USD Million), By Volume (e000 units), 2017-2027
- Figure 74: Germany Extensometer Market- By Chamber Testing Process, By Value (USD Million), 2017-2027
- Figure 75: Germany Extensometer Market- By Application, By Value (USD Million), 2017-2027
- Figure 76: United Kingdom Extensometer Market Size, By Value, By Volume (e000 units), 2017-2027 (USD Million)
- Figure 77: United Kingdom Industry (Including Construction), value added (annual growth), 2015-2020
- Figure 78: United Kingdom GDP per capita (Current USD), 2017-2020
- Figure 79: United Kingdom urban population (% of total population), 2017-2020
- Figure 80: United Kingdom manufacturing value added (% of GDP), 2016-2020
- Figure 81: United Kingdom Extensometer Market- By Product, By Value (USD Million), By Volume (e000 units), 2017-2027
- Figure 82: United Kingdom Extensometer Market- By Non-Contact, By Value (USD Million), By Volume (e000 units), 2017-2027
- Figure 83: United Kingdom Extensometer Market- By Contact, By Value (USD Million), By Volume (e000 units), 2017-2027
- Figure 84: United Kingdom Extensometer Market- By Chamber Testing Process, By Value (USD Million), 2017-2027
- Figure 85: United Kingdom Extensometer Market- By Application, By Value (USD Million), 2017-2027
- Figure 86: France Extensometer Market Size, By Value, By Volume (e000 units), 2017-2027 (USD Million)
- Figure 87: France Industry (Including Construction), value added (annual growth), 2015-2020
- Figure 88: France GDP per capita (Current USD), 2017-2020
- Figure 89: France urban population (% of total population), 2017-2020
- Figure 90: France manufacturing value added (% of GDP), 2016-2020
- Figure 91: France Extensometer Market- By Product, By Value (USD Million), By Volume (e000 units), 2017-2027
- Figure 92: France Extensometer Market- By Non-Contact, By Value (USD Million), By Volume (e000 units), 2017-2027
- Figure 93: France Extensometer Market- By Contact, By Value (USD Million), By Volume (e000 units), 2017-2027
- Figure 94: France Extensometer Market- By Chamber Testing Process, By Value (USD Million), 2017-2027
- Figure 95: France Extensometer Market- By Application, By Value (USD Million), 2017-2027
- Figure 96: Italy Extensometer Market Size, By Value, By Volume (e000 units), 2017-2027 (USD Million)
- Figure 97: Italy Industry (Including Construction), value added (annual growth), 2015-2020
- Figure 98: Italy GDP per capita (Current USD), 2017-2020
- Figure 99: Italy urban population (% of total population), 2017-2020
- Figure 100: Italy manufacturing value added (% of GDP), 2016-2020
- Figure 101: Italy Extensometer Market- By Product, By Value (USD Million), By Volume (e000 units), 2017-2027
- Figure 102: Italy Extensometer Market- By Non-Contact, By Value (USD Million), By Volume (e000 units), 2017-2027
- Figure 103: Italy Extensometer Market- By Contact, By Value (USD Million), By Volume (e000 units), 2017-2027
- Figure 104: Italy Extensometer Market- By Chamber Testing Process, By Value (USD Million), 2017-2027
- Figure 105: Italy Extensometer Market- By Application, By Value (USD Million), 2017-2027
- Figure 106: Asia Pacific Extensometer Market Size, By Value, By Volume (e000 units), 2017-2027 (USD Million)
- Figure 107: Asia Pacific Industry (Including Construction), value added (annual growth), 2015-2020
- Figure 108: Asia Pacific GDP per capita (Current USD), 2017-2020
- Figure 109: Asia Pacific urban population (% of total population), 2017-2020
- Figure 110: Asia Pacific manufacturing value added (% of GDP), 2016-2020
- Figure 111: Asia Pacific Extensometer Market- By Product, By Value (USD Million), By Volume (e000 units), 2017-2027
- Figure 112: Asia Pacific Extensometer Market- By Non-Contact, By Value (USD Million), By Volume (e000 units), 2017-2027
- Figure 113: Asia Pacific Extensometer Market- By Contact, By Value (USD Million), By Volume (e000 units), 2017-2027
- Figure 114: Asia Pacific Extensometer Market- By Chamber Testing Process, By Value (USD Million), 2017-2027
- Figure 115: Asia Pacific Extensometer Market- By Application, By Value (USD Million), 2017-2027
- Figure 116: Market Opportunity Chart of APAC Extensometer Market- By Country, By Value (Year-2027)
- Figure 117: APAC Extensometer Market- By Country Market Share, 2021 & 2027
- Figure 118: China Extensometer Market Size, By Value, By Volume (e000 units), 2017-2027 (USD Million)
- Figure 119: China Industry (Including Construction), value added (annual growth), 2015-2020
- Figure 120: China GDP per capita (Current USD), 2017-2020
- Figure 121: China urban population (% of total population), 2017-2020
- Figure 122: China manufacturing value added (% of GDP), 2016-2020
- Figure 123: China Extensometer Market- By Product, By Value (USD Million), By Volume (e000 units), 2017-2027
- Figure 124: China Extensometer Market- By Non-Contact, By Value (USD Million), By Volume (e000 units), 2017-2027
- Figure 125: China Extensometer Market- By Contact, By Value (USD Million), By Volume (e000 units), 2017-2027
- Figure 126: China Extensometer Market- By Chamber Testing Process, By Value (USD Million), 2017-2027
- Figure 127: China Extensometer Market- By Application, By Value (USD Million), 2017-2027
- Figure 128: Japan Extensometer Market Size, By Value, By Volume (e000 units), 2017-2027 (USD Million)
- Figure 129: Japan Industry (Including Construction), value added (annual growth), 2015-2020
- Figure 130: Japan GDP per capita (Current USD), 2017-2020
- Figure 131: Japan urban population (% of total population), 2017-2020
- Figure 132: Japan manufacturing value added (% of GDP), 2016-2020
- Figure 133: Japan Extensometer Market- By Product, By Value (USD Million), By Volume (e000 units), 2017-2027
- Figure 134: Japan Extensometer Market- By Non-Contact, By Value (USD Million), By Volume (e000 units), 2017-2027
- Figure 135: Japan Extensometer Market- By Contact, By Value (USD Million), By Volume (e000 units), 2017-2027
- Figure 136: Japan Extensometer Market- By Chamber Testing Process, By Value (USD Million), 2017-2027
- Figure 137: Japan Extensometer Market- By Application, By Value (USD Million), 2017-2027
- Figure 138: India Extensometer Market Size, By Value, By Volume (e000 units), 2017-2027 (USD Million)
- Figure 139: India Industry (Including Construction), value added (annual growth), 2015-2020
- Figure 140: India GDP per capita (Current USD), 2017-2020
- Figure 141: India urban population (% of total population), 2017-2020
- Figure 142: India manufacturing value added (% of GDP), 2016-2020
- Figure 143: India Extensometer Market- By Product, By Value (USD Million), By Volume (e000 units), 2017-2027
- Figure 144: India Extensometer Market- By Non-Contact, By Value (USD Million), By Volume (e000 units), 2017-2027
- Figure 145: India Extensometer Market- By Contact, By Value (USD Million), By Volume (e000 units), 2017-2027
- Figure 146: India Extensometer Market- By Chamber Testing Process, By Value (USD Million), 2017-2027
- Figure 147: India Extensometer Market- By Application, By Value (USD Million), 2017-2027
- Figure 148: South Korea Extensometer Market Size, By Value, By Volume (e000 units), 2017-2027 (USD Million)
- Figure 149: South Korea Industry (Including Construction), value added (% of GDP), 2015-2020
- Figure 150: South Korea GDP per capita (Current USD), 2017-2020
- Figure 151: South Korea urban population (% of total population), 2017-2020
- Figure 152: South Korea manufacturing value added (% of GDP), 2016-2020
- Figure 153: South Korea Extensometer Market- By Product, By Value (USD Million), By Volume (e000 units), 2017-2027
- Figure 154: South Korea Extensometer Market- By Non-Contact, By Value (USD Million), By Volume (e000 units), 2017-2027
- Figure 155: South Korea Extensometer Market- By Contact, By Value (USD Million), By Volume (e000 units), 2017-2027
- Figure 156: South Korea Extensometer Market- By Chamber Testing Process, By Value (USD Million), 2017-2027
- Figure 157: South Korea Extensometer Market- By Application, By Value (USD Million), 2017-2027
- Figure 158: Latin America Extensometer Market Size, By Value, By Volume (e000 units), 2017-2027 (USD Million)
- Figure 159: Middle East & Africa Extensometer Market Size, By Value, By Volume (e000 units), 2017-2027 (USD Million)
- Figure 160: Market Attractiveness Chart of Global Extensometer Market- By Product (Year-2027)
- Figure 161: Market Attractiveness Chart of Global Extensometer Market- By Chamber Testing Process (Year-2027)
- Figure 162: Market Attractiveness Chart of Global Extensometer Market- By Application (Year-2027)
- Figure 163: Market Attractiveness Chart of Global Extensometer Market- By Region (Year-2027)
- Figure 164: Global Extensometer Market company market share (%), 2020
Executive Summary
According to Azoth Analytics research report, the Global Extensometer Market was valued at USD 1406.37 Million in the year 2021 with the Asia Pacific region leading the regional market share. The extensometer market is primarily driven by the growth of the industry due to its usage in a variety of tensile tests which can be used to determine the yield and tensile strength, elongation, as well as strain ratio. Moreover, their wide usage in a variety of industries such as the geotechnical environment for various mining fields is pushing the growth of the market for extensometers. Moreover, with rapid urbanization and an increase in urban population, there has been a growth in manufacturing hubs worldwide pushing the market for extensometers globally. Additionally, the demand for natural resources is estimated to increase the demand for mining equipment for various survey and measurement applications.
The covid-19 had a massive impact on the global Extensometer market. There has been an overall lockdown in various industries such as the mining and construction sectors which have been affected due to disruptions caused by COVID-19. All these led to a substantial reduction in the market growth of extensometer. However, as the world bounced back after the lockdown, there is an anticipation of increased demand for extensometer.
Scope of the Report
- The report analyses the Extensometer Market by Volume (Million Units).
- The report analyses the Extensometer Market by Value (USD Million).
- The report presents the analysis of the Extensometer Market for the historical period of 2017-2021 and the forecast period of 2022-2027.
- The report analyses the Extensometer Market Analysis By Product (Non-Contact (Laser and Video) and Contact (Sensor Arm and Clip On).
- The report analyses the Extensometer Market By Chamber Testing Process (Automated Strain Management and Manual)
- The report analyses the Extensometer Market By Application (Metals, Plastics, Advance Materials, Bio Materials, Composites and Others)
- The Global Extensometer Market has been analysed By Region (North America, Europe, Asia Pacific, Latin America and Middle East and Africa).
- The Global Extensometer Market has been analysed By Country (United States, Canada, Germany, United Kingdom, France, Italy, China, Japan, India and South Korea).
- The attractiveness of the market has been presented By Product, By Chamber Testing Process, By Application and By Region.
- Also, the major opportunities, trends, drivers and challenges of the industry have been analysed in the report.
- The companies analysed in the report include Mechatronics Inc., Tinius Olsen, Zwick Roell Group, 3R, Shenzhen Wance Testing Machine Co., Ltd., Instron, LIMESS Messtechnik und Software GmbH, Quantum Geotechnic, Reliant Technology and Devco
Key Target Audience
- Extensometer Manufacturers
- Consulting and Advisory Firms
- Government and Policy Makers
- Regulatory Authorities
Table of Contents
1. Report Scope and Methodology
- 1.1 Scope of the Report
- 1.2 Research Methodology
- 1.3 Executive Summary
2. Strategic Recommendations
3. Global Extensometer Market: Product Outlook
4. Global Extensometer Market: Size and Forecast
- 4.1 Global Extensometer Market Size, By Value, By Volume, 2017-2027
5. Global Extensometer Market Segmentation - By Product, By Chamber Testing Process, By Application
- 5.1 Competitive Positioning of Global Extensometer Market: By Product
- 5.1.1 Non-Contact - Market Size and Forecast (2017-2027)
- 5.1.1.1 Laser - Market Size and Forecast (2017-2027)
- 5.1.1.2 Video - Market Size and Forecast (2017-2027)
- 5.1.2 Contact - Market Size and Forecast (2017-2027)
- 5.1.2.1 Sensor Arm - Market Size and Forecast (2017-2027)
- 5.1.2.2 Clip-On - Market Size and Forecast (2017-2027)
- 5.1.1 Non-Contact - Market Size and Forecast (2017-2027)
- 5.2 Competitive Positioning of Global Extensometer Market: By Chamber Testing Process
- 5.2.1 Automated Strain Management - Market Size and Forecast (2017-2027)
- 5.2.2 Manual - Market Size and Forecast (2017-2027)
- 5.3 Competitive Positioning of Global Extensometer Market: By Application
- 5.3.1 Metals - Market Size and Forecast (2017-2027)
- 5.3.2 Plastics - Market Size and Forecast (2017-2027)
- 5.3.3 Advance Materials - Market Size and Forecast (2017-2027)
- 5.3.4 Bio Materials - Market Size and Forecast (2017-2027)
- 5.3.5 Composites - Market Size and Forecast (2017-2027)
- 5.3.6 Others - Market Size and Forecast (2017-2027)
6. Global Extensometer Market: Regional Analysis
- 6.1 Competitive Positioning of Global Extensometer Market: By Region
7. North America Extensometer Market: An Analysis (2017-2027)
- 7.1 North America Extensometer Market: Size and Forecast (2017-2027), By Value, By Volume
- 7.2 North America Extensometer Market - Prominent Companies
- 7.3 Market Segmentation By Product (Non-Contact (Laser and Video) and Contact (Sensor Arm and Clip On))
- 7.4 Market Segmentation By Chamber Testing Process (Automated Strain Management and Manual)
- 7.5 Market Segmentation By Application (Metals, Plastics, Advance Materials, Bio Materials, Composites and Others)
- 7.6 North America Extensometer Market: Country Analysis
- 7.7 Market Opportunity Chart of North America Extensometer Market - By Country, By Value, 2027
- 7.8 Competitive Positioning of North America Extensometer Market: By Country
- 7.9 United States Extensometer Market: Size and Forecast (2017-2027), By Value, By Volume
- 7.10 United States Extensometer Market Segmentation - (By Product, By Chamber Testing Process, By Application)
- 7.11 Canada Extensometer Market: Size and Forecast (2017-2027), By Value, By Volume
- 7.12 Canada Extensometer Market Segmentation - (By Product, By Chamber Testing Process, By Application)
8. Europe Extensometer Market: An Analysis (2017-2027)
- 8.1 Europe Extensometer Market: Size and Forecast (2017-2027), By Value, By Volume
- 8.2 Market Segmentation By Product (Non-Contact (Laser and Video) and Contact (Sensor Arm and Clip-On))
- 8.3 Market Segmentation By Chamber Testing Process (Automated Strain Management and Manual)
- 8.4 Market Segmentation By Application (Metals, Plastics, Advance Materials, Bio Materials, Composites and Others)
- 8.5 Europe Extensometer Market: Country Analysis
- 8.6 Market Opportunity Chart of Europe Extensometer Market - By Country, By Value, 2027
- 8.7 Competitive Positioning of Europe Extensometer Market: By Country
- 8.8 Germany Extensometer Market: Size and Forecast (2017-2027), By Value, By Volume
- 8.9 Germany Extensometer Market Segmentation (By Product, By Chamber Testing Process, By Application)
- 8.10 United Kingdom Extensometer Market: Size and Forecast (2017-2027), By Value, By Volume
- 8.11 United Kingdom Extensometer Market Segmentation (By Product, By Chamber Testing Process, By Application)
- 8.12 France Extensometer Market: Size and Forecast (2017-2027), By Value, By Volume
- 8.13 France Extensometer Market Segmentation (By Product, By Chamber Testing Process, By Application)
- 8.14 Italy Extensometer Market: Size and Forecast (2017-2027), By Value, By Volume
- 8.15 Italy Extensometer Market Segmentation (By Product, By Chamber Testing Process, By Application)
9. Asia Pacific Extensometer Market: An Analysis (2017-2027)
- 9.1 Asia Pacific Extensometer Market: Size and Forecast (2017-2027), By Value, By Volume
- 9.2 Market Segmentation By Product (Non-Contact (Laser and Video) and Contact (Sensor Arm and Clip On))
- 9.3 Market Segmentation By Chamber Testing Process (Automated Strain Management and Manual)
- 9.4 Market Segmentation By Application (Metals, Plastics, Advance Materials, Bio Materials, Composites and Others)
- 9.5 Asia Pacific Extensometer Market: Country Analysis
- 9.6 Market Opportunity Chart of Asia Pacific Extensometer Market - By Country, By Value, 2027
- 9.7 Competitive Positioning of Asia Pacific Extensometer Market: By Country
- 9.8 China Extensometer Market: Size and Forecast (2017-2027), By Value, By Volume
- 9.9 China Extensometer Market Segmentation (By Product, By Chamber Testing Process, By Application)
- 9.10 Japan Extensometer Market: Size and Forecast (2017-2027), By Value, By Volume
- 9.11 Japan Extensometer Market Segmentation (By Product, By Chamber Testing Process, By Application)
- 9.12 India Extensometer Market: Size and Forecast (2017-2027), By Value, By Volume
- 9.13 India Extensometer Market Segmentation (By Product, By Chamber Testing Process, By Application)
- 9.14 South Korea Extensometer Market: Size and Forecast (2017-2027), By Value, By Volume
- 9.15 South Korea Extensometer Market Segmentation (By Product, By Chamber Testing Process, By Application)
10. Latin America Extensometer Market
11. Middle East and Africa Extensometer Market
12. Global Extensometer Market Dynamics
- 12.1 Drivers
- 12.2 Restraints
- 12.3 Trends
13. Market Attractiveness
- 13.1 Market Attractiveness Chart of Global Extensometer Market - By Product, 2027
- 13.2 Market Attractiveness Chart of Global Extensometer Market - By Chamber Testing Process, 2027
- 13.3 Market Attractiveness Chart of Global Extensometer Market - By Application, 2027
- 13.4 Market Attractiveness Chart of Global Extensometer Market - By Region, 2026
14. Competitive Landscape
- 14.1 Market Share Analysis
- 14.2 Porter Five Force Analysis
15. Company Analysis
- 15.1 Mechatronics Inc.
- 15.2 Tinius Olsen
- 15.3 Zwick Roell Group
- 15.4 3R
- 15.5 Shenzhen Wance Testing Machine Co., Ltd.
- 15.6 Instron
- 15.7 LIMESS Messtechnik und Software GmbH
- 15.8 Quantum Geotechnic
- 15.9 Reliant Technology
- 15.10 Devco