|
|
市場調査レポート
商品コード
1515442
電気材料市場:タイプ別、技術別、地域別 - 産業分析、市場規模、市場シェア、2024年~2032年の予測Electrical Materials Market, By Type, By Technology, and By Region - Industry Analysis, Market Size, Market Share & Forecast from 2024-2032 |
||||||

|
|||||||
カスタマイズ可能
|
|||||||

| 電気材料市場:タイプ別、技術別、地域別 - 産業分析、市場規模、市場シェア、2024年~2032年の予測 |
|
出版日: 2024年06月04日
発行: AnalystView Market Insights
ページ情報: 英文 322 Pages
納期: 2~3営業日
|

全表示
- 概要
- 図表
- 目次
レポートハイライト
2023年の電気材料市場規模は45億8,120万米ドルとなり、2024年から2032年にかけてCAGR11.50%で拡大
電気材料市場 - 市場力学
電気自動車需要の高まりが市場成長を促進
電気自動車(EV)の生産台数の増加により、電気材料市場は今後の発展が見込まれています。バッテリーで走行し、外部充電が可能な電気モーターを搭載した自動車を電気自動車と呼びます。さまざまな電気材料が電気自動車の主要部品になると考えられているため、電気自動車の台数が増え、より多くの電気自動車が必要とされるようになれば、これらの材料の市場は拡大すると思われます。例えば、Global EV Outlook 2022の調査によると、電気自動車(EV)の販売台数は2022年に660万台と過去最高を記録し、前年から倍増しました。また、電気自動車の世界販売台数は、2021年の298万台から660万台に増加しています。このように、電気自動車の需要拡大に伴い、電気材料市場は拡大しています。
電気材料市場 - 主要洞察
調査アナリストの分析によると、世界市場は予測期間(2024年~2032年)に約11.50%のCAGRで毎年成長すると推定されます。
タイプセグメンテーションに基づくと、照明スイッチカテゴリは2023年に最大の市場シェアを示すと予測されました。
技術セグメンテーションに基づくと、2023年には業務用カテゴリーが主要タイプでした。
地域別では、北米が2023年に主要な収益源となりました。
電気材料市場 - セグメンテーション分析:
世界の電気材料市場は、タイプ、技術、地域に基づいてセグメント化されます。
市場はタイプに基づいて以下のカテゴリーに分けられます:サーキットブレーカー、ライトスイッチ、プラグ&ソケット、電圧切替器、ケーブルマネジメント、ケーブルダクト、電線管、その他。ライトスイッチのカテゴリーが市場を独占しています。コンセント、照明、または恒久的に接続されたデバイスを制御する場合、ライトスイッチは電気配線で最も一般的に利用されます。市場拡大にとって有益と思われるもう一つの側面は、スマート・ライト・スイッチの普及が進んでいることです。使用していない間、家庭で照明やその他の電化製品のスイッチを切ることは、スマート・スイッチによって容易になり、より効率的なエネルギー利用が可能になります。その結果、より多くの費用と労力が節約されます。
市場は技術によって3つのカテゴリーに分けられます:産業用、商業用、家庭用です。業務用カテゴリーが市場を独占しており、予測期間中もその優位性は維持されるであると考えられています。電気材料市場のエンドユーザー産業は、小売店、病院、ホテル、オフィス、その他の公共スペースなど、数多くの商業施設で構成されています。ビジネスの世界では、電気部品はケーブル、照明、配電、HVACシステム、通信ネットワーク、その他の電気機器など、幅広い用途に使用されています。ビジネス分野における電気材料へのニーズは、可処分所得の増加、急速な都市化、エネルギー効率に対する意識の高まりといった要因に後押しされています。
電気材料市場 - 地理的洞察
地域的には、この市場は北米、ラテンアメリカ、欧州、アジア太平洋、中東・アフリカの各地域に広がっています。これらの地域は、ビジネスをもたらす国によってさらに分けられます。
予測期間中、北米が電気材料の世界市場で最大のシェアを占めると予想されています。電力網の構築や老朽化した電気システムの更新など、インフラ整備への支出が増加していることが重要な要因のひとつです。また、太陽光発電や風力発電などの再生可能エネルギーの急速な普及により、高効率化やスマートグリッド技術との統合に対応できる高度な電気材料のニーズが高まっています。
さらに、アジア太平洋の予測期間中、電気材料市場は世界で最も速い速度で拡大すると予想されています。電気材料メーカーは、安価な労働力と原材料が豊富にあり、電力生産部門で国内需要が伸びていることから、この地域が望ましい投資先であると考えています。この地域の電気材料市場を促進する要因としては、人口の増加、都市化、工業化が挙げられます。
電気材料市場 - 競合情勢:
世界の電気材料市場で大きなシェアを占めている主要企業は、DuPont(米国)、Elantas(ドイツ)、Krempel GMBH(ドイツ)、Nitto(日本)などです。世界の電気材料市場の大手企業は、製品開拓、提携、発売、契約など、さまざまな戦略を採用し、市場の成長を左右しています。
目次
第1章 電気材料市場概要
- 調査範囲
- 市場推定年
第2章 エグゼクティブサマリー
- 市場内訳
- 競合考察
第3章 電気材料の主要市場動向
- 市場促進要因
- 市場抑制要因
- 市場機会
- 市場の将来動向
第4章 電気材料産業研究
- PEST分析
- ポーターのファイブフォース分析
- 成長見通しマッピング
- 規制枠組み分析
第5章 電気材料市場:COVID-19の影響分析
- COVID-19以前の影響分析
- COVID-19以後の影響分析
第6章 電気材料市場情勢
- 電気材料市場シェア分析、2023年
- 内訳データ:主要メーカー別
- 既存企業の分析
- 新興企業の分析
第7章 電気材料市場 - タイプ別
- 概要
- セグメントシェア分析:タイプ別
- サーキットブレーカー
- 照明スイッチ
- プラグ・ソケット
- 電圧スイッチャー
- ケーブル管理
- ケーブル管路
- 電気コンジット
- その他
第8章 電気材料市場 - 技術別
- 概要
- セグメントシェア分析:技術別
- 産業
- 商業
- 家庭
第9章 電気材料市場 - 地域別
- イントロダクション
- 北米
- 概要
- 北米の主要メーカー
- 米国
- カナダ
- 欧州
- 概要
- 欧州の主要メーカー
- ドイツ
- イタリア
- 英国
- フランス
- ロシア
- オランダ
- スウェーデン
- ポーランド
- その他
- アジア太平洋(APAC)
- 概要
- アジア太平洋の主要メーカー
- インド
- 中国
- 日本
- 韓国
- オーストラリア
- タイ
- インドネシア
- フィリピン
- その他
- ラテンアメリカ
- 概要
- ラテンアメリカの主要メーカー
- ブラジル
- メキシコ
- アルゼンチン
- コロンビア
- その他
- 中東・アフリカ
- 概要
- 中東・アフリカの主要メーカー
- サウジアラビア
- アラブ首長国連邦
- イスラエル
- トルコ
- アルジェリア
- エジプト
- その他
第10章 主要ベンダー分析 - 電気材料業界
- 競争ダッシュボード
- 企業プロファイル
- DuPont(US)
- Elantas(Germany)
- Krempel GMBH(Germany)
- Nitto(Japan)
- Von Roll(Switzerland)
- ITW Formex(US)
- 3M(US)
- Haysite Reinforced Plastics(US)
- Vitar(China)
- Tesa SE(Germany)
- Teijin DuPont Films(Japan)
- NGK Insulator(Japan)
- その他
第11章 アナリストの全方位展望
List of Tables
- TABLE List of data sources
- TABLE Market drivers; Impact Analysis
- TABLE Market restraints; Impact Analysis
- TABLE Electrical Materials Market: Type Snapshot (2023)
- TABLE Segment Dashboard; Definition and Scope, by Type
- TABLE Global Electrical Materials Market, by Type 2019-2032 (USD Million)
- TABLE Electrical Materials Market: Technology Snapshot (2023)
- TABLE Segment Dashboard; Definition and Scope, by Technology
- TABLE Global Electrical Materials Market, by Technology 2019-2032 (USD Million)
- TABLE Electrical Materials Market: Regional snapshot (2023)
- TABLE Segment Dashboard; Definition and Scope, by Region
- TABLE Global Electrical Materials Market, by Region 2019-2032 (USD Million)
- TABLE North America Electrical Materials Market, by Country, 2019-2032 (USD Million)
- TABLE North America Electrical Materials Market, by Type, 2019-2032 (USD Million)
- TABLE North America Electrical Materials Market, by Technology, 2019-2032 (USD Million)
- TABLE Europe Electrical Materials Market, by Country, 2019-2032 (USD Million)
- TABLE Europe Electrical Materials Market, by Type, 2019-2032 (USD Million)
- TABLE Europe Electrical Materials Market, by Technology, 2019-2032 (USD Million)
- TABLE Asia Pacific Electrical Materials Market, by Country, 2019-2032 (USD Million)
- TABLE Asia Pacific Electrical Materials Market, by Type, 2019-2032 (USD Million)
- TABLE Asia Pacific Electrical Materials Market, by Technology, 2019-2032 (USD Million)
- TABLE Latin America Electrical Materials Market, by Country, 2019-2032 (USD Million)
- TABLE Latin America Electrical Materials Market, by Type, 2019-2032 (USD Million)
- TABLE Latin America Electrical Materials Market, by Technology, 2019-2032 (USD Million)
- TABLE Middle East and Africa Electrical Materials Market, by Country, 2019-2032 (USD Million)
- TABLE Middle East and Africa Electrical Materials Market, by Type, 2019-2032 (USD Million)
- TABLE Middle East and Africa Electrical Materials Market, by Technology, 2019-2032 (USD Million)
List of Figures
- FIGURE Electrical Materials Market Segmentation
- FIGURE Market research methodology
- FIGURE Value chain analysis
- FIGURE Porter's Five Forces Analysis
- FIGURE Market Attractiveness Analysis
- FIGURE COVID-19 Impact Analysis
- FIGURE Pre & Post COVID-19 Impact Comparision Study
- FIGURE Competitive Landscape; Key company market share analysis, 2023
- FIGURE Type segment market share analysis, 2023 & 2032
- FIGURE Type segment market size forecast and trend analysis, 2019 to 2032 (USD Million)
- FIGURE Technology segment market share analysis, 2023 & 2032
- FIGURE Technology segment market size forecast and trend analysis, 2019 to 2032 (USD Million)
- FIGURE Regional segment market share analysis, 2023 & 2032
- FIGURE Regional segment market size forecast and trend analysis, 2019 to 2032 (USD Million)
- FIGURE North America Electrical Materials Market share and leading players, 2023
- FIGURE Europe Electrical Materials Market share and leading players, 2023
- FIGURE Asia Pacific Electrical Materials Market share and leading players, 2023
- FIGURE Latin America Electrical Materials Market share and leading players, 2023
- FIGURE Middle East and Africa Electrical Materials Market share and leading players, 2023
- FIGURE North America market share analysis by country, 2023
- FIGURE U.S. Electrical Materials Market size, forecast and trend analysis, 2019 to 2032 (USD Million)
- FIGURE Canada Electrical Materials Market size, forecast and trend analysis, 2019 to 2032 (USD Million)
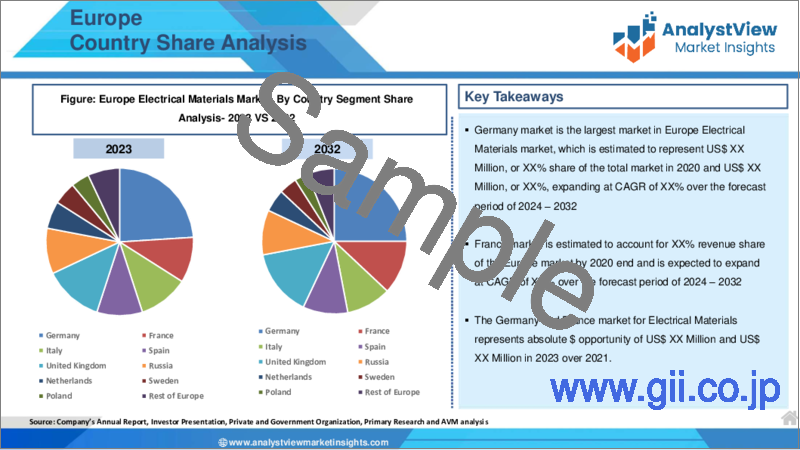
- FIGURE Europe Electrical Materials Market share analysis by country, 2023
- FIGURE Germany Electrical Materials Market size, forecast and trend analysis, 2019 to 2032 (USD Million)
- FIGURE Spain Electrical Materials Market size, forecast and trend analysis, 2019 to 2032 (USD Million)
- FIGURE Italy Electrical Materials Market size, forecast and trend analysis, 2019 to 2032 (USD Million)
- FIGURE France Electrical Materials Market size, forecast and trend analysis, 2019 to 2032 (USD Million)
- FIGURE UK Electrical Materials Market size, forecast and trend analysis, 2019 to 2032 (USD Million)
- FIGURE Russia Electrical Materials Market size, forecast and trend analysis, 2019 to 2032 (USD Million)
- FIGURE Netherlands Electrical Materials Market size, forecast and trend analysis, 2019 to 2032 (USD Million)
- FIGURE Sweden Electrical Materials Market size, forecast and trend analysis, 2019 to 2032 (USD Million)
- FIGURE Poland Electrical Materials Market size, forecast and trend analysis, 2019 to 2032 (USD Million)
- FIGURE Rest of the Europe Electrical Materials Market size, forecast and trend analysis, 2019 to 2032 (USD Million)
- FIGURE Asia Pacific Electrical Materials Market share analysis by country, 2023
- FIGURE India Electrical Materials Market size, forecast and trend analysis, 2019 to 2032 (USD Million)
- FIGURE China Electrical Materials Market size, forecast and trend analysis, 2019 to 2032 (USD Million)
- FIGURE Japan Electrical Materials Market size, forecast and trend analysis, 2019 to 2032 (USD Million)
- FIGURE South Korea Electrical Materials Market size, forecast and trend analysis, 2019 to 2032 (USD Million)
- FIGURE Australia Electrical Materials Market size, forecast and trend analysis, 2019 to 2032 (USD Million)
- FIGURE Thailand Electrical Materials Market size, forecast and trend analysis, 2019 to 2032 (USD Million)
- FIGURE Indonesia Electrical Materials Market size, forecast and trend analysis, 2019 to 2032 (USD Million)
- FIGURE Philippines Electrical Materials Market size, forecast and trend analysis, 2019 to 2032 (USD Million)
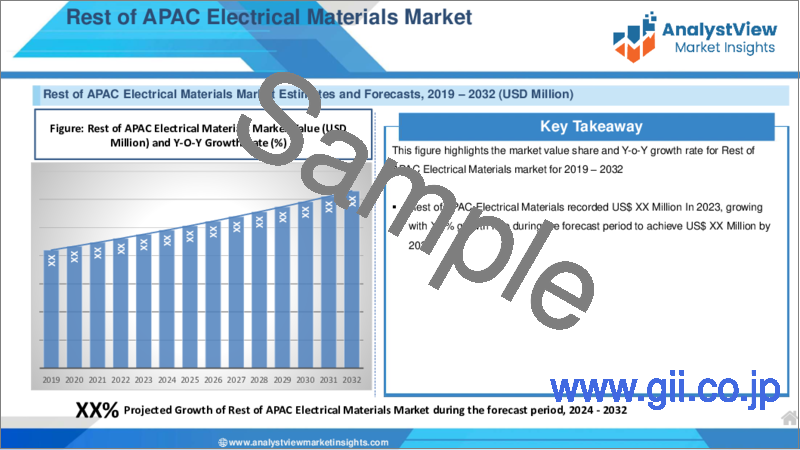
- FIGURE Rest of APAC Electrical Materials Market size, forecast and trend analysis, 2019 to 2032 (USD Million)
- FIGURE Latin America Electrical Materials Market size, forecast and trend analysis, 2019 to 2032 (USD Million)
- FIGURE Latin America Electrical Materials Market share analysis by country, 2023
- FIGURE Brazil Electrical Materials Market size, forecast and trend analysis, 2019 to 2032 (USD Million)
- FIGURE Mexico Electrical Materials Market size, forecast and trend analysis, 2019 to 2032 (USD Million)
- FIGURE Argentina Electrical Materials Market size, forecast and trend analysis, 2019 to 2032 (USD Million)
- FIGURE Colombia Electrical Materials Market size, forecast and trend analysis, 2019 to 2032 (USD Million)
- FIGURE Rest of LATAM Electrical Materials Market size, forecast and trend analysis, 2019 to 2032 (USD Million)
- FIGURE Middle East and Africa Electrical Materials Market size, forecast and trend analysis, 2019 to 2032 (USD Million)
- FIGURE Middle East and Africa Electrical Materials Market share analysis by country, 2023
- FIGURE Saudi Arabia Electrical Materials Market size, forecast and trend analysis, 2019 to 2032 (USD Million)
- FIGURE United Arab Emirates Electrical Materials Market size, forecast and trend analysis, 2019 to 2032 (USD Million)
- FIGURE Israel Electrical Materials Market size, forecast and trend analysis, 2019 to 2032 (USD Million)
- FIGURE Turkey Electrical Materials Market size, forecast and trend analysis, 2019 to 2032 (USD Million)
- FIGURE Algeria Electrical Materials Market size, forecast and trend analysis, 2019 to 2032 (USD Million)
- FIGURE Egypt Electrical Materials Market size, forecast and trend analysis, 2019 to 2032 (USD Million)
- FIGURE Rest of MEA Electrical Materials Market size, forecast and trend analysis, 2019 to 2032 (USD Million)
REPORT HIGHLIGHT
Electrical Materials Market size was valued at USD 4,581.2 Million in 2023, expanding at a CAGR of 11.50% from 2024 to 2032.
Every construction project that involves linking commercial, residential, or industrial structures to an electrical power source needs electric materials as fundamental components and building blocks. An industrial complex or a modest domestic circuit may have electrical components of different sizes. For these materials, the lowest possible electrical conductivity should be attained. In addition to being utilized in the creation of conductors for all kinds of windings found in apparatus, electrical machinery, and gadgets, they are also employed in the distribution and transmission of electrical energy.
Electrical Materials Market- Market Dynamics
Growing Demand for Electric Vehicles to Propel Market Growth
The market for electrical materials is anticipated to develop in the future due to the increase in the production of electric vehicles (EVs). A car with an electric motor that can run on a battery and receive external charging is referred to as an electric vehicle. Since different electrical materials are thought to be the main components of electric vehicles, the market for these materials will grow as the number of electric vehicles increases and more of them are required. For instance, the Global EV Outlook 2022 study states that sales of electric vehicles (EVs) reached a record high of 6.6 million in 2022, having doubled from the year before. In addition, global sales of electric vehicles increased from 2,980,000 to 6,600,000 in 2021. Thus, the market for electrical materials is expanding as a result of the growing demand for electric vehicles.
Electrical Materials Market- Key Insights
As per the analysis shared by our research analyst, the global market is estimated to grow annually at a CAGR of around 11.50% over the forecast period (2024-2032)
Based on type segmentation, the light switches category was predicted to show maximum market share in the year 2023
Based on technology segmentation, the commercial category was the leading type in 2023
On the basis of region, North America was the leading revenue generator in 2023
Electrical Materials Market- Segmentation Analysis:
The Global Electrical Materials Market is segmented on the basis of Type, Technology, and Region.
The market is divided into the following categories based on type: Circuit Breakers, Light Switches, Plugs & Sockets, Voltage Switcher, Cable Management, Cable Duct, Electrical Conduit, and Others. The light switches category dominates the market. When controlling electrical outlets, lights, or permanently connected devices, light switches are most commonly utilized in electrical wiring. Another aspect that appears to be beneficial for market expansion is the growing ubiquity of smart light switches-switching off lights and other appliances at home while not in use is made easier with smart switches, making them a more efficient use of energy. Consequently, more money and efforts are spared.
The market is divided into three categories based on technology: Industrial, Commercial and Domestic. The commercial category dominates the market and is likely to maintain its dominance during the forecast period. The end-user industry for the electrical materials market consists of numerous commercial establishments, such as retail stores, hospitals, hotels, offices, and other public spaces. In the business world, electrical components are used for a wide range of applications, such as cables, lights, power distribution, HVAC systems, communication networks, and other electrical apparatus. The business sector's need for electrical materials is fueled by factors such as rising disposable income, rapid urbanization, and growing awareness of energy efficiency.
Electrical Materials Market- Geographical Insights
Geographically, this market is widespread into the regions of North America, Latin America, Europe, Asia Pacific, and the Middle East and Africa. These regions are further divided as per the nations bringing business.
Over the course of the forecast period, North America is anticipated to hold the greatest share of the global market for electrical materials. The growing expenditure on infrastructure development, which includes building out power networks and updating outdated electrical systems, is one important factor. Additionally, the need for sophisticated electrical materials with the ability to handle increasing efficiency and integration with smart grid technology has increased due to the quick adoption of renewable energy sources like solar and wind power.
In addition, the electrical materials market is anticipated to expand at the fastest rate in the world during the projected period in Asia Pacific. Electrical material manufacturers find the region to be a desirable investment destination due to the abundance of inexpensive labor and raw materials, as well as the growing domestic demand in the power production sector. Some of the factors that will propel the market for electrical materials in this region are the increasing population, urbanization, and industrialization.
Electrical Materials Market- Competitive Landscape:
Leading businesses that hold a substantial share of the global electrical materials market are DuPont (US), Elantas (Germany), Krempel GMBH (Germany), Nitto (Japan), and others. The leading companies in the global electrical materials market employ a range of strategies, such as product development, alliances, launches, and agreements, to influence the market's growth.
Recent Developments:
April 2021: For an unknown sum, CMC Materials, a critical materials manufacturer and supplier with headquarters in the US, purchased International Test Solutions. Through the acquisition, CMC Materials can now provide its clients with even more essential, game-changing solutions to help them tackle their most challenging issues. US-based International Test Solutions produces customized cleaning solutions for the semiconductor industry.
SCOPE OF THE REPORT
The scope of this report covers the market by its major segments, which include as follows:
GLOBAL ELECTRICAL MATERIALS MARKET KEY PLAYERS- DETAILED COMPETITIVE INSIGHTS
DuPont (US)
Elantas (Germany)
Krempel GMBH (Germany)
Nitto (Japan)
Von Roll (Switzerland)
ITW Formex (US)
3M (US)
Haysite Reinforced Plastics (US)
Vitar (China)
Tesa SE (Germany)
Teijin DuPont Films (Japan)
NGK Insulator (Japan)
Others
GLOBAL ELECTRICAL MATERIALS MARKET, BY TYPE- MARKET ANALYSIS, 2019 - 2032
- Circuit Breakers
- Light Switches
- Plugs & Sockets
- Voltage Switcher
- Cable Management
- Cable Duct
- Electrical Conduit
- Others
GLOBAL ELECTRICAL MATERIALS MARKET, BY TECHNOLOGY- MARKET ANALYSIS, 2019 - 2032
- Industrial
- Commercial
- Domestic
GLOBAL ELECTRICAL MATERIALS MARKET, BY REGION- MARKET ANALYSIS, 2019 - 2032
- North America
- The U.S.
- Canada
- Europe
- Germany
- France
- Italy
- Spain
- United Kingdom
- Russia
- Netherlands
- Sweden
- Poland
- Rest of Europe
- Asia Pacific
- India
- China
- South Korea
- Japan
- Australia
- Thailand
- Indonesia
- Philippines
- Rest of APAC
- Latin America
- Brazil
- Mexico
- Argentina
- Colombia
- Rest of LATAM
- The Middle East and Africa
- Saudi Arabia
- United Arab Emirates
- Israel
- Turkey
- Algeria
- Egypt
- Rest of MEA
Table of Contents
1. Electrical Materials Market Overview
- 1.1. Study Scope
- 1.2. Market Estimation Years
2. Executive Summary
- 2.1. Market Snippet
- 2.1.1. Electrical Materials Market Snippet by Type
- 2.1.2. Electrical Materials Market Snippet by Technology
- 2.1.3. Electrical Materials Market Snippet by Country
- 2.1.4. Electrical Materials Market Snippet by Region
- 2.2. Competitive Insights
3. Electrical Materials Key Market Trends
- 3.1. Electrical Materials Market Drivers
- 3.1.1. Impact Analysis of Market Drivers
- 3.2. Electrical Materials Market Restraints
- 3.2.1. Impact Analysis of Market Restraints
- 3.3. Electrical Materials Market Opportunities
- 3.4. Electrical Materials Market Future Trends
4. Electrical Materials Industry Study
- 4.1. PEST Analysis
- 4.2. Porter's Five Forces Analysis
- 4.3. Growth Prospect Mapping
- 4.4. Regulatory Framework Analysis
5. Electrical Materials Market: COVID-19 Impact Analysis
- 5.1. Pre-COVID-19 Impact Analysis
- 5.2. Post-COVID-19 Impact Analysis
- 5.2.1. Top Performing Segments
- 5.2.2. Marginal Growth Segments
- 5.2.3. Top Looser Segments
- 5.2.4. Marginal Loss Segments
6. Electrical Materials Market Landscape
- 6.1. Electrical Materials Market Share Analysis, 2023
- 6.2. Breakdown Data, by Key Manufacturer
- 6.2.1. Established Players' Analysis
- 6.2.2. Emerging Players' Analysis
7. Electrical Materials Market - By Type
- 7.1. Overview
- 7.1.1. Segment Share Analysis, By Type, 2023 & 2032 (%)
- 7.1.2. Circuit Breakers
- 7.1.3. Light Switches
- 7.1.4. Plugs & Sockets
- 7.1.5. Voltage Switcher
- 7.1.6. Cable Management
- 7.1.7. Cable Duct
- 7.1.8. Electrical Conduit
- 7.1.9. Others
8. Electrical Materials Market - By Technology
- 8.1. Overview
- 8.1.1. Segment Share Analysis, By Technology, 2023 & 2032 (%)
- 8.1.2. Industrial
- 8.1.3. Commercial
- 8.1.4. Domestic
9. Electrical Materials Market- By Geography
- 9.1. Introduction
- 9.1.1. Segment Share Analysis, By Geography, 2023 & 2032 (%)
- 9.2. North America
- 9.2.1. Overview
- 9.2.2. Electrical Materials Key Manufacturers in North America
- 9.2.3. North America Market Size and Forecast, By Country, 2019 - 2032 (US$ Million)
- 9.2.4. North America Market Size and Forecast, By Type, 2019 - 2032 (US$ Million)
- 9.2.5. North America Market Size and Forecast, By Technology, 2019 - 2032 (US$ Million)
- 9.2.6. U.S.
- 9.2.6.1. Overview
- 9.2.6.2. Market Analysis, Forecast, and Y-O-Y Growth Rate, 2019 - 2032, (US$ Million)
- 9.2.6.3. U.S. Market Size and Forecast, By Type, 2019 - 2032 (US$ Million)
- 9.2.6.4. U.S. Market Size and Forecast, By Technology, 2019 - 2032 (US$ Million)
- 9.2.7. Canada
- 9.2.7.1. Overview
- 9.2.7.2. Market Analysis, Forecast, and Y-O-Y Growth Rate, 2019 - 2032, (US$ Million)
- 9.2.7.3. Canada Market Size and Forecast, By Type, 2019 - 2032 (US$ Million)
- 9.2.7.4. Canada Market Size and Forecast, By Technology, 2019 - 2032 (US$ Million)
- 9.3. Europe
- 9.3.1. Overview
- 9.3.2. Electrical Materials Key Manufacturers in Europe
- 9.3.3. Europe Market Size and Forecast, By Country, 2019 - 2032 (US$ Million)
- 9.3.4. Europe Market Size and Forecast, By Type, 2019 - 2032 (US$ Million)
- 9.3.5. Europe Market Size and Forecast, By Technology, 2019 - 2032 (US$ Million)
- 9.3.6. Germany
- 9.3.6.1. Overview
- 9.3.6.2. Market Analysis, Forecast, and Y-O-Y Growth Rate, 2019 - 2032, (US$ Million)
- 9.3.6.3. Germany Market Size and Forecast, By Type, 2019 - 2032 (US$ Million)
- 9.3.6.4. Germany Market Size and Forecast, By Technology, 2019 - 2032 (US$ Million)
- 9.3.7. Italy
- 9.3.7.1. Overview
- 9.3.7.2. Market Analysis, Forecast, and Y-O-Y Growth Rate, 2019 - 2032, (US$ Million)
- 9.3.7.3. Italy Market Size and Forecast, By Type, 2019 - 2032 (US$ Million)
- 9.3.7.4. Italy Market Size and Forecast, By Technology, 2019 - 2032 (US$ Million)
- 9.3.8. United Kingdom
- 9.3.8.1. Overview
- 9.3.8.2. Market Analysis, Forecast, and Y-O-Y Growth Rate, 2019 - 2032, (US$ Million)
- 9.3.8.3. United Kingdom Market Size and Forecast, By Type, 2019 - 2032 (US$ Million)
- 9.3.8.4. United Kingdom Market Size and Forecast, By Technology, 2019 - 2032 (US$ Million)
- 9.3.9. France
- 9.3.9.1. Overview
- 9.3.9.2. Market Analysis, Forecast, and Y-O-Y Growth Rate, 2019 - 2032, (US$ Million)
- 9.3.9.3. France Market Size and Forecast, By Type, 2019 - 2032 (US$ Million)
- 9.3.9.4. France Market Size and Forecast, By Technology, 2019 - 2032 (US$ Million)
- 9.3.10. Russia
- 9.3.10.1. Market Analysis, Forecast, and Y-O-Y Growth Rate, 2019 - 2032, (US$ Million)
- 9.3.10.2. Russia Market Size and Forecast, By Type, 2019 - 2032 (US$ Million)
- 9.3.10.3. Russia Market Size and Forecast, By Technology, 2019 - 2032 (US$ Million)
- 9.3.11. Netherlands
- 9.3.11.1. Market Analysis, Forecast, and Y-O-Y Growth Rate, 2019 - 2032, (US$ Million)
- 9.3.11.2. Netherlands Market Size and Forecast, By Type, 2019 - 2032 (US$ Million)
- 9.3.11.3. Netherlands Market Size and Forecast, By Technology, 2019 - 2032 (US$ Million)
- 9.3.12. Sweden
- 9.3.12.1. Market Analysis, Forecast, and Y-O-Y Growth Rate, 2019 - 2032, (US$ Million)
- 9.3.12.2. Sweden Market Size and Forecast, By Type, 2019 - 2032 (US$ Million)
- 9.3.12.3. Sweden Market Size and Forecast, By Technology, 2019 - 2032 (US$ Million)
- 9.3.13. Poland
- 9.3.13.1. Market Analysis, Forecast, and Y-O-Y Growth Rate, 2019 - 2032, (US$ Million)
- 9.3.13.2. Poland Market Size and Forecast, By Type, 2019 - 2032 (US$ Million)
- 9.3.13.3. Poland Market Size and Forecast, By Technology, 2019 - 2032 (US$ Million)
- 9.3.14. Rest of Europe
- 9.3.14.1. Overview
- 9.3.14.2. Market Analysis, Forecast, and Y-O-Y Growth Rate, 2019 - 2032, (US$ Million)
- 9.3.14.3. Rest of the Europe Market Size and Forecast, By Type, 2019 - 2032 (US$ Million)
- 9.3.14.4. Rest of the Europe Market Size and Forecast, By Technology, 2019 - 2032 (US$ Million)
- 9.4. Asia Pacific (APAC)
- 9.4.1. Overview
- 9.4.2. Electrical Materials Key Manufacturers in Asia Pacific
- 9.4.3. Asia Pacific Market Size and Forecast, By Country, 2019 - 2032 (US$ Million)
- 9.4.4. Asia Pacific Market Size and Forecast, By Type, 2019 - 2032 (US$ Million)
- 9.4.5. Asia Pacific Market Size and Forecast, By Technology, 2019 - 2032 (US$ Million)
- 9.4.6. India
- 9.4.6.1. Overview
- 9.4.6.2. Market Analysis, Forecast, and Y-O-Y Growth Rate, 2019 - 2032, (US$ Million)
- 9.4.6.3. India Market Size and Forecast, By Type, 2019 - 2032 (US$ Million)
- 9.4.6.4. India Market Size and Forecast, By Technology, 2019 - 2032 (US$ Million)
- 9.4.7. China
- 9.4.7.1. Overview
- 9.4.7.2. Market Analysis, Forecast, and Y-O-Y Growth Rate, 2019 - 2032, (US$ Million)
- 9.4.7.3. China Market Size and Forecast, By Type, 2019 - 2032 (US$ Million)
- 9.4.7.4. China Market Size and Forecast, By Technology, 2019 - 2032 (US$ Million)
- 9.4.8. Japan
- 9.4.8.1. Overview
- 9.4.8.2. Market Analysis, Forecast, and Y-O-Y Growth Rate, 2019 - 2032, (US$ Million)
- 9.4.8.3. Japan Market Size and Forecast, By Type, 2019 - 2032 (US$ Million)
- 9.4.8.4. Japan Market Size and Forecast, By Technology, 2019 - 2032 (US$ Million)
- 9.4.9. South Korea
- 9.4.9.1. Overview
- 9.4.9.2. Market Analysis, Forecast, and Y-O-Y Growth Rate, 2019 - 2032, (US$ Million)
- 9.4.9.3. South Korea Market Size and Forecast, By Type, 2019 - 2032 (US$ Million)
- 9.4.9.4. South Korea Market Size and Forecast, By Technology, 2019 - 2032 (US$ Million)
- 9.4.10. Australia
- 9.4.10.1. Overview
- 9.4.10.2. Market Analysis, Forecast, and Y-O-Y Growth Rate, 2019 - 2032, (US$ Million)
- 9.4.10.3. Australia Market Size and Forecast, By Type, 2019 - 2032 (US$ Million)
- 9.4.10.4. Australia Market Size and Forecast, By Technology, 2019 - 2032 (US$ Million)
- 9.4.11. Thailand
- 9.4.11.1. Overview
- 9.4.11.2. Market Analysis, Forecast, and Y-O-Y Growth Rate, 2019 - 2032, (US$ Million)
- 9.4.11.3. Thailand Market Size and Forecast, By Type, 2019 - 2032 (US$ Million)
- 9.4.11.4. Thailand Market Size and Forecast, By Technology, 2019 - 2032 (US$ Million)
- 9.4.12. Indonesia
- 9.4.12.1. Overview
- 9.4.12.2. Market Analysis, Forecast, and Y-O-Y Growth Rate, 2019 - 2032, (US$ Million)
- 9.4.12.3. Indonesia Market Size and Forecast, By Type, 2019 - 2032 (US$ Million)
- 9.4.12.4. Indonesia Market Size and Forecast, By Technology, 2019 - 2032 (US$ Million)
- 9.4.13. Philippines
- 9.4.13.1. Overview
- 9.4.13.2. Market Analysis, Forecast, and Y-O-Y Growth Rate, 2019 - 2032, (US$ Million)
- 9.4.13.3. Philippines Market Size and Forecast, By Type, 2019 - 2032 (US$ Million)
- 9.4.13.4. Philippines Market Size and Forecast, By Technology, 2019 - 2032 (US$ Million)
- 9.4.14. Rest of APAC
- 9.4.14.1. Overview
- 9.4.14.2. Market Analysis, Forecast, and Y-O-Y Growth Rate, 2019 - 2032, (US$ Million)
- 9.4.14.3. Rest of APAC Market Size and Forecast, By Type, 2019 - 2032 (US$ Million)
- 9.4.14.4. Rest of APAC Market Size and Forecast, By Technology, 2019 - 2032 (US$ Million)
- 9.5. Latin America
- 9.5.1. Overview
- 9.5.2. Electrical Materials Key Manufacturers in Latin America
- 9.5.3. Latin America Market Size and Forecast, By Country, 2019 - 2032 (US$ Million)
- 9.5.4. Latin America Market Size and Forecast, By Type, 2019 - 2032 (US$ Million)
- 9.5.5. Latin America Market Size and Forecast, By Technology, 2019 - 2032 (US$ Million)
- 9.5.6. Brazil
- 9.5.6.1. Overview
- 9.5.6.2. Market Analysis, Forecast, and Y-O-Y Growth Rate, 2019 - 2032, (US$ Million)
- 9.5.6.3. Brazil Market Size and Forecast, By Type, 2019 - 2032 (US$ Million)
- 9.5.6.4. Brazil Market Size and Forecast, By Technology, 2019 - 2032 (US$ Million)
- 9.5.7. Mexico
- 9.5.7.1. Overview
- 9.5.7.2. Market Analysis, Forecast, and Y-O-Y Growth Rate, 2019 - 2032, (US$ Million)
- 9.5.7.3. Mexico Market Size and Forecast, By Type, 2019 - 2032 (US$ Million)
- 9.5.7.4. Mexico Market Size and Forecast, By Technology, 2019 - 2032 (US$ Million)
- 9.5.8. Argentina
- 9.5.8.1. Overview
- 9.5.8.2. Market Analysis, Forecast, and Y-O-Y Growth Rate, 2019 - 2032, (US$ Million)
- 9.5.8.3. Argentina Market Size and Forecast, By Type, 2019 - 2032 (US$ Million)
- 9.5.8.4. Argentina Market Size and Forecast, By Technology, 2019 - 2032 (US$ Million)
- 9.5.9. Colombia
- 9.5.9.1. Overview
- 9.5.9.2. Market Analysis, Forecast, and Y-O-Y Growth Rate, 2019 - 2032, (US$ Million)
- 9.5.9.3. Colombia Market Size and Forecast, By Type, 2019 - 2032 (US$ Million)
- 9.5.9.4. Colombia Market Size and Forecast, By Technology, 2019 - 2032 (US$ Million)
- 9.5.10. Rest of LATAM
- 9.5.10.1. Overview
- 9.5.10.2. Market Analysis, Forecast, and Y-O-Y Growth Rate, 2019 - 2032, (US$ Million)
- 9.5.10.3. Rest of LATAM Market Size and Forecast, By Type, 2019 - 2032 (US$ Million)
- 9.5.10.4. Rest of LATAM Market Size and Forecast, By Technology, 2019 - 2032 (US$ Million)
- 9.6. Middle East and Africa
- 9.6.1. Overview
- 9.6.2. Electrical Materials Key Manufacturers in Middle East and Africa
- 9.6.3. Middle East and Africa Market Size and Forecast, By Country, 2019 - 2032 (US$ Million)
- 9.6.4. Middle East and Africa Market Size and Forecast, By Type, 2019 - 2032 (US$ Million)
- 9.6.5. Middle East and Africa Market Size and Forecast, By Technology, 2019 - 2032 (US$ Million)
- 9.6.6. Saudi Arabia
- 9.6.6.1. Overview
- 9.6.6.2. Market Analysis, Forecast, and Y-O-Y Growth Rate, 2019 - 2032, (US$ Million)
- 9.6.6.3. Saudi Arabia Market Size and Forecast, By Type, 2019 - 2032 (US$ Million)
- 9.6.6.4. Saudi Arabia Market Size and Forecast, By Technology, 2019 - 2032 (US$ Million)
- 9.6.7. United Arab Emirates
- 9.6.7.1. Overview
- 9.6.7.2. Market Analysis, Forecast, and Y-O-Y Growth Rate, 2019 - 2032, (US$ Million)
- 9.6.7.3. United Arab Emirates Market Size and Forecast, By Type, 2019 - 2032 (US$ Million)
- 9.6.7.4. United Arab Emirates Market Size and Forecast, By Technology, 2019 - 2032 (US$ Million)
- 9.6.8. Israel
- 9.6.8.1. Overview
- 9.6.8.2. Market Analysis, Forecast, and Y-O-Y Growth Rate, 2019 - 2032, (US$ Million)
- 9.6.8.3. Israel Market Size and Forecast, By Type, 2019 - 2032 (US$ Million)
- 9.6.8.4. Israel Market Size and Forecast, By Technology, 2019 - 2032 (US$ Million)
- 9.6.9. Turkey
- 9.6.9.1. Overview
- 9.6.9.2. Market Analysis, Forecast, and Y-O-Y Growth Rate, 2019 - 2032, (US$ Million)
- 9.6.9.3. Turkey Market Size and Forecast, By Type, 2019 - 2032 (US$ Million)
- 9.6.9.4. Turkey Market Size and Forecast, By Technology, 2019 - 2032 (US$ Million)
- 9.6.10. Algeria
- 9.6.10.1. Overview
- 9.6.10.2. Market Analysis, Forecast, and Y-O-Y Growth Rate, 2019 - 2032, (US$ Million)
- 9.6.10.3. Algeria Market Size and Forecast, By Type, 2019 - 2032 (US$ Million)
- 9.6.10.4. Algeria Market Size and Forecast, By Technology, 2019 - 2032 (US$ Million)
- 9.6.11. Egypt
- 9.6.11.1. Overview
- 9.6.11.2. Market Analysis, Forecast, and Y-O-Y Growth Rate, 2019 - 2032, (US$ Million)
- 9.6.11.3. Egypt Market Size and Forecast, By Type, 2019 - 2032 (US$ Million)
- 9.6.11.4. Egypt Market Size and Forecast, By Technology, 2019 - 2032 (US$ Million)
- 9.6.12. Rest of MEA
- 9.6.12.1. Overview
- 9.6.12.2. Market Analysis, Forecast, and Y-O-Y Growth Rate, 2019 - 2032, (US$ Million)
- 9.6.12.3. Rest of MEA Market Size and Forecast, By Type, 2019 - 2032 (US$ Million)
- 9.6.12.4. Rest of MEA Market Size and Forecast, By Technology, 2019 - 2032 (US$ Million)
10. Key Vendor Analysis- Electrical Materials Industry
- 10.1. Competitive Dashboard
- 10.2. Company Profiles
- 10.2.1. DuPont (US)
- 10.2.2. Elantas (Germany)
- 10.2.3. Krempel GMBH (Germany)
- 10.2.4. Nitto (Japan)
- 10.2.5. Von Roll (Switzerland)
- 10.2.6. ITW Formex (US)
- 10.2.7. 3M (US)
- 10.2.8. Haysite Reinforced Plastics (US)
- 10.2.9. Vitar (China)
- 10.2.10. Tesa SE (Germany)
- 10.2.11. Teijin DuPont Films (Japan)
- 10.2.12. NGK Insulator (Japan)
- 10.2.13. Others
11. 360 Degree Analyst View
12. Appendix
- 12.1. Research Methodology
- 12.2. References
- 12.3. Abbreviations
- 12.4. Disclaimer
- 12.5. Contact Us
