|
|
市場調査レポート
商品コード
1485850
Eバイク用電動モーター市場:モータータイプ別、Eバイクタイプ別、容量別、国別、地域別- 産業分析、市場規模、市場シェア、2023年~2030年予測E-Bikes Electric Motor Market, By Motor Type, By E-bike Type, By Capacity, By Country, and By Region - Industry Analysis, Market Size, Market Share & Forecast from 2023-2030 |
||||||
|
|||||||
カスタマイズ可能
|
|||||||


| Eバイク用電動モーター市場:モータータイプ別、Eバイクタイプ別、容量別、国別、地域別- 産業分析、市場規模、市場シェア、2023年~2030年予測 |
|
出版日: 2024年04月13日
発行: AnalystView Market Insights
ページ情報: 英文 385 Pages
納期: 2~3営業日
|

全表示
- 概要
- 図表
- 目次
レポートハイライト
Eバイク用電動モーター市場規模は2023年に345億4,334万米ドルとなり、2023年から2030年にかけてCAGR 12.5%で拡大
Eバイク用電動モーター市場-市場力学
持続可能な輸送とクリーンエネルギーの重視が市場需要を促進
持続可能な交通手段、健康志向、環境に優しい交通手段への重点の高まりなど、いくつかの要因により、電動バイク用モーター市場は現在急速に拡大しています。世界の主要都市では、自動車の排ガスや騒音の増加により、高いレベルの公害が発生しています。e-bikeの世界の販売は、高性能車と再生可能エネルギーに対する需要の健全な成長率によって牽引されています。
さらに、予測期間中、物流やe-bikeレンタルサービスを含むいくつかの産業におけるe-bikeタイプの成長が、e-bikeモーターの需要を促進すると予想されます。さらに、その手軽さと運用コストの低さから、e-bikeの需要が高まっています。さらに、世界中の政府や国際機関は、排出レベルの上昇によってもたらされる環境問題や健康問題の増大に対応するため、炭素排出レベルを下げるための厳しい排出基準を可決しています。さらに、予測期間中、高性能e-bikeの開発がe-bikeモーターの需要促進に大きく貢献すると予測されます。
e-bike電動モーター市場-主要インサイト
調査アナリストの分析によると、世界市場は予測期間(2024-2030年)に約12.5%のCAGRで毎年成長すると予測されます。
モータータイプのセグメンテーションに基づくと、ミッドドライブセグメントは、Eバイク、スクーターなどの高い需要により、2023年に最大の市場シェアを示すと予測されました。
E-bikeタイプ別では、主に都市部でのE-bike需要の増加により、都市セグメントが2023年にE-bikeタイプをリードしました。
容量セグメント別では、250W~500Wセグメントが2023年の主要容量でした。
地域別では、中国、インドネシア、日本などの急速な都市化により、アジア太平洋地域が2023年の主要収益源となった。
Eバイク電動モーター市場-セグメンテーション分析:
Eバイク用電動モーターの世界市場は、モータータイプ、Eバイクタイプ、容量、地域に基づいてセグメント化されます。
市場はモータータイプにより、ミッドドライブ、ダイレクトドライブハブモーター、ギアードハブモーター、フリクションモーターの4つに分類されます。ミッドドライブセグメントが市場を独占しています。e-bikeレンタルサービスの採用が増加していることが市場成長に寄与しているとみられます。
市場はE-bikeタイプによって3つのカテゴリーに分けられる:アーバン、E-マウンテン/E-MTB、E-カーゴです。都市セグメントは市場を独占しており、予測期間中もその優位性を維持するとみられます。都市部でのE-Bike需要の高まりが市場成長を後押しすると予測されます。
市場は容量によって250W未満、250W~500W、500W以上の3つのカテゴリーに分けられます。250W~500Wのセグメントが市場を独占しており、予測期間中もその優位性を維持するとみられます。中出力レベル(250W)のe-bikeの需要の高まりは、予測期間中に大きく成長すると予想されます。
e-bike電動モーター市場-地理的洞察
地理的には、この市場は北米、ラテンアメリカ、欧州、アジア太平洋、中東・アフリカの地域に広がっています。これらの地域は、ビジネスをもたらす国ごとにさらに分割されます。
Eバイク用電動モーター市場-競合情勢:
Eバイク用電動モーター市場は適度に断片化されており、国内外のプレーヤーによって形成されています。過去数年間、中国はアジア太平洋のEバイク用モーター市場の50%以上を占めてきたが、その主な理由は、交通渋滞や自動車公害の増加に対抗するために電動バイクの利用が増加しているためです。中国自転車協会の報告によると、近年、中国の電動自転車の年間販売台数は3,000万台に増加しています。インドのe-bikeモーター市場はまだ初期段階にあり、いくつかの地域企業が幅広い商品を提供しています。例えば、2023年1月に開催されたEMサミット2023では、EMotoradがインドで最もリーズナブルな価格のe-bikeラインナップを紹介しました。
目次
第1章 Eバイク電動モーター市場概要
- 調査範囲
- 市場推定年
第2章 エグゼクティブサマリー
- 市場内訳
- 競合考察
第3章 Eバイク電動モーターの主要市場動向
- 市場促進要因
- 市場抑制要因
- 市場機会
- 市場の将来動向
第4章 Eバイク電動モーター産業研究
- PEST分析
- ポーターのファイブフォース分析
- 成長見通しマッピング
- 規制枠組み分析
第5章 Eバイク電動モーター市場: COVID-19の影響分析
- COVID-19以前の影響分析
- COVID-19後の影響分析
第6章 Eバイク電動モーター市場情勢
- Eバイク電動モーター市場シェア分析、2023年
- 主要メーカー別内訳データ
- 既存企業の分析
- 新興企業の分析
第7章 Eバイク電動モーター市場- モータータイプ別
- 概要
- セグメントシェア分析、モータータイプ別
- ミッドドライブ
- ダイレクトドライブハブモーター
- ギア付きハブモーター
- 摩擦モーター
第8章 Eバイク電動モーター市場-Eバイクタイプ別
- 概要
- セグメントシェア分析、Eバイクタイプ別
- 都会的な
- E-マウンテン/E-MTB
- 電子貨物
第9章 Eバイク電動モーター市場- 容量別
- 概要
- セグメントシェア分析(容量別)
- 250W以下
- 250W - 500W
- 500W
- 500W以上
第10章 Eバイク電動モーター市場-地域
- イントロダクション
- 北米
- 概要
- 北米の主要メーカー
- 米国
- カナダ
- 欧州
- 概要
- 欧州の主要メーカー
- ドイツ
- イタリア
- 英国
- フランス
- ロシア
- オランダ
- スウェーデン
- ポーランド
- その他
- アジア太平洋(APAC)
- 概要
- アジア太平洋の主要メーカー
- インド
- 中国
- 日本
- 韓国
- オーストラリア
- タイ
- インドネシア
- フィリピン
- その他
- ラテンアメリカ
- 概要
- ラテンアメリカの主要メーカー
- ブラジル
- メキシコ
- アルゼンチン
- コロンビア
- その他
- 中東・アフリカ
- 概要
- 中東・アフリカの主要メーカー
- サウジアラビア
- アラブ首長国連邦
- イスラエル
- トルコ
- アルジェリア
- エジプト
- その他
第11章 主要ベンダー分析-Eバイク電動モーター業界
- 競合ダッシュボード
- 企業プロファイル
- TDCM Corporation Limited
- Robert Bosch GmbH
- Suzhou Xiongda Motor Co. Ltd
- Yamaha Motor Co. Ltd
- Dapu Motors
- Suzhou Bafang Electric Motor Science-Technology Co. Ltd
- Panasonic Corporation
- Derby Cycle Holding
- Continental AG
- TRANZX
- Shimano Inc.
- Nidec corporation
- Sporttech
- Handels GmbH
- Others
第12章 アナリストの全方位展望
List of Tables
- TABLE List of data sources
- TABLE Market drivers; Impact Analysis
- TABLE Market restraints; Impact Analysis
- TABLE E Bikes Electric Motor Market: Motor Type Snapshot (2023)
- TABLE Segment Dashboard; Definition and Scope, by Motor Type
- TABLE Global E Bikes Electric Motor Market, by Motor Type 2018-2030 (USD Million)
- TABLE E Bikes Electric Motor Market: E-bike Type Snapshot (2023)
- TABLE Segment Dashboard; Definition and Scope, by E-bike Type
- TABLE Global E Bikes Electric Motor Market, by E-bike Type 2018-2030 (USD Million)
- TABLE E Bikes Electric Motor Market: Capacity Snapshot (2023)
- TABLE Segment Dashboard; Definition and Scope, by Capacity
- TABLE Global E Bikes Electric Motor Market, by Capacity 2018-2030 (USD Million)
- TABLE E Bikes Electric Motor Market: Regional snapshot (2023)
- TABLE Segment Dashboard; Definition and Scope, by Region
- TABLE Global E Bikes Electric Motor Market, by Region 2018-2030 (USD Million)
- TABLE North America E Bikes Electric Motor Market, by Country, 2018-2030 (USD Million)
- TABLE North America E Bikes Electric Motor Market, by Motor Type, 2018-2030 (USD Million)
- TABLE North America E Bikes Electric Motor Market, by E-bike Type, 2018-2030 (USD Million)
- TABLE North America E Bikes Electric Motor Market, by Capacity, 2018-2030 (USD Million)
- TABLE Europe E Bikes Electric Motor Market, by Country, 2018-2030 (USD Million)
- TABLE Europe E Bikes Electric Motor Market, by Motor Type, 2018-2030 (USD Million)
- TABLE Europe E Bikes Electric Motor Market, by E-bike Type, 2018-2030 (USD Million)
- TABLE Europe E Bikes Electric Motor Market, by Capacity, 2018-2030 (USD Million)
- TABLE Asia Pacific E Bikes Electric Motor Market, by Country, 2018-2030 (USD Million)
- TABLE Asia Pacific E Bikes Electric Motor Market, by Motor Type, 2018-2030 (USD Million)
- TABLE Asia Pacific E Bikes Electric Motor Market, by E-bike Type, 2018-2030 (USD Million)
- TABLE Asia Pacific E Bikes Electric Motor Market, by Capacity, 2018-2030 (USD Million)
- TABLE Latin America E Bikes Electric Motor Market, by Country, 2018-2030 (USD Million)
- TABLE Latin America E Bikes Electric Motor Market, by Motor Type, 2018-2030 (USD Million)
- TABLE Latin America E Bikes Electric Motor Market, by E-bike Type, 2018-2030 (USD Million)
- TABLE Latin America E Bikes Electric Motor Market, by Capacity, 2018-2030 (USD Million)
- TABLE Middle East and Africa E Bikes Electric Motor Market, by Country, 2018-2030 (USD Million)
- TABLE Middle East and Africa E Bikes Electric Motor Market, by Motor Type, 2018-2030 (USD Million)
- TABLE Middle East and Africa E Bikes Electric Motor Market, by E-bike Type, 2018-2030 (USD Million)
- TABLE Middle East and Africa E Bikes Electric Motor Market, by Capacity, 2018-2030 (USD Million)
REPORT HIGHLIGHT
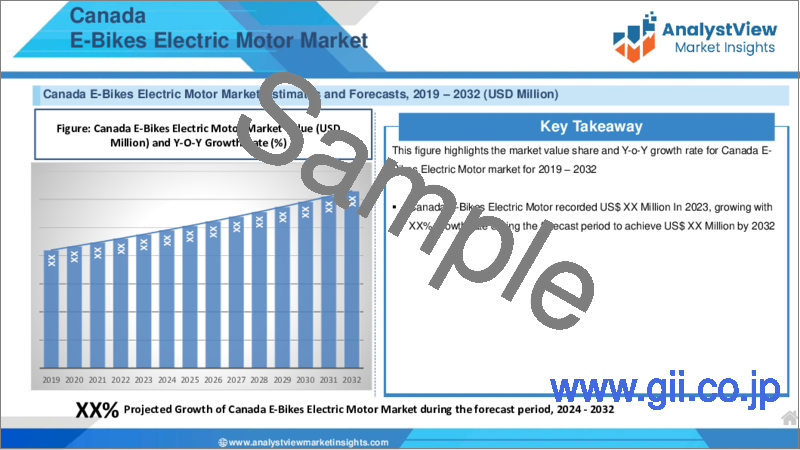
E Bikes Electric Motor Market size was valued at USD 34,543.34 Million in 2023, expanding at a CAGR of 12.5% from 2023 to 2030.
Rechargeable batteries are used in the motor of e-bikes, which may reach speeds of up to 25 to 32 km/h (16 to 20 mph). A planetary reduction gear within the electric bike motor lowers the rpm to the proper speed for a bike wheel.
E Bikes Electric Motor Market- Market Dynamics
Increasing emphasis on sustainable transportation, and clean energy is to propel market demand
Several factors, including the increased emphasis on sustainable transportation, health consciousness, and environmentally friendly transportation, the market for electric bike motors is currently expanding quickly. Major cities across the globe are experiencing high levels of pollution due to an increase in vehicle gas emissions and noise. Global sales of e-bikes are being driven by the healthy growth rate of the demand for high-performance vehicles and renewable energy.
Further, over the forecast period, it is expected that the growth of e-bike E-bike Types in several industries, including logistics and e-bike rental services, will drive demand for e-bike motors. Furthermore, because of their ease and low operating costs, e-bike demand has been rising. Furthermore, governments and international organizations throughout the world are passing strict emission standards to lower carbon emission levels in response to the ever-growing environmental and health problems brought on by the rising emission levels. Furthermore, during the forecast period, it is predicted that the development of high-performance e-bikes will considerably contribute to driving demand for e-bike motors.
E Bikes Electric Motor Market- Key Insights
As per the analysis shared by our research analyst, the global market is estimated to grow annually at a CAGR of around 12.5% over the forecast period (2024-2030)
Based on Motor Type segmentation, the mid drive segment was predicted to show maximum market share in the year 2023, owing to high demand from e-bikes, scooters, etc.
Based on E-bike Type segmentation, the urban segment was the leading E-bike Type in 2023, mainly due to increasing demand for e-bikes in urban areas.
Based on Capacity segmentation, the 250W-500W segment was the leading Capacity in 2023, mainly due to the high demand for e bicycles, and bikes.
Based on region, Asia Pacific was the leading revenue generator in 2023, owing to the rapid urbanization across China, Indonesia, Japan, etc.
E Bikes Electric Motor Market- Segmentation Analysis:
The Global E Bikes Electric Motor Market is segmented based on Motor Type, E-bike Type, Capacity, and Region.
The market is divided into four categories based on Motor Type: mid-drive, direct drive hub motor, geared hub motor, and friction motor. The mid drive segment dominates the market. The increasing adoption of e-bikes rental services is likely to contribute to market growth.
The market is divided into three categories based on E-bike Type: Urban, E-mountain/E-MTB, and E-cargo. The urban segment dominates the market and is likely to maintain its dominance during the forecast period. Rising demand for e-bikes in urban territories is anticipated to boost the market growth.
The market is divided into three categories based on Capacity: below 250W, 250W- 500W, and 500W & Above. The 250W- 500W segment dominates the market and is likely to maintain its dominance during the forecast period. The rise in the demand for mid power leveled e-bikes (250W) is expected to grow significantly over the forecast period.
E Bikes Electric Motor Market- Geographical Insights
Geographically, this market is widespread in the regions of North America, Latin America, Europe, Asia Pacific, and the Middle East and Africa. These regions are further divided as per the nations bringing business.
E Bikes Electric Motor Market- Competitive Landscape:
E Bikes Electric Motor Market is moderately fragmented and is formed by domestic and international players. Over the past few years, China has accounted for over 50% of the Asia-Pacific e-bike motor market, largely because of the country's increasing use of electric bikes to combat traffic jams and rising levels of automobile pollution. The China Bicycle Association reports that in recent years, the country's annual sales of electric bicycles have increased to 30 million units. The Indian e-bike motor market is still in its early stages, with several regional businesses providing a wide range of goods. For example, in the EM Summit 2023 held in January 2023, EMotorad introduced India's most reasonably priced line of e-bikes.
Recent Developments:
In August 2023, Bosch GmbH introduced its brand-new lightweight e-bike motor, the Bosch Performance SX, intended for lightweight e-bikes, gravel, EMTB, or urban rides.
In April 2023, Dost Bikes, one of the leading e-bike manufacturers in Canada, launched a slick-looking electric cargo bike.
In May 2023, Yamaha introduced two new electric Urban Mobility models, BOOSTER Easy eBike and BOOSTER S-pedelec.
SCOPE OF THE REPORT
The scope of this report covers the market by its major segments, which include as follows:
GLOBAL E BIKES ELECTRIC MOTOR MARKET KEY PLAYERS
- TDCM Corporation Limited
- Robert Bosch GmbH
- Suzhou Xiongda Motor Co. Ltd
- Yamaha Motor Co. Ltd
- Dapu Motors
- Suzhou Bafang Electric Motor Science-Technology Co. Ltd
- Panasonic Corporation
- Derby Cycle Holding
- Continental AG
- TRANZX
- Shimano Inc.
- Nidec Corporation
- Sporttech
- Handels GmbH
- Others
GLOBAL E BIKES ELECTRIC MOTOR MARKET, BY MOTOR TYPE
- Mid-drive
- Direct drive hub motor
- Geared hub motor
- Friction motor
GLOBAL E BIKES ELECTRIC MOTOR MARKET, BY E-BIKE TYPE
- Urban
- E-mountain/E-MTB
- E-cargo
GLOBAL E BIKES ELECTRIC MOTOR MARKET, BY CAPACITY
- Below 250W
- 250W- 500W
- 500W & Above
GLOBAL E BIKES ELECTRIC MOTOR MARKET, BY REGION
- North America
- The U.S.
- Canada
- Europe
- Germany
- France
- Italy
- Spain
- United Kingdom
- Russia
- Netherlands
- Sweden
- Poland
- Rest of Europe
- Asia Pacific
- India
- China
- South Korea
- Japan
- Australia
- Thailand
- Indonesia
- Philippines
- Rest of APAC
- Latin America
- Brazil
- Mexico
- Argentina
- Colombia
- Rest of LATAM
- The Middle East and Africa
- Saudi Arabia
- United Arab Emirates
- Israel
- Turkey
- Algeria
- Egypt
- Rest of MEA
Table of Contents
1.E Bikes Electric Motor Market Overview
- 1.1.Study Scope
- 1.2.Market Estimation Years
2.Executive Summary
- 2.1.Market Snippet
- 2.1.1.E Bikes Electric Motor Market Snippet by Motor Type
- 2.1.2.E Bikes Electric Motor Market Snippet by E-bike Type
- 2.1.3.E Bikes Electric Motor Market Snippet by Capacity
- 2.1.4.E Bikes Electric Motor Market Snippet by Country
- 2.1.5.E Bikes Electric Motor Market Snippet by Region
- 2.2.Competitive Insights
3.E Bikes Electric Motor Key Market Trends
- 3.1.E Bikes Electric Motor Market Drivers
- 3.1.1.Impact Analysis of Market Drivers
- 3.2.E Bikes Electric Motor Market Restraints
- 3.2.1.Impact Analysis of Market Restraints
- 3.3.E Bikes Electric Motor Market Opportunities
- 3.4.E Bikes Electric Motor Market Future Trends
4.E Bikes Electric Motor Industry Study
- 4.1.PEST Analysis
- 4.2.Porter's Five Forces Analysis
- 4.3.Growth Prospect Mapping
- 4.4.Regulatory Framework Analysis
5.E Bikes Electric Motor Market: COVID-19 Impact Analysis
- 5.1.Pre-COVID-19 Impact Analysis
- 5.2.Post-COVID-19 Impact Analysis
- 5.2.1.Top Performing Segments
- 5.2.2.Marginal Growth Segments
- 5.2.3.Top Looser Segments
- 5.2.4.Marginal Loss Segments
6.E Bikes Electric Motor Market Landscape
- 6.1.E Bikes Electric Motor Market Share Analysis, 2023
- 6.2.Breakdown Data, by Key Manufacturer
- 6.2.1.Established Players' Analysis
- 6.2.2.Emerging Players' Analysis
7.E Bikes Electric Motor Market - By Motor Type
- 7.1.Overview
- 7.1.1.Segment Share Analysis, By Motor Type, 2023 & 2030 (%)
- 7.1.2.Mid-drive
- 7.1.3.Direct drive hub motor
- 7.1.4.Geared hub motor
- 7.1.5.Friction motor
8.E Bikes Electric Motor Market - By E-bike Type
- 8.1.Overview
- 8.1.1.Segment Share Analysis, By E-bike Type, 2023 & 2030 (%)
- 8.1.2.Urban
- 8.1.3.E-mountain/E-MTB
- 8.1.4.E-cargo
9.E Bikes Electric Motor Market - By Capacity
- 9.1.Overview
- 9.1.1.Segment Share Analysis, By Capacity, 2023 & 2030 (%)
- 9.1.2.Below 250W
- 9.1.3.250W- 500W
- 9.1.4.500W & Above
10.E Bikes Electric Motor Market- By Geography
- 10.1.Introduction
- 10.1.1.Segment Share Analysis, By Geography, 2023 & 2030 (%)
- 10.2.North America
- 10.2.1.Overview
- 10.2.2.E Bikes Electric Motor Key Manufacturers in North America
- 10.2.3.North America Market Size and Forecast, By Country, 2018 - 2030 (US$ Million)
- 10.2.4.North America Market Size and Forecast, By Motor Type, 2018 - 2030 (US$ Million)
- 10.2.5.North America Market Size and Forecast, By E-bike Type, 2018 - 2030 (US$ Million)
- 10.2.6.North America Market Size and Forecast, By Capacity, 2018 - 2030 (US$ Million)
- 10.2.7.U.S.
- 10.2.7.1.Overview
- 10.2.7.2.Market Analysis, Forecast, and Y-O-Y Growth Rate, 2018 - 2030, (US$ Million)
- 10.2.7.3.U.S. Market Size and Forecast, By Motor Type, 2018 - 2030 (US$ Million)
- 10.2.7.4.U.S. Market Size and Forecast, By E-bike Type, 2018 - 2030 (US$ Million)
- 10.2.7.5.U.S. Market Size and Forecast, By Capacity, 2018 - 2030 (US$ Million)
- 10.2.8.Canada
- 10.2.8.1.Overview
- 10.2.8.2.Market Analysis, Forecast, and Y-O-Y Growth Rate, 2018 - 2030, (US$ Million)
- 10.2.8.3.Canada Market Size and Forecast, By Motor Type, 2018 - 2030 (US$ Million)
- 10.2.8.4.Canada Market Size and Forecast, By E-bike Type, 2018 - 2030 (US$ Million)
- 10.2.8.5.Canada Market Size and Forecast, By Capacity, 2018 - 2030 (US$ Million)
- 10.3.Europe
- 10.3.1.Overview
- 10.3.2.E Bikes Electric Motor Key Manufacturers in Europe
- 10.3.3.Europe Market Size and Forecast, By Country, 2018 - 2030 (US$ Million)
- 10.3.4.Europe Market Size and Forecast, By Motor Type, 2018 - 2030 (US$ Million)
- 10.3.5.Europe Market Size and Forecast, By E-bike Type, 2018 - 2030 (US$ Million)
- 10.3.6.Europe Market Size and Forecast, By Capacity, 2018 - 2030 (US$ Million)
- 10.3.7.Germany
- 10.3.7.1.Overview
- 10.3.7.2.Market Analysis, Forecast, and Y-O-Y Growth Rate, 2018 - 2030, (US$ Million)
- 10.3.7.3.Germany Market Size and Forecast, By Motor Type, 2018 - 2030 (US$ Million)
- 10.3.7.4.Germany Market Size and Forecast, By E-bike Type, 2018 - 2030 (US$ Million)
- 10.3.7.5.Germany Market Size and Forecast, By Capacity, 2018 - 2030 (US$ Million)
- 10.3.8.Italy
- 10.3.8.1.Overview
- 10.3.8.2.Market Analysis, Forecast, and Y-O-Y Growth Rate, 2018 - 2030, (US$ Million)
- 10.3.8.3.Italy Market Size and Forecast, By Motor Type, 2018 - 2030 (US$ Million)
- 10.3.8.4.Italy Market Size and Forecast, By E-bike Type, 2018 - 2030 (US$ Million)
- 10.3.8.5.Italy Market Size and Forecast, By Capacity, 2018 - 2030 (US$ Million)
- 10.3.9.United Kingdom
- 10.3.9.1.Overview
- 10.3.9.2.Market Analysis, Forecast, and Y-O-Y Growth Rate, 2018 - 2030, (US$ Million)
- 10.3.9.3.United Kingdom Market Size and Forecast, By Motor Type, 2018 - 2030 (US$ Million)
- 10.3.9.4.United Kingdom Market Size and Forecast, By E-bike Type, 2018 - 2030 (US$ Million)
- 10.3.9.5.United Kingdom Market Size and Forecast, By Capacity, 2018 - 2030 (US$ Million)
- 10.3.10.France
- 10.3.10.1.Overview
- 10.3.10.2.Market Analysis, Forecast, and Y-O-Y Growth Rate, 2018 - 2030, (US$ Million)
- 10.3.10.3.France Market Size and Forecast, By Motor Type, 2018 - 2030 (US$ Million)
- 10.3.10.4.France Market Size and Forecast, By E-bike Type, 2018 - 2030 (US$ Million)
- 10.3.10.5.France Market Size and Forecast, By Capacity, 2018 - 2030 (US$ Million)
- 10.3.11.Russia
- 10.3.11.1.Market Analysis, Forecast, and Y-O-Y Growth Rate, 2018 - 2030, (US$ Million)
- 10.3.11.2.Russia Market Size and Forecast, By Motor Type, 2018 - 2030 (US$ Million)
- 10.3.11.3.Russia Market Size and Forecast, By E-bike Type, 2018 - 2030 (US$ Million)
- 10.3.11.4.Russia Market Size and Forecast, By Capacity, 2018 - 2030 (US$ Million)
- 10.3.12.Netherlands
- 10.3.12.1.Market Analysis, Forecast, and Y-O-Y Growth Rate, 2018 - 2030, (US$ Million)
- 10.3.12.2.Netherlands Market Size and Forecast, By Motor Type, 2018 - 2030 (US$ Million)
- 10.3.12.3.Netherlands Market Size and Forecast, By E-bike Type, 2018 - 2030 (US$ Million)
- 10.3.12.4.Netherlands Market Size and Forecast, By Capacity, 2018 - 2030 (US$ Million)
- 10.3.13.Sweden
- 10.3.13.1.Market Analysis, Forecast, and Y-O-Y Growth Rate, 2018 - 2030, (US$ Million)
- 10.3.13.2.Sweden Market Size and Forecast, By Motor Type, 2018 - 2030 (US$ Million)
- 10.3.13.3.Sweden Market Size and Forecast, By E-bike Type, 2018 - 2030 (US$ Million)
- 10.3.13.4.Sweden Market Size and Forecast, By Capacity, 2018 - 2030 (US$ Million)
- 10.3.14.Poland
- 10.3.14.1.Market Analysis, Forecast, and Y-O-Y Growth Rate, 2018 - 2030, (US$ Million)
- 10.3.14.2.Poland Market Size and Forecast, By Motor Type, 2018 - 2030 (US$ Million)
- 10.3.14.3.Poland Market Size and Forecast, By E-bike Type, 2018 - 2030 (US$ Million)
- 10.3.14.4.Poland Market Size and Forecast, By Capacity, 2018 - 2030 (US$ Million)
- 10.3.15.Rest of Europe
- 10.3.15.1.Overview
- 10.3.15.2.Market Analysis, Forecast, and Y-O-Y Growth Rate, 2018 - 2030, (US$ Million)
- 10.3.15.3.Rest of the Europe Market Size and Forecast, By Motor Type, 2018 - 2030 (US$ Million)
- 10.3.15.4.Rest of the Europe Market Size and Forecast, By E-bike Type, 2018 - 2030 (US$ Million)
- 10.3.15.5.Rest of the Europe Market Size and Forecast, By Capacity, 2018 - 2030 (US$ Million)
- 10.4.Asia Pacific (APAC)
- 10.4.1.Overview
- 10.4.2.E Bikes Electric Motor Key Manufacturers in Asia Pacific
- 10.4.3.Asia Pacific Market Size and Forecast, By Country, 2018 - 2030 (US$ Million)
- 10.4.4.Asia Pacific Market Size and Forecast, By Motor Type, 2018 - 2030 (US$ Million)
- 10.4.5.Asia Pacific Market Size and Forecast, By E-bike Type, 2018 - 2030 (US$ Million)
- 10.4.6.Asia Pacific Market Size and Forecast, By Capacity, 2018 - 2030 (US$ Million)
- 10.4.7.India
- 10.4.7.1.Overview
- 10.4.7.2.Market Analysis, Forecast, and Y-O-Y Growth Rate, 2018 - 2030, (US$ Million)
- 10.4.7.3.India Market Size and Forecast, By Motor Type, 2018 - 2030 (US$ Million)
- 10.4.7.4.India Market Size and Forecast, By E-bike Type, 2018 - 2030 (US$ Million)
- 10.4.7.5.India Market Size and Forecast, By Capacity, 2018 - 2030 (US$ Million)
- 10.4.8.China
- 10.4.8.1.Overview
- 10.4.8.2.Market Analysis, Forecast, and Y-O-Y Growth Rate, 2018 - 2030, (US$ Million)
- 10.4.8.3.China Market Size and Forecast, By Motor Type, 2018 - 2030 (US$ Million)
- 10.4.8.4.China Market Size and Forecast, By E-bike Type, 2018 - 2030 (US$ Million)
- 10.4.8.5.China Market Size and Forecast, By Capacity, 2018 - 2030 (US$ Million)
- 10.4.9.Japan
- 10.4.9.1.Overview
- 10.4.9.2.Market Analysis, Forecast, and Y-O-Y Growth Rate, 2018 - 2030, (US$ Million)
- 10.4.9.3.Japan Market Size and Forecast, By Motor Type, 2018 - 2030 (US$ Million)
- 10.4.9.4.Japan Market Size and Forecast, By E-bike Type, 2018 - 2030 (US$ Million)
- 10.4.9.5.Japan Market Size and Forecast, By Capacity, 2018 - 2030 (US$ Million)
- 10.4.10.South Korea
- 10.4.10.1.Overview
- 10.4.10.2.Market Analysis, Forecast, and Y-O-Y Growth Rate, 2018 - 2030, (US$ Million)
- 10.4.10.3.South Korea Market Size and Forecast, By Motor Type, 2018 - 2030 (US$ Million)
- 10.4.10.4.South Korea Market Size and Forecast, By E-bike Type, 2018 - 2030 (US$ Million)
- 10.4.10.5.South Korea Market Size and Forecast, By Capacity, 2018 - 2030 (US$ Million)
- 10.4.11.Australia
- 10.4.11.1.Overview
- 10.4.11.2.Market Analysis, Forecast, and Y-O-Y Growth Rate, 2018 - 2030, (US$ Million)
- 10.4.11.3.Australia Market Size and Forecast, By Motor Type, 2018 - 2030 (US$ Million)
- 10.4.11.4.Australia Market Size and Forecast, By E-bike Type, 2018 - 2030 (US$ Million)
- 10.4.11.5.Australia Market Size and Forecast, By Capacity, 2018 - 2030 (US$ Million)
- 10.4.12.Thailand
- 10.4.12.1.Overview
- 10.4.12.2.Market Analysis, Forecast, and Y-O-Y Growth Rate, 2018 - 2030, (US$ Million)
- 10.4.12.3.Thailand Market Size and Forecast, By Motor Type, 2018 - 2030 (US$ Million)
- 10.4.12.4.Thailand Market Size and Forecast, By E-bike Type, 2018 - 2030 (US$ Million)
- 10.4.12.5.Thailand Market Size and Forecast, By Capacity, 2018 - 2030 (US$ Million)
- 10.4.13.Indonesia
- 10.4.13.1.Overview
- 10.4.13.2.Market Analysis, Forecast, and Y-O-Y Growth Rate, 2018 - 2030, (US$ Million)
- 10.4.13.3.Indonesia Market Size and Forecast, By Motor Type, 2018 - 2030 (US$ Million)
- 10.4.13.4.Indonesia Market Size and Forecast, By E-bike Type, 2018 - 2030 (US$ Million)
- 10.4.13.5.Indonesia Market Size and Forecast, By Capacity, 2018 - 2030 (US$ Million)
- 10.4.14.Philippines
- 10.4.14.1.Overview
- 10.4.14.2.Market Analysis, Forecast, and Y-O-Y Growth Rate, 2018 - 2030, (US$ Million)
- 10.4.14.3.Philippines Market Size and Forecast, By Motor Type, 2018 - 2030 (US$ Million)
- 10.4.14.4.Philippines Market Size and Forecast, By E-bike Type, 2018 - 2030 (US$ Million)
- 10.4.14.5.Philippines Market Size and Forecast, By Capacity, 2018 - 2030 (US$ Million)
- 10.4.15.Rest of APAC
- 10.4.15.1.Overview
- 10.4.15.2.Market Analysis, Forecast, and Y-O-Y Growth Rate, 2018 - 2030, (US$ Million)
- 10.4.15.3.Rest of APAC Market Size and Forecast, By Motor Type, 2018 - 2030 (US$ Million)
- 10.4.15.4.Rest of APAC Market Size and Forecast, By E-bike Type, 2018 - 2030 (US$ Million)
- 10.4.15.5.Rest of APAC Market Size and Forecast, By Capacity, 2018 - 2030 (US$ Million)
- 10.5.Latin America
- 10.5.1.Overview
- 10.5.2.E Bikes Electric Motor Key Manufacturers in Latin America
- 10.5.3.Latin America Market Size and Forecast, By Country, 2018 - 2030 (US$ Million)
- 10.5.4.Latin America Market Size and Forecast, By Motor Type, 2018 - 2030 (US$ Million)
- 10.5.5.Latin America Market Size and Forecast, By E-bike Type, 2018 - 2030 (US$ Million)
- 10.5.6.Latin America Market Size and Forecast, By Capacity, 2018 - 2030 (US$ Million)
- 10.5.7.Brazil
- 10.5.7.1.Overview
- 10.5.7.2.Market Analysis, Forecast, and Y-O-Y Growth Rate, 2018 - 2030, (US$ Million)
- 10.5.7.3.Brazil Market Size and Forecast, By Motor Type, 2018 - 2030 (US$ Million)
- 10.5.7.4.Brazil Market Size and Forecast, By E-bike Type, 2018 - 2030 (US$ Million)
- 10.5.7.5.Brazil Market Size and Forecast, By Capacity, 2018 - 2030 (US$ Million)
- 10.5.8.Mexico
- 10.5.8.1.Overview
- 10.5.8.2.Market Analysis, Forecast, and Y-O-Y Growth Rate, 2018 - 2030, (US$ Million)
- 10.5.8.3.Mexico Market Size and Forecast, By Motor Type, 2018 - 2030 (US$ Million)
- 10.5.8.4.Mexico Market Size and Forecast, By E-bike Type, 2018 - 2030 (US$ Million)
- 10.5.8.5.Mexico Market Size and Forecast, By Capacity, 2018 - 2030 (US$ Million)
- 10.5.9.Argentina
- 10.5.9.1.Overview
- 10.5.9.2.Market Analysis, Forecast, and Y-O-Y Growth Rate, 2018 - 2030, (US$ Million)
- 10.5.9.3.Argentina Market Size and Forecast, By Motor Type, 2018 - 2030 (US$ Million)
- 10.5.9.4.Argentina Market Size and Forecast, By E-bike Type, 2018 - 2030 (US$ Million)
- 10.5.9.5.Argentina Market Size and Forecast, By Capacity, 2018 - 2030 (US$ Million)
- 10.5.10.Colombia
- 10.5.10.1.Overview
- 10.5.10.2.Market Analysis, Forecast, and Y-O-Y Growth Rate, 2018 - 2030, (US$ Million)
- 10.5.10.3.Colombia Market Size and Forecast, By Motor Type, 2018 - 2030 (US$ Million)
- 10.5.10.4.Colombia Market Size and Forecast, By E-bike Type, 2018 - 2030 (US$ Million)
- 10.5.10.5.Colombia Market Size and Forecast, By Capacity, 2018 - 2030 (US$ Million)
- 10.5.11.Rest of LATAM
- 10.5.11.1.Overview
- 10.5.11.2.Market Analysis, Forecast, and Y-O-Y Growth Rate, 2018 - 2030, (US$ Million)
- 10.5.11.3.Rest of LATAM Market Size and Forecast, By Motor Type, 2018 - 2030 (US$ Million)
- 10.5.11.4.Rest of LATAM Market Size and Forecast, By E-bike Type, 2018 - 2030 (US$ Million)
- 10.5.11.5.Rest of LATAM Market Size and Forecast, By Capacity, 2018 - 2030 (US$ Million)
- 10.6.Middle East and Africa
- 10.6.1.Overview
- 10.6.2.E Bikes Electric Motor Key Manufacturers in Middle East and Africa
- 10.6.3.Middle East and Africa Market Size and Forecast, By Country, 2018 - 2030 (US$ Million)
- 10.6.4.Middle East and Africa Market Size and Forecast, By Motor Type, 2018 - 2030 (US$ Million)
- 10.6.5.Middle East and Africa Market Size and Forecast, By E-bike Type, 2018 - 2030 (US$ Million)
- 10.6.6.Middle East and Africa Market Size and Forecast, By Capacity, 2018 - 2030 (US$ Million)
- 10.6.7.Saudi Arabia
- 10.6.7.1.Overview
- 10.6.7.2.Market Analysis, Forecast, and Y-O-Y Growth Rate, 2018 - 2030, (US$ Million)
- 10.6.7.3.Saudi Arabia Market Size and Forecast, By Motor Type, 2018 - 2030 (US$ Million)
- 10.6.7.4.Saudi Arabia Market Size and Forecast, By E-bike Type, 2018 - 2030 (US$ Million)
- 10.6.7.5.Saudi Arabia Market Size and Forecast, By Capacity, 2018 - 2030 (US$ Million)
- 10.6.8.United Arab Emirates
- 10.6.8.1.Overview
- 10.6.8.2.Market Analysis, Forecast, and Y-O-Y Growth Rate, 2018 - 2030, (US$ Million)
- 10.6.8.3.United Arab Emirates Market Size and Forecast, By Motor Type, 2018 - 2030 (US$ Million)
- 10.6.8.4.United Arab Emirates Market Size and Forecast, By E-bike Type, 2018 - 2030 (US$ Million)
- 10.6.8.5.United Arab Emirates Market Size and Forecast, By Capacity, 2018 - 2030 (US$ Million)
- 10.6.9.Israel
- 10.6.9.1.Overview
- 10.6.9.2.Market Analysis, Forecast, and Y-O-Y Growth Rate, 2018 - 2030, (US$ Million)
- 10.6.9.3.Israel Market Size and Forecast, By Motor Type, 2018 - 2030 (US$ Million)
- 10.6.9.4.Israel Market Size and Forecast, By E-bike Type, 2018 - 2030 (US$ Million)
- 10.6.9.5.Israel Market Size and Forecast, By Capacity, 2018 - 2030 (US$ Million)
- 10.6.10.Turkey
- 10.6.10.1.Overview
- 10.6.10.2.Market Analysis, Forecast, and Y-O-Y Growth Rate, 2018 - 2030, (US$ Million)
- 10.6.10.3.Turkey Market Size and Forecast, By Motor Type, 2018 - 2030 (US$ Million)
- 10.6.10.4.Turkey Market Size and Forecast, By E-bike Type, 2018 - 2030 (US$ Million)
- 10.6.10.5.Turkey Market Size and Forecast, By Capacity, 2018 - 2030 (US$ Million)
- 10.6.11.Algeria
- 10.6.11.1.Overview
- 10.6.11.2.Market Analysis, Forecast, and Y-O-Y Growth Rate, 2018 - 2030, (US$ Million)
- 10.6.11.3.Algeria Market Size and Forecast, By Motor Type, 2018 - 2030 (US$ Million)
- 10.6.11.4.Algeria Market Size and Forecast, By E-bike Type, 2018 - 2030 (US$ Million)
- 10.6.11.5.Algeria Market Size and Forecast, By Capacity, 2018 - 2030 (US$ Million)
- 10.6.12.Egypt
- 10.6.12.1.Overview
- 10.6.12.2.Market Analysis, Forecast, and Y-O-Y Growth Rate, 2018 - 2030, (US$ Million)
- 10.6.12.3.Egypt Market Size and Forecast, By Motor Type, 2018 - 2030 (US$ Million)
- 10.6.12.4.Egypt Market Size and Forecast, By E-bike Type, 2018 - 2030 (US$ Million)
- 10.6.12.5.Egypt Market Size and Forecast, By Capacity, 2018 - 2030 (US$ Million)
- 10.6.13.Rest of MEA
- 10.6.13.1.Overview
- 10.6.13.2.Market Analysis, Forecast, and Y-O-Y Growth Rate, 2018 - 2030, (US$ Million)
- 10.6.13.3.Rest of MEA Market Size and Forecast, By Motor Type, 2018 - 2030 (US$ Million)
- 10.6.13.4.Rest of MEA Market Size and Forecast, By E-bike Type, 2018 - 2030 (US$ Million)
- 10.6.13.5.Rest of MEA Market Size and Forecast, By Capacity, 2018 - 2030 (US$ Million)
11.Key Vendor Analysis- E Bikes Electric Motor Industry
- 11.1.Competitive Dashboard
- 11.2.Company Profiles
- 11.2.1.TDCM Corporation Limited
- 11.2.2.Robert Bosch GmbH
- 11.2.3.Suzhou Xiongda Motor Co. Ltd
- 11.2.4.Yamaha Motor Co. Ltd
- 11.2.5.Dapu Motors
- 11.2.6.Suzhou Bafang Electric Motor Science-Technology Co. Ltd
- 11.2.7.Panasonic Corporation
- 11.2.8.Derby Cycle Holding
- 11.2.9.Continental AG
- 11.2.10.TRANZX
- 11.2.11.Shimano Inc.
- 11.2.12.Nidec corporation
- 11.2.13.Sporttech
- 11.2.14.Handels GmbH
- 11.2.15.Others
12.360 Degree Analyst View
13.Appendix
- 13.1.Research Methodology
- 13.2.References
- 13.3.Abbreviations
- 13.4.Disclaimer
- 13.5.Contact Us
