|
|
市場調査レポート
商品コード
1485736
DAC(直接空気回収)市場:技術タイプ別、用途別、規模・容量別、エンドユーザー別、国別、地域別- 産業分析、市場規模、市場シェア、2024年~2032年予測Direct Air Capture Market, By Technology Type, By Application, By Scale or Capacity, By End-User, By Country, and By Region - Industry Analysis, Market Size, Market Share & Forecast from 2024-2032 |
||||||
|
|||||||
カスタマイズ可能
|
|||||||

| DAC(直接空気回収)市場:技術タイプ別、用途別、規模・容量別、エンドユーザー別、国別、地域別- 産業分析、市場規模、市場シェア、2024年~2032年予測 |
|
出版日: 2024年04月13日
発行: AnalystView Market Insights
ページ情報: 英文 276 Pages
納期: 2~3営業日
|

全表示
- 概要
- 図表
- 目次
レポートハイライト
DAC(直接空気回収)の市場規模は2023年に6,345万米ドルとなり、2024年から2032年にかけて59.6%のCAGRで拡大
DAC(直接空気回収)市場-市場力学
政府の政策がDACシステム市場の成長を促進
特に各国が気候変動を緩和する取り組みを優先しているため、政府の政策や取り組みが世界のDAC(直接空気回収)システム市場の大幅な成長を促進しています。多くの政府は、DAC技術の開発と採用にインセンティブを与えるため、特定の政策、資金提供プログラム、規制枠組みを実施しています。例えば、2020年9月、ノルウェーは、政府の多額の投資によって支援されたロングシップCCSプロジェクトを開始しました。このプロジェクトには、産業資源から排出されるCO2を回収するDAC施設の計画が含まれています。米国では、連邦政府の資金援助と税制優遇措置が、より広範な炭素回収イニシアチブの一環として、DACシステムの研究と展開に向けられています。これらの措置は、DACのような革新的な炭素回収技術の採用を加速するための世界の協調努力を反映しており、市場の状況を形成し、炭素排出削減のための持続可能な解決策を推進する上で、政府の政策が極めて重要な役割を果たしていることを浮き彫りにしています。
DAC(直接空気回収)市場-主要な洞察
当社のリサーチアナリストが共有した分析によると、世界市場は予測期間(2024-2032年)に約59.6%のCAGRで毎年成長すると推定されます。
技術タイプセグメンテーションに基づくと、化学吸収は2023年に最大市場シェアを示すと予測されました。
用途別では、炭素除去・貯留が2023年の主要タイプでした。
規模別では、大規模DACシステムが2023年の主要タイプでした。
地域別では、北米が2023年に収益でリードしました。
DAC(直接空気回収)市場-セグメンテーション分析:
世界の直接空気捕捉市場は、技術タイプ、用途、規模または容量、エンドユーザー、地域に基づいてセグメント化されます。
市場は技術タイプに基づいて4つのカテゴリーに分けられる:化学吸収、吸着、膜ベースの捕捉、生物学的プロセスです。化学吸収法は、溶剤ベースのプロセスを活用してCO2を効率的に回収するもので、圧倒的な地位を占めています。固体吸着剤などの吸着技術も、その汎用性から有望な成長を示しています。膜ベースの回収と生物学的プロセスは、持続可能で費用対効果の高い炭素回収ソリューションの可能性により、新たな選択肢となっています。
市場は用途によって4つのカテゴリーに分けられる:炭素除去・貯留、再生可能燃料生産、化学合成、石油増進回収です。炭素除去・貯留の用途は、CO2排出を緩和し気候変動と闘うという緊急課題によって支配的です。再生可能燃料の生産は、持続可能な燃料合成のために回収されたCO2を活用するものです。化学合成と石油増進回収の用途も、DAC技術採用の大きな機会を提供し、市場拡大に貢献しています。
DAC(直接空気回収)市場-地理的洞察
北米、特に米国とカナダでは、環境問題への関心と政府の支援政策により、DAC技術への関心と活動が高まっています。欧州もまたDAC開発の主要地域として際立っており、スイス、アイスランド、ドイツなどの国々が研究と導入の取り組みをリードしています。アジアでは、日本と韓国が気候変動緩和戦略の一環としてDACを模索しています。さらに、ラテンアメリカやアフリカの新興市場も、ペースは遅いもの、DACソリューションを模索し始めています。
DAC(直接空気回収)市場-競合情勢:
複数の主要プレーヤーが革新的な技術と戦略的パートナーシップで業界をリードしています。著名なプレーヤーであるカーボン・エンジニアリングは、周囲の空気からCO2を直接回収できる拡張性のあるDACシステムを開発しました。クライムワークスもまた、効果的な炭素除去のために世界中に配備されたモジュール式DACユニットを専門とする注目すべき企業です。Global Thermostatは、先進的な吸着剤ベースのDAC技術で知られ、炭素回収のためのユニークなソリューションを提供しています。新興企業と既存企業とのコラボレーションは、進歩を促進し、市場範囲を拡大しています。例えば、クライムワークスはアウディと提携し、カーボンニュートラルなモビリティ・ソリューションを推進しています。さらに、政府の支援やエネルギー企業との戦略的提携は、DAC技術の成長と採用に対する市場の潜在力をさらに強調しています。
目次
第1章 DAC(直接空気回収)市場概要
- 調査範囲
- 市場推定年
第2章 エグゼクティブサマリー
- 市場内訳
- 競合考察
第3章 DAC(直接空気回収)の主要市場動向
- 市場促進要因
- 市場抑制要因
- 市場機会
- 市場の将来動向
第4章 DAC(直接空気回収)産業の研究
- PEST分析
- ポーターのファイブフォース分析
- 成長見通しマッピング
- 規制枠組み分析
第5章 DAC(直接空気回収)市場: COVID-19の影響分析
- COVID-19以前の影響分析
- COVID-19後の影響分析
第6章 DAC(直接空気回収)市場情勢
- DAC(直接空気回収)市場シェア分析、2023年
- 主要メーカー別内訳データ
- 既存企業の分析
- 新興企業の分析
第7章 DAC(直接空気回収)市場:技術タイプ別
- 概要
- 技術タイプ別セグメントシェア分析
- 化学吸収
- 吸着
- 膜ベースの捕捉
- 生物学的プロセス
- その他
第8章 DAC(直接空気回収)市場:用途別
- 概要
- 用途別セグメントシェア分析
- 炭素除去と隔離
- 再生可能燃料の生産
- 化学合成
- 石油回収の強化
- その他
第9章 DAC(直接空気回収)市場:規模・容量別
- 概要
- 規模別または容量別のセグメントシェア分析
- 小規模DACシステム
- 中規模DACシステム
- 大規模DACシステム
- メガスケールDACシステム
第10章 DAC(直接空気回収)市場:エンドユーザー別
- 概要
- エンドユーザー別セグメントシェア分析
- 石油ガス
- 発電
- 製造業
- 輸送機関
- 農業
- その他の産業分野
第11章 DAC(直接空気回収)市場:地域別
- イントロダクション
- 北米
- 概要
- 北米の主要メーカー
- 米国
- カナダ
- 欧州
- 概要
- 欧州の主要メーカー
- ドイツ
- イタリア
- 英国
- フランス
- ロシア
- オランダ
- スウェーデン
- ポーランド
- その他
- アジア太平洋(APAC)
- 概要
- アジア太平洋地域の主要メーカー
- インド
- 中国
- 日本
- 韓国
- オーストラリア
- タイ
- インドネシア
- フィリピン
- その他
- ラテンアメリカ
- 概要
- ラテンアメリカの主要メーカー
- ブラジル
- メキシコ
- アルゼンチン
- コロンビア
- その他
- 中東およびアフリカ
- 概要
- 中東・アフリカの主要メーカー
- サウジアラビア
- アラブ首長国連邦
- イスラエル
- トルコ
- アルジェリア
- エジプト
- その他
第12章 主要ベンダー分析- DAC(直接空気回収)産業
- 競合ダッシュボード
- 企業プロファイル
- Carbon Engineering Ltd.
- Climeworks AG
- Global Thermostat LLC
- Infinitree Inc.
- Skytree
- Carbon Clean Solutions Limited
- CO2 Solutions Inc.
- Kiverdi Inc.
- Climatempo Group
- Solidia Technologies, Inc.
- C4X Discovery Holdings plc
- Zurich Carbon Capture Ltd.
- Carbon Cycle Ltd.
- GreenFuel Technologies Corporation
- Verdox GmbH
- Prometheus Fuels Inc.
- Others
第13章 アナリストの全方位展望
List of Tables
- TABLE List of data sources
- TABLE Market drivers; Impact Analysis
- TABLE Market restraints; Impact Analysis
- TABLE Direct Air Capture Market: Technology Type Snapshot (2023)
- TABLE Segment Dashboard; Definition and Scope, by Technology Type
- TABLE Global Direct Air Capture Market, by Technology Type 2019-2032 (USD Million)
- TABLE Direct Air Capture Market: Application Snapshot (2023)
- TABLE Segment Dashboard; Definition and Scope, by Application
- TABLE Global Direct Air Capture Market, by Application 2019-2032 (USD Million)
- TABLE Direct Air Capture Market: Scale or Capacity Snapshot (2023)
- TABLE Segment Dashboard; Definition and Scope, by Scale or Capacity
- TABLE Global Direct Air Capture Market, by Scale or Capacity 2019-2032 (USD Million)
- TABLE Direct Air Capture Market: End-User Snapshot (2023)
- TABLE Segment Dashboard; Definition and Scope, by End-User
- TABLE Global Direct Air Capture Market, by End-User 2019-2032 (USD Million)
- TABLE Direct Air Capture Market: Regional snapshot (2023)
- TABLE Segment Dashboard; Definition and Scope, by Region
- TABLE Global Direct Air Capture Market, by Region 2019-2032 (USD Million)
- TABLE North America Direct Air Capture Market, by Country, 2019-2032 (USD Million)
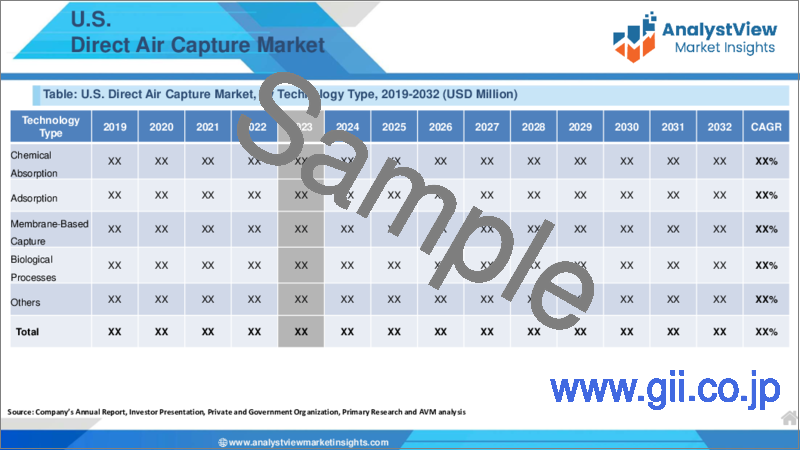
- TABLE North America Direct Air Capture Market, by Technology Type, 2019-2032 (USD Million)
- TABLE North America Direct Air Capture Market, by Application, 2019-2032 (USD Million)
- TABLE North America Direct Air Capture Market, by Scale or Capacity, 2019-2032 (USD Million)
- TABLE North America Direct Air Capture Market, by End-User, 2019-2032 (USD Million)
- TABLE Europe Direct Air Capture Market, by Country, 2019-2032 (USD Million)
- TABLE Europe Direct Air Capture Market, by Technology Type, 2019-2032 (USD Million)
- TABLE Europe Direct Air Capture Market, by Application, 2019-2032 (USD Million)
- TABLE Europe Direct Air Capture Market, by Scale or Capacity, 2019-2032 (USD Million)
- TABLE Europe Direct Air Capture Market, by End-User, 2019-2032 (USD Million)
- TABLE Asia Pacific Direct Air Capture Market, by Country, 2019-2032 (USD Million)
- TABLE Asia Pacific Direct Air Capture Market, by Technology Type, 2019-2032 (USD Million)
- TABLE Asia Pacific Direct Air Capture Market, by Application, 2019-2032 (USD Million)
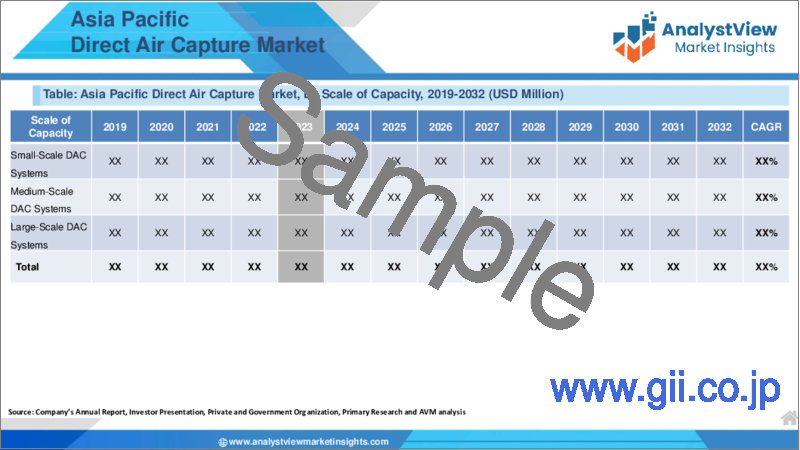
- TABLE Asia Pacific Direct Air Capture Market, by Scale or Capacity, 2019-2032 (USD Million)
- TABLE Asia Pacific Direct Air Capture Market, by End-User, 2019-2032 (USD Million)
- TABLE Latin America Direct Air Capture Market, by Country, 2019-2032 (USD Million)
- TABLE Latin America Direct Air Capture Market, by Technology Type, 2019-2032 (USD Million)
- TABLE Latin America Direct Air Capture Market, by Application, 2019-2032 (USD Million)
- TABLE Latin America Direct Air Capture Market, by Scale or Capacity, 2019-2032 (USD Million)
- TABLE Latin America Direct Air Capture Market, by End-User, 2019-2032 (USD Million)
- TABLE Middle East and Africa Direct Air Capture Market, by Country, 2019-2032 (USD Million)
- TABLE Middle East and Africa Direct Air Capture Market, by Technology Type, 2019-2032 (USD Million)
- TABLE Middle East and Africa Direct Air Capture Market, by Application, 2019-2032 (USD Million)
- TABLE Middle East and Africa Direct Air Capture Market, by Scale or Capacity, 2019-2032 (USD Million)
- TABLE Middle East and Africa Direct Air Capture Market, by End-User, 2019-2032 (USD Million)
REPORT HIGHLIGHT
Direct Air Capture Market size was valued at USD 63.45 Million in 2023, expanding at a CAGR of 59.6% from 2024 to 2032.
The Direct Air Capture market is primarily driven by the increasing global focus on mitigating climate change and reducing carbon emissions. Growing concerns about rising CO2 levels and their impact on the environment have prompted governments, organizations, and industries to explore innovative carbon capture solutions like DAC. However, challenges such as high initial capital costs, energy requirements, and scalability limitations remain key restraints for widespread adoption. Nonetheless, the market presents significant opportunities, including increasing government support through incentives and policies, partnerships between technology developers and industries, and the potential for DAC to contribute to carbon neutrality and sustainable development goals.
Direct Air Capture Market- Market Dynamics
Government Policies Drive Growth in the DAC Systems Market
Government policies and initiatives are driving substantial growth in the DAC (Direct Air Capture) systems market worldwide, particularly as countries prioritize efforts to mitigate climate change. Many governments have implemented specific policies, funding programs, and regulatory frameworks to incentivize the development and adoption of DAC technologies. For instance, in September 2020, Norway launched a Longship CCS project, supported by significant government investment, which includes plans for a DAC facility to capture CO2 emissions from industrial sources. In the United States, federal funding and tax incentives are being directed toward research and deployment of DAC systems as part of broader carbon capture initiatives. These measures reflect a concerted global effort to accelerate the adoption of innovative carbon capture technologies like DAC, highlighting the pivotal role of government policies in shaping the market landscape and driving sustainable solutions for carbon emissions reduction.
Direct Air Capture Market- Key Insights
As per the analysis shared by our research analyst, the global market is estimated to grow annually at a CAGR of around 59.6% over the forecast period (2024-2032)
Based on Technology type segmentation, Chemical Absorption was predicted to show maximum market share in the year 2023
Based on application segmentation, Carbon Removal & Sequestration was the leading type in 2023
Based on Scale or Capacity segmentation, Large-Scale DAC Systems was the leading type in 2023
Based on region, North America was the leading revenue generator in 2023
Direct Air Capture Market- Segmentation Analysis:
The Global Direct Air Capture Market is segmented based on Technology Type, Application, Scale or Capacity, End-User, and Region.
The market is divided into four categories based on Technology type: Chemical Absorption, Adsorption, Membrane-Based Capture, and Biological Processes. Chemical absorption holds a dominant position, leveraging solvent-based processes to capture CO2 efficiently. Adsorption technologies, such as solid sorbents, also show promising growth due to their versatility. Membrane-based capture and biological processes represent emerging alternatives, driven by their potential for sustainable and cost-effective carbon capture solutions.
The market is divided into four categories based on application: Carbon Removal & Sequestration, Renewable Fuel Production, Chemical Synthesis, and Enhanced Oil Recovery. carbon removal and sequestration applications dominate, driven by the urgency to mitigate CO2 emissions and combat climate change. Renewable fuel production follows closely, capitalizing on captured CO2 for sustainable fuel synthesis. Chemical synthesis and enhanced oil recovery applications also present significant opportunities for DAC technology adoption, contributing to market expansion.
Direct Air Capture Market- Geographical Insights
In North America, particularly the United States and Canada, there is significant interest and activity in DAC technologies driven by environmental concerns and supportive government policies. Europe also stands out as a key region for DAC development, with countries like Switzerland, Iceland, and Germany leading in research and implementation efforts. In Asia, Japan and South Korea are exploring DAC as part of their climate change mitigation strategies. Additionally, emerging markets in Latin America and Africa are beginning to explore DAC solutions, although at a slower pace.
Direct Air Capture Market- Competitive Landscape:
Several key players are leading the industry with innovative technologies and strategic partnerships. Carbon Engineering, a prominent player, has developed scalable DAC systems capable of capturing CO2 directly from ambient air. Climeworks is another notable company specializing in modular DAC units deployed worldwide for effective carbon removal. Global Thermostat is known for its advanced sorbent-based DAC technology, offering unique solutions for carbon capture. Collaborations between startups and established players are driving progress and expanding market reach. For instance, Climeworks has partnered with Audi to advance carbon-neutral mobility solutions. Additionally, government support and strategic alliances with energy companies further emphasize the market's potential for growth and adoption of DAC technologies.
Recent Developments:
In April 2024, ZeoDAC launched to commercialize an amine-free chemistry to capture carbon dioxide directly out of ambient air. The California Institute of Technology spinout has the financial backing of Coca-Cola, the California Institute of Technology, and three venture capital firms.
In November 2023, Southern California Gas Company and Avnos, Inc. announced the launch of the world's first commercial pilot project for Hybrid Direct Air Capture (HDAC) in Bakersfield, California. HDAC is a carbon removal technology that uses electricity to remove carbon dioxide from the air and produce water.
SCOPE OF THE REPORT
The scope of this report covers the market by its major segments, which include as follows:
GLOBAL DIRECT AIR CAPTURE MARKET KEY PLAYERS- DETAILED COMPETITIVE INSIGHTS
Carbon Engineering Ltd.
Climeworks AG
Global Thermostat LLC
Infinitree Inc.
Skytree
Carbon Clean Solutions Limited
CO2 Solutions Inc.
Kiverdi Inc.
Climatempo Group
Solidia Technologies, Inc.
C4X Discovery Holdings plc
Zurich Carbon Capture Ltd.
Carbon Cycle Ltd.
GreenFuel Technologies Corporation
Verdox GmbH
Prometheus Fuels Inc.
Others
GLOBAL DIRECT AIR CAPTURE MARKET, BY TECHNOLOGY TYPE- MARKET ANALYSIS, 2019 - 2032
- Chemical Absorption
- Adsorption
- Membrane-Based Capture
- Biological Processes
- Others
GLOBAL DIRECT AIR CAPTURE MARKET, BY APPLICATION- MARKET ANALYSIS, 2019 - 2032
- Carbon Removal & Sequestration
- Renewable Fuel Production
- Chemical Synthesis
- Enhanced Oil Recovery
- Other
GLOBAL DIRECT AIR CAPTURE MARKET, BY SCALE OR CAPACITY- MARKET ANALYSIS, 2019 - 2032
- Small-Scale DAC Systems
- Medium-Scale DAC Systems
- Large-Scale DAC Systems
- Mega-Scale DAC Systems
GLOBAL DIRECT AIR CAPTURE MARKET, BY END-USER- MARKET ANALYSIS, 2019 - 2032
- Oil & Gas
- Power Generation
- Manufacturing
- Transportation
- Agriculture
- Other Industrial Sectors
GLOBAL DIRECT AIR CAPTURE MARKET, BY REGION- MARKET ANALYSIS, 2019 - 2032
- North America
- The U.S.
- Canada
- Europe
- Germany
- France
- Italy
- Spain
- United Kingdom
- Russia
- Netherlands
- Sweden
- Poland
- Rest of Europe
- Asia Pacific
- India
- China
- South Korea
- Japan
- Australia
- Thailand
- Indonesia
- Philippines
- Rest of APAC
- Latin America
- Brazil
- Mexico
- Argentina
- Colombia
- Rest of LATAM
- The Middle East and Africa
- Saudi Arabia
- United Arab Emirates
- Israel
- Turkey
- Algeria
- Egypt
- Rest of MEA
Table of Contents
1.Direct Air Capture Market Overview
- 1.1.Study Scope
- 1.2.Market Estimation Years
2.Executive Summary
- 2.1.Market Snippet
- 2.1.1.Direct Air Capture Market Snippet by Technology Type
- 2.1.2.Direct Air Capture Market Snippet by Application
- 2.1.3.Direct Air Capture Market Snippet by Scale or Capacity
- 2.1.4.Direct Air Capture Market Snippet by End-User
- 2.1.5.Direct Air Capture Market Snippet by Country
- 2.1.6.Direct Air Capture Market Snippet by Region
- 2.2.Competitive Insights
3.Direct Air Capture Key Market Trends
- 3.1.Direct Air Capture Market Drivers
- 3.1.1.Impact Analysis of Market Drivers
- 3.2.Direct Air Capture Market Restraints
- 3.2.1.Impact Analysis of Market Restraints
- 3.3.Direct Air Capture Market Opportunities
- 3.4.Direct Air Capture Market Future Trends
4.Direct Air Capture Industry Study
- 4.1.PEST Analysis
- 4.2.Porter's Five Forces Analysis
- 4.3.Growth Prospect Mapping
- 4.4.Regulatory Framework Analysis
5.Direct Air Capture Market: COVID-19 Impact Analysis
- 5.1.Pre-COVID-19 Impact Analysis
- 5.2.Post-COVID-19 Impact Analysis
- 5.2.1.Top Performing Segments
- 5.2.2.Marginal Growth Segments
- 5.2.3.Top Looser Segments
- 5.2.4.Marginal Loss Segments
6.Direct Air Capture Market Landscape
- 6.1.Direct Air Capture Market Share Analysis, 2023
- 6.2.Breakdown Data, by Key Manufacturer
- 6.2.1.Established Players' Analysis
- 6.2.2.Emerging Players' Analysis
7.Direct Air Capture Market - By Technology Type
- 7.1.Overview
- 7.1.1.Segment Share Analysis, By Technology Type, 2023 & 2032 (%)
- 7.1.2.Chemical Absorption
- 7.1.3.Adsorption
- 7.1.4.Membrane-Based Capture
- 7.1.5.Biological Processes
- 7.1.6.Others
8.Direct Air Capture Market - By Application
- 8.1.Overview
- 8.1.1.Segment Share Analysis, By Application, 2023 & 2032 (%)
- 8.1.2.Carbon Removal & Sequestration
- 8.1.3.Renewable Fuel Production
- 8.1.4.Chemical Synthesis
- 8.1.5.Enhanced Oil Recovery
- 8.1.6.Other
9.Direct Air Capture Market - By Scale or Capacity
- 9.1.Overview
- 9.1.1.Segment Share Analysis, By Scale or Capacity, 2023 & 2032 (%)
- 9.1.2.Small-Scale DAC Systems
- 9.1.3.Medium-Scale DAC Systems
- 9.1.4.Large-Scale DAC Systems
- 9.1.5.Mega-Scale DAC Systems
10.Direct Air Capture Market - By End-User
- 10.1.Overview
- 10.1.1.Segment Share Analysis, By End-User, 2023 & 2032 (%)
- 10.1.2.Oil & Gas
- 10.1.3.Power Generation
- 10.1.4.Manufacturing
- 10.1.5.Transportation
- 10.1.6.Agriculture
- 10.1.7.Other Industrial Sectors
11.Direct Air Capture Market- By Geography
- 11.1.Introduction
- 11.1.1.Segment Share Analysis, By Geography, 2023 & 2032 (%)
- 11.2.North America
- 11.2.1.Overview
- 11.2.2.Direct Air Capture Key Manufacturers in North America
- 11.2.3.North America Market Size and Forecast, By Country, 2019 - 2032 (US$ Million)
- 11.2.4.North America Market Size and Forecast, By Technology Type, 2019 - 2032 (US$ Million)
- 11.2.5.North America Market Size and Forecast, By Application, 2019 - 2032 (US$ Million)
- 11.2.6.North America Market Size and Forecast, By Scale or Capacity, 2019 - 2032 (US$ Million)
- 11.2.7.North America Market Size and Forecast, By End-User, 2019 - 2032 (US$ Million)
- 11.2.8.U.S.
- 11.2.8.1.Overview
- 11.2.8.2.Market Analysis, Forecast, and Y-O-Y Growth Rate, 2019 - 2032, (US$ Million)
- 11.2.8.3.U.S. Market Size and Forecast, By Technology Type, 2019 - 2032 (US$ Million)
- 11.2.8.4.U.S. Market Size and Forecast, By Application, 2019 - 2032 (US$ Million)
- 11.2.8.5.U.S. Market Size and Forecast, By Scale or Capacity, 2019 - 2032 (US$ Million)
- 11.2.8.6.U.S. Market Size and Forecast, By End-User, 2019 - 2032 (US$ Million)
- 11.2.9.Canada
- 11.2.9.1.Overview
- 11.2.9.2.Market Analysis, Forecast, and Y-O-Y Growth Rate, 2019 - 2032, (US$ Million)
- 11.2.9.3.Canada Market Size and Forecast, By Technology Type, 2019 - 2032 (US$ Million)
- 11.2.9.4.Canada Market Size and Forecast, By Application, 2019 - 2032 (US$ Million)
- 11.2.9.5.Canada Market Size and Forecast, By Scale or Capacity, 2019 - 2032 (US$ Million)
- 11.2.9.6.Canada Market Size and Forecast, By End-User, 2019 - 2032 (US$ Million)
- 11.3.Europe
- 11.3.1.Overview
- 11.3.2.Direct Air Capture Key Manufacturers in Europe
- 11.3.3.Europe Market Size and Forecast, By Country, 2019 - 2032 (US$ Million)
- 11.3.4.Europe Market Size and Forecast, By Technology Type, 2019 - 2032 (US$ Million)
- 11.3.5.Europe Market Size and Forecast, By Application, 2019 - 2032 (US$ Million)
- 11.3.6.Europe Market Size and Forecast, By Scale or Capacity, 2019 - 2032 (US$ Million)
- 11.3.7.Europe Market Size and Forecast, By End-User, 2019 - 2032 (US$ Million)
- 11.3.8.Germany
- 11.3.8.1.Overview
- 11.3.8.2.Market Analysis, Forecast, and Y-O-Y Growth Rate, 2019 - 2032, (US$ Million)
- 11.3.8.3.Germany Market Size and Forecast, By Technology Type, 2019 - 2032 (US$ Million)
- 11.3.8.4.Germany Market Size and Forecast, By Application, 2019 - 2032 (US$ Million)
- 11.3.8.5.Germany Market Size and Forecast, By Scale or Capacity, 2019 - 2032 (US$ Million)
- 11.3.8.6.Germany Market Size and Forecast, By End-User, 2019 - 2032 (US$ Million)
- 11.3.9.Italy
- 11.3.9.1.Overview
- 11.3.9.2.Market Analysis, Forecast, and Y-O-Y Growth Rate, 2019 - 2032, (US$ Million)
- 11.3.9.3.Italy Market Size and Forecast, By Technology Type, 2019 - 2032 (US$ Million)
- 11.3.9.4.Italy Market Size and Forecast, By Application, 2019 - 2032 (US$ Million)
- 11.3.9.5.Italy Market Size and Forecast, By Scale or Capacity, 2019 - 2032 (US$ Million)
- 11.3.9.6.Italy Market Size and Forecast, By End-User, 2019 - 2032 (US$ Million)
- 11.3.10.United Kingdom
- 11.3.10.1.Overview
- 11.3.10.2.Market Analysis, Forecast, and Y-O-Y Growth Rate, 2019 - 2032, (US$ Million)
- 11.3.10.3.United Kingdom Market Size and Forecast, By Technology Type, 2019 - 2032 (US$ Million)
- 11.3.10.4.United Kingdom Market Size and Forecast, By Application, 2019 - 2032 (US$ Million)
- 11.3.10.5.United Kingdom Market Size and Forecast, By Scale or Capacity, 2019 - 2032 (US$ Million)
- 11.3.10.6.United Kingdom Market Size and Forecast, By End-User, 2019 - 2032 (US$ Million)
- 11.3.11.France
- 11.3.11.1.Overview
- 11.3.11.2.Market Analysis, Forecast, and Y-O-Y Growth Rate, 2019 - 2032, (US$ Million)
- 11.3.11.3.France Market Size and Forecast, By Technology Type, 2019 - 2032 (US$ Million)
- 11.3.11.4.France Market Size and Forecast, By Application, 2019 - 2032 (US$ Million)
- 11.3.11.5.France Market Size and Forecast, By Scale or Capacity, 2019 - 2032 (US$ Million)
- 11.3.11.6.France Market Size and Forecast, By End-User, 2019 - 2032 (US$ Million)
- 11.3.12.Russia
- 11.3.12.1.Market Analysis, Forecast, and Y-O-Y Growth Rate, 2019 - 2032, (US$ Million)
- 11.3.12.2.Russia Market Size and Forecast, By Technology Type, 2019 - 2032 (US$ Million)
- 11.3.12.3.Russia Market Size and Forecast, By Application, 2019 - 2032 (US$ Million)
- 11.3.12.4.Russia Market Size and Forecast, By Scale or Capacity, 2019 - 2032 (US$ Million)
- 11.3.12.5.Russia Market Size and Forecast, By End-User, 2019 - 2032 (US$ Million)
- 11.3.13.Netherlands
- 11.3.13.1.Market Analysis, Forecast, and Y-O-Y Growth Rate, 2019 - 2032, (US$ Million)
- 11.3.13.2.Netherlands Market Size and Forecast, By Technology Type, 2019 - 2032 (US$ Million)
- 11.3.13.3.Netherlands Market Size and Forecast, By Application, 2019 - 2032 (US$ Million)
- 11.3.13.4.Netherlands Market Size and Forecast, By Scale or Capacity, 2019 - 2032 (US$ Million)
- 11.3.13.5.Netherlands Market Size and Forecast, By End-User, 2019 - 2032 (US$ Million)
- 11.3.14.Sweden
- 11.3.14.1.Market Analysis, Forecast, and Y-O-Y Growth Rate, 2019 - 2032, (US$ Million)
- 11.3.14.2.Sweden Market Size and Forecast, By Technology Type, 2019 - 2032 (US$ Million)
- 11.3.14.3.Sweden Market Size and Forecast, By Application, 2019 - 2032 (US$ Million)
- 11.3.14.4.Sweden Market Size and Forecast, By Scale or Capacity, 2019 - 2032 (US$ Million)
- 11.3.14.5.Sweden Market Size and Forecast, By End-User, 2019 - 2032 (US$ Million)
- 11.3.15.Poland
- 11.3.15.1.Market Analysis, Forecast, and Y-O-Y Growth Rate, 2019 - 2032, (US$ Million)
- 11.3.15.2.Poland Market Size and Forecast, By Technology Type, 2019 - 2032 (US$ Million)
- 11.3.15.3.Poland Market Size and Forecast, By Application, 2019 - 2032 (US$ Million)
- 11.3.15.4.Poland Market Size and Forecast, By Scale or Capacity, 2019 - 2032 (US$ Million)
- 11.3.15.5.Poland Market Size and Forecast, By End-User, 2019 - 2032 (US$ Million)
- 11.3.16.Rest of Europe
- 11.3.16.1.Overview
- 11.3.16.2.Market Analysis, Forecast, and Y-O-Y Growth Rate, 2019 - 2032, (US$ Million)
- 11.3.16.3.Rest of the Europe Market Size and Forecast, By Technology Type, 2019 - 2032 (US$ Million)
- 11.3.16.4.Rest of the Europe Market Size and Forecast, By Application, 2019 - 2032 (US$ Million)
- 11.3.16.5.Rest of the Europe Market Size and Forecast, By Scale or Capacity, 2019 - 2032 (US$ Million)
- 11.3.16.6.Rest of the Europe Market Size and Forecast, By End-User, 2019 - 2032 (US$ Million)
- 11.4.Asia Pacific (APAC)
- 11.4.1.Overview
- 11.4.2.Direct Air Capture Key Manufacturers in Asia Pacific
- 11.4.3.Asia Pacific Market Size and Forecast, By Country, 2019 - 2032 (US$ Million)
- 11.4.4.Asia Pacific Market Size and Forecast, By Technology Type, 2019 - 2032 (US$ Million)
- 11.4.5.Asia Pacific Market Size and Forecast, By Application, 2019 - 2032 (US$ Million)
- 11.4.6.Asia Pacific Market Size and Forecast, By Scale or Capacity, 2019 - 2032 (US$ Million)
- 11.4.7.Asia Pacific Market Size and Forecast, By End-User, 2019 - 2032 (US$ Million)
- 11.4.8.India
- 11.4.8.1.Overview
- 11.4.8.2.Market Analysis, Forecast, and Y-O-Y Growth Rate, 2019 - 2032, (US$ Million)
- 11.4.8.3.India Market Size and Forecast, By Technology Type, 2019 - 2032 (US$ Million)
- 11.4.8.4.India Market Size and Forecast, By Application, 2019 - 2032 (US$ Million)
- 11.4.8.5.India Market Size and Forecast, By Scale or Capacity, 2019 - 2032 (US$ Million)
- 11.4.8.6.India Market Size and Forecast, By End-User, 2019 - 2032 (US$ Million)
- 11.4.9.China
- 11.4.9.1.Overview
- 11.4.9.2.Market Analysis, Forecast, and Y-O-Y Growth Rate, 2019 - 2032, (US$ Million)
- 11.4.9.3.China Market Size and Forecast, By Technology Type, 2019 - 2032 (US$ Million)
- 11.4.9.4.China Market Size and Forecast, By Application, 2019 - 2032 (US$ Million)
- 11.4.9.5.China Market Size and Forecast, By Scale or Capacity, 2019 - 2032 (US$ Million)
- 11.4.9.6.China Market Size and Forecast, By End-User, 2019 - 2032 (US$ Million)
- 11.4.10.Japan
- 11.4.10.1.Overview
- 11.4.10.2.Market Analysis, Forecast, and Y-O-Y Growth Rate, 2019 - 2032, (US$ Million)
- 11.4.10.3.Japan Market Size and Forecast, By Technology Type, 2019 - 2032 (US$ Million)
- 11.4.10.4.Japan Market Size and Forecast, By Application, 2019 - 2032 (US$ Million)
- 11.4.10.5.Japan Market Size and Forecast, By Scale or Capacity, 2019 - 2032 (US$ Million)
- 11.4.10.6.Japan Market Size and Forecast, By End-User, 2019 - 2032 (US$ Million)
- 11.4.11.South Korea
- 11.4.11.1.Overview
- 11.4.11.2.Market Analysis, Forecast, and Y-O-Y Growth Rate, 2019 - 2032, (US$ Million)
- 11.4.11.3.South Korea Market Size and Forecast, By Technology Type, 2019 - 2032 (US$ Million)
- 11.4.11.4.South Korea Market Size and Forecast, By Application, 2019 - 2032 (US$ Million)
- 11.4.11.5.South Korea Market Size and Forecast, By Scale or Capacity, 2019 - 2032 (US$ Million)
- 11.4.11.6.South Korea Market Size and Forecast, By End-User, 2019 - 2032 (US$ Million)
- 11.4.12.Australia
- 11.4.12.1.Overview
- 11.4.12.2.Market Analysis, Forecast, and Y-O-Y Growth Rate, 2019 - 2032, (US$ Million)
- 11.4.12.3.Australia Market Size and Forecast, By Technology Type, 2019 - 2032 (US$ Million)
- 11.4.12.4.Australia Market Size and Forecast, By Application, 2019 - 2032 (US$ Million)
- 11.4.12.5.Australia Market Size and Forecast, By Scale or Capacity, 2019 - 2032 (US$ Million)
- 11.4.12.6.Australia Market Size and Forecast, By End-User, 2019 - 2032 (US$ Million)
- 11.4.13.Thailand
- 11.4.13.1.Overview
- 11.4.13.2.Market Analysis, Forecast, and Y-O-Y Growth Rate, 2019 - 2032, (US$ Million)
- 11.4.13.3.Thailand Market Size and Forecast, By Technology Type, 2019 - 2032 (US$ Million)
- 11.4.13.4.Thailand Market Size and Forecast, By Application, 2019 - 2032 (US$ Million)
- 11.4.13.5.Thailand Market Size and Forecast, By Scale or Capacity, 2019 - 2032 (US$ Million)
- 11.4.13.6.Thailand Market Size and Forecast, By End-User, 2019 - 2032 (US$ Million)
- 11.4.14.Indonesia
- 11.4.14.1.Overview
- 11.4.14.2.Market Analysis, Forecast, and Y-O-Y Growth Rate, 2019 - 2032, (US$ Million)
- 11.4.14.3.Indonesia Market Size and Forecast, By Technology Type, 2019 - 2032 (US$ Million)
- 11.4.14.4.Indonesia Market Size and Forecast, By Application, 2019 - 2032 (US$ Million)
- 11.4.14.5.Indonesia Market Size and Forecast, By Scale or Capacity, 2019 - 2032 (US$ Million)
- 11.4.14.6.Indonesia Market Size and Forecast, By End-User, 2019 - 2032 (US$ Million)
- 11.4.15.Philippines
- 11.4.15.1.Overview
- 11.4.15.2.Market Analysis, Forecast, and Y-O-Y Growth Rate, 2019 - 2032, (US$ Million)
- 11.4.15.3.Philippines Market Size and Forecast, By Technology Type, 2019 - 2032 (US$ Million)
- 11.4.15.4.Philippines Market Size and Forecast, By Application, 2019 - 2032 (US$ Million)
- 11.4.15.5.Philippines Market Size and Forecast, By Scale or Capacity, 2019 - 2032 (US$ Million)
- 11.4.15.6.Philippines Market Size and Forecast, By End-User, 2019 - 2032 (US$ Million)
- 11.4.16.Rest of APAC
- 11.4.16.1.Overview
- 11.4.16.2.Market Analysis, Forecast, and Y-O-Y Growth Rate, 2019 - 2032, (US$ Million)
- 11.4.16.3.Rest of APAC Market Size and Forecast, By Technology Type, 2019 - 2032 (US$ Million)
- 11.4.16.4.Rest of APAC Market Size and Forecast, By Application, 2019 - 2032 (US$ Million)
- 11.4.16.5.Rest of APAC Market Size and Forecast, By Scale or Capacity, 2019 - 2032 (US$ Million)
- 11.4.16.6.Rest of APAC Market Size and Forecast, By End-User, 2019 - 2032 (US$ Million)
- 11.5.Latin America
- 11.5.1.Overview
- 11.5.2.Direct Air Capture Key Manufacturers in Latin America
- 11.5.3.Latin America Market Size and Forecast, By Country, 2019 - 2032 (US$ Million)
- 11.5.4.Latin America Market Size and Forecast, By Technology Type, 2019 - 2032 (US$ Million)
- 11.5.5.Latin America Market Size and Forecast, By Application, 2019 - 2032 (US$ Million)
- 11.5.6.Latin America Market Size and Forecast, By Scale or Capacity, 2019 - 2032 (US$ Million)
- 11.5.7.Latin America Market Size and Forecast, By End-User, 2019 - 2032 (US$ Million)
- 11.5.8.Brazil
- 11.5.8.1.Overview
- 11.5.8.2.Market Analysis, Forecast, and Y-O-Y Growth Rate, 2019 - 2032, (US$ Million)
- 11.5.8.3.Brazil Market Size and Forecast, By Technology Type, 2019 - 2032 (US$ Million)
- 11.5.8.4.Brazil Market Size and Forecast, By Application, 2019 - 2032 (US$ Million)
- 11.5.8.5.Brazil Market Size and Forecast, By Scale or Capacity, 2019 - 2032 (US$ Million)
- 11.5.8.6.Brazil Market Size and Forecast, By End-User, 2019 - 2032 (US$ Million)
- 11.5.9.Mexico
- 11.5.9.1.Overview
- 11.5.9.2.Market Analysis, Forecast, and Y-O-Y Growth Rate, 2019 - 2032, (US$ Million)
- 11.5.9.3.Mexico Market Size and Forecast, By Technology Type, 2019 - 2032 (US$ Million)
- 11.5.9.4.Mexico Market Size and Forecast, By Application, 2019 - 2032 (US$ Million)
- 11.5.9.5.Mexico Market Size and Forecast, By Scale or Capacity, 2019 - 2032 (US$ Million)
- 11.5.9.6.Mexico Market Size and Forecast, By End-User, 2019 - 2032 (US$ Million)
- 11.5.10.Argentina
- 11.5.10.1.Overview
- 11.5.10.2.Market Analysis, Forecast, and Y-O-Y Growth Rate, 2019 - 2032, (US$ Million)
- 11.5.10.3.Argentina Market Size and Forecast, By Technology Type, 2019 - 2032 (US$ Million)
- 11.5.10.4.Argentina Market Size and Forecast, By Application, 2019 - 2032 (US$ Million)
- 11.5.10.5.Argentina Market Size and Forecast, By Scale or Capacity, 2019 - 2032 (US$ Million)
- 11.5.10.6.Argentina Market Size and Forecast, By End-User, 2019 - 2032 (US$ Million)
- 11.5.11.Colombia
- 11.5.11.1.Overview
- 11.5.11.2.Market Analysis, Forecast, and Y-O-Y Growth Rate, 2019 - 2032, (US$ Million)
- 11.5.11.3.Colombia Market Size and Forecast, By Technology Type, 2019 - 2032 (US$ Million)
- 11.5.11.4.Colombia Market Size and Forecast, By Application, 2019 - 2032 (US$ Million)
- 11.5.11.5.Colombia Market Size and Forecast, By Scale or Capacity, 2019 - 2032 (US$ Million)
- 11.5.11.6.Colombia Market Size and Forecast, By End-User, 2019 - 2032 (US$ Million)
- 11.5.12.Rest of LATAM
- 11.5.12.1.Overview
- 11.5.12.2.Market Analysis, Forecast, and Y-O-Y Growth Rate, 2019 - 2032, (US$ Million)
- 11.5.12.3.Rest of LATAM Market Size and Forecast, By Technology Type, 2019 - 2032 (US$ Million)
- 11.5.12.4.Rest of LATAM Market Size and Forecast, By Application, 2019 - 2032 (US$ Million)
- 11.5.12.5.Rest of LATAM Market Size and Forecast, By Scale or Capacity, 2019 - 2032 (US$ Million)
- 11.5.12.6.Rest of LATAM Market Size and Forecast, By End-User, 2019 - 2032 (US$ Million)
- 11.6.Middle East and Africa
- 11.6.1.Overview
- 11.6.2.Direct Air Capture Key Manufacturers in Middle East and Africa
- 11.6.3.Middle East and Africa Market Size and Forecast, By Country, 2019 - 2032 (US$ Million)
- 11.6.4.Middle East and Africa Market Size and Forecast, By Technology Type, 2019 - 2032 (US$ Million)
- 11.6.5.Middle East and Africa Market Size and Forecast, By Application, 2019 - 2032 (US$ Million)
- 11.6.6.Middle East and Africa Market Size and Forecast, By Scale or Capacity, 2019 - 2032 (US$ Million)
- 11.6.7.Middle East and Africa Market Size and Forecast, By End-User, 2019 - 2032 (US$ Million)
- 11.6.8.Saudi Arabia
- 11.6.8.1.Overview
- 11.6.8.2.Market Analysis, Forecast, and Y-O-Y Growth Rate, 2019 - 2032, (US$ Million)
- 11.6.8.3.Saudi Arabia Market Size and Forecast, By Technology Type, 2019 - 2032 (US$ Million)
- 11.6.8.4.Saudi Arabia Market Size and Forecast, By Application, 2019 - 2032 (US$ Million)
- 11.6.8.5.Saudi Arabia Market Size and Forecast, By Scale or Capacity, 2019 - 2032 (US$ Million)
- 11.6.8.6.Saudi Arabia Market Size and Forecast, By End-User, 2019 - 2032 (US$ Million)
- 11.6.9.United Arab Emirates
- 11.6.9.1.Overview
- 11.6.9.2.Market Analysis, Forecast, and Y-O-Y Growth Rate, 2019 - 2032, (US$ Million)
- 11.6.9.3.United Arab Emirates Market Size and Forecast, By Technology Type, 2019 - 2032 (US$ Million)
- 11.6.9.4.United Arab Emirates Market Size and Forecast, By Application, 2019 - 2032 (US$ Million)
- 11.6.9.5.United Arab Emirates Market Size and Forecast, By Scale or Capacity, 2019 - 2032 (US$ Million)
- 11.6.9.6.United Arab Emirates Market Size and Forecast, By End-User, 2019 - 2032 (US$ Million)
- 11.6.10.Israel
- 11.6.10.1.Overview
- 11.6.10.2.Market Analysis, Forecast, and Y-O-Y Growth Rate, 2019 - 2032, (US$ Million)
- 11.6.10.3.Israel Market Size and Forecast, By Technology Type, 2019 - 2032 (US$ Million)
- 11.6.10.4.Israel Market Size and Forecast, By Application, 2019 - 2032 (US$ Million)
- 11.6.10.5.Israel Market Size and Forecast, By Scale or Capacity, 2019 - 2032 (US$ Million)
- 11.6.10.6.Israel Market Size and Forecast, By End-User, 2019 - 2032 (US$ Million)
- 11.6.11.Turkey
- 11.6.11.1.Overview
- 11.6.11.2.Market Analysis, Forecast, and Y-O-Y Growth Rate, 2019 - 2032, (US$ Million)
- 11.6.11.3.Turkey Market Size and Forecast, By Technology Type, 2019 - 2032 (US$ Million)
- 11.6.11.4.Turkey Market Size and Forecast, By Application, 2019 - 2032 (US$ Million)
- 11.6.11.5.Turkey Market Size and Forecast, By Scale or Capacity, 2019 - 2032 (US$ Million)
- 11.6.11.6.Turkey Market Size and Forecast, By End-User, 2019 - 2032 (US$ Million)
- 11.6.12.Algeria
- 11.6.12.1.Overview
- 11.6.12.2.Market Analysis, Forecast, and Y-O-Y Growth Rate, 2019 - 2032, (US$ Million)
- 11.6.12.3.Algeria Market Size and Forecast, By Technology Type, 2019 - 2032 (US$ Million)
- 11.6.12.4.Algeria Market Size and Forecast, By Application, 2019 - 2032 (US$ Million)
- 11.6.12.5.Algeria Market Size and Forecast, By Scale or Capacity, 2019 - 2032 (US$ Million)
- 11.6.12.6.Algeria Market Size and Forecast, By End-User, 2019 - 2032 (US$ Million)
- 11.6.13.Egypt
- 11.6.13.1.Overview
- 11.6.13.2.Market Analysis, Forecast, and Y-O-Y Growth Rate, 2019 - 2032, (US$ Million)
- 11.6.13.3.Egypt Market Size and Forecast, By Technology Type, 2019 - 2032 (US$ Million)
- 11.6.13.4.Egypt Market Size and Forecast, By Application, 2019 - 2032 (US$ Million)
- 11.6.13.5.Egypt Market Size and Forecast, By Scale or Capacity, 2019 - 2032 (US$ Million)
- 11.6.13.6.Egypt Market Size and Forecast, By End-User, 2019 - 2032 (US$ Million)
- 11.6.14.Rest of MEA
- 11.6.14.1.Overview
- 11.6.14.2.Market Analysis, Forecast, and Y-O-Y Growth Rate, 2019 - 2032, (US$ Million)
- 11.6.14.3.Rest of MEA Market Size and Forecast, By Technology Type, 2019 - 2032 (US$ Million)
- 11.6.14.4.Rest of MEA Market Size and Forecast, By Application, 2019 - 2032 (US$ Million)
- 11.6.14.5.Rest of MEA Market Size and Forecast, By Scale or Capacity, 2019 - 2032 (US$ Million)
- 11.6.14.6.Rest of MEA Market Size and Forecast, By End-User, 2019 - 2032 (US$ Million)
12.Key Vendor Analysis- Direct Air Capture Industry
- 12.1.Competitive Dashboard
- 12.2.Company Profiles
- 12.2.1.Carbon Engineering Ltd.
- 12.2.2.Climeworks AG
- 12.2.3.Global Thermostat LLC
- 12.2.4.Infinitree Inc.
- 12.2.5.Skytree
- 12.2.6.Carbon Clean Solutions Limited
- 12.2.7.CO2 Solutions Inc.
- 12.2.8.Kiverdi Inc.
- 12.2.9.Climatempo Group
- 12.2.10.Solidia Technologies, Inc.
- 12.2.11.C4X Discovery Holdings plc
- 12.2.12.Zurich Carbon Capture Ltd.
- 12.2.13.Carbon Cycle Ltd.
- 12.2.14.GreenFuel Technologies Corporation
- 12.2.15.Verdox GmbH
- 12.2.16.Prometheus Fuels Inc.
- 12.2.17.Others
13.360 Degree Analyst View
14.Appendix
- 14.1.Research Methodology
- 14.2.References
- 14.3.Abbreviations
- 14.4.Disclaimer
- 14.5.Contact Us
