|
|
市場調査レポート
商品コード
1419039
LED蛍光体市場:製品別、用途別、国別、地域別- 産業分析、市場規模、市場シェア、2023-2030年予測LED phosphor Market, By Product, By Application, By Country, and By Region - Industry Analysis, Market Size, Market Share & Forecast from 2023-2030 |
||||||
|
|||||||
カスタマイズ可能
|
|||||||

| LED蛍光体市場:製品別、用途別、国別、地域別- 産業分析、市場規模、市場シェア、2023-2030年予測 |
|
出版日: 2024年01月01日
発行: AnalystView Market Insights
ページ情報: 英文 260 Pages
納期: 2~3営業日
|

全表示
- 概要
- 図表
- 目次
レポートハイライト
LED蛍光体の市場規模は2022年に17億3,290万米ドル、2023年から2030年までCAGR 8.7%で拡大する見込みです。
LED蛍光体市場-市場力学
従来の照明システムよりもLED照明技術への嗜好の高まりが市場需要を促進
従来の照明システムよりもLED照明技術への嗜好が高まっていることが、LED蛍光体市場の極めて重要な成長要因となっています。さらに、白色LEDの採用急増がLED蛍光体市場をさらに押し上げています。さらに、様々な自動車部品のための自動車用照明が重視されるようになり、自動車セクターの拡大が予想されています。LED蛍光体技術は自動車用ヘッドライトのデジタル化を促進し、アドバンスト・ドライビング・ビーム(ADB)のような全く新しい機能を導入します。ヘッドライトの多様な色に対する要求の高まりと自動車生産の活況は、予測期間中に自動車産業におけるLED蛍光体の需要を増大させる。
LED蛍光体市場-セグメンテーション分析:
LED蛍光体の世界市場は、製品、用途、地域によって区分されます。
市場は製品によって5つのカテゴリーに分けられる:リン酸塩、ガーネット、ケイ酸塩、窒化物、その他。タイプ別では、窒化物セグメントが2022年のLED蛍光体世界市場で収益リーダーに浮上しました。窒化物LED蛍光体は、ウエハー形態で一般的に使用され、顕著な青色発光と高電圧に対する劣化のない耐性を示します。これらの材料は、住宅、職場、街灯など、白色光が必要で視認性が高まる照明用途に大きな可能性を秘めています。窒化物LED蛍光体の需要予測は、LED蛍光体市場を今後数年間押し上げると予想されます。
市場は用途別に7つのカテゴリーに分類される:自動車,ポータブルPC,スマートフォン,フラットパネルTV,サイネージ,照明,その他。アプリケーション別では、照明セグメントが2022年のLED蛍光体世界市場を独占しました。LEDは、白熱電球や装飾用LED照明に比べて消費電力が大幅に低いことで有名であり、動作温度が低く、燃焼や火傷のリスクを低減します。埋め込み型LEDダウンライトは、住宅のキッチン、廊下、バスルーム、様々なオフィスや商業環境で広く利用されており、需要が増加しています。その結果、装飾用照明の需要増が予想され、予測期間中にLED蛍光体市場を押し上げると予測されています。
LED蛍光体市場-地域別インサイト
LED蛍光体市場は、北米、ラテンアメリカ、欧州、アジア太平洋、中東アフリカの各地域に広く分布しています。これらの地域は、ビジネスをもたらす国によってさらに分けられます。
LED蛍光体市場-競合情勢:
LED蛍光体企業は、蛍光体材料を革新するための研究開発に重点を置くことで戦略を立て、効率の向上、優れた色品質、安定性の向上を目指しています。一般照明、車載照明、ディスプレイなど、さまざまなLEDアプリケーションに対応する蛍光体技術の開発に資源を投入しています。さらに、コスト効率を高めるための製造プロセスの最適化、環境に優しく希土類元素を含まない蛍光体の探求、LED照明ソリューションの技術的進歩を促進しながら市場浸透を拡大するためのパートナーシップの育成などの戦略もあります。LED蛍光体市場は細分化されており、Phosphor Tech Corporation、Beijing Yuji International Co.Ltd.、Intematix Corporation、Denka Co.Ltd.、Intematix Corporation、Denka Co.これらの市場参入企業は、製品ポートフォリオを強化し、持続可能な競争優位性を確立するために、提携や買収などの戦略を採用しています。
目次
第1章 LED蛍光体市場概要
- 調査範囲
- 市場推定年数
第2章 エグゼクティブサマリー
- 市場内訳
- 競合考察
第3章 LED蛍光体の主要な市場動向
- 市場促進要因
- 市場抑制要因
- 市場機会
- 今後の市場動向
第4章 LED蛍光体産業の調査
- PEST分析
- ポーターのファイブフォース分析
- 成長見通しのマッピング
- 規制枠組みの分析
第5章 LED蛍光体市場:COVID-19の影響分析
- COVID-19前の影響分析
- COVID-19後の影響分析
第6章 LED蛍光体市場情勢
- LED蛍光体市場シェア分析、2022年
- 主要メーカー別の内訳データ
- 既存企業の分析
- 新興企業の分析
第7章 LED蛍光体市場- 製品別
- 概要
- 製品別セグメントシェア分析
- リン酸塩
- ガーネット
- ケイ酸塩
- 窒化物
- その他
第8章 LED蛍光体市場- 用途別
- 概要
- 用途別のセグメントシェア分析
- 自動車
- ポータブルPC
- スマートフォン
- フラットパネルテレビ
- 看板
- 点灯
- その他
第9章 LED蛍光体市場- 地域別
- イントロダクション
- 北米
- 概要
- 北米の主要メーカー
- 米国
- カナダ
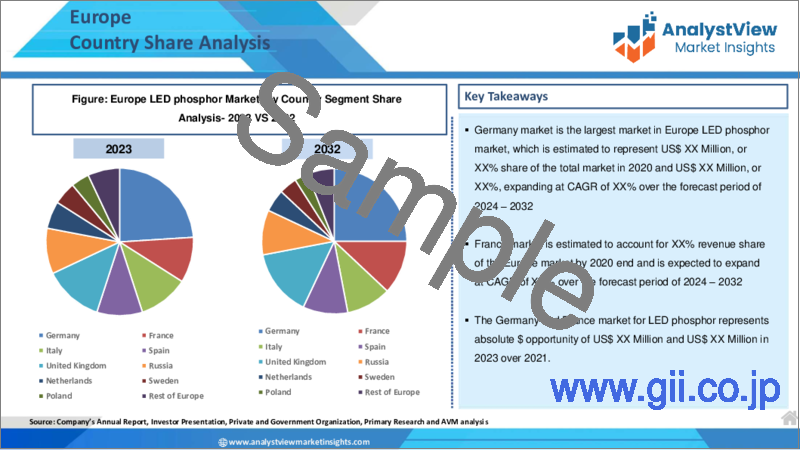
- 欧州
- 概要
- 欧州の主要メーカー
- ドイツ
- イタリア
- 英国
- フランス
- ロシア
- オランダ
- スウェーデン
- ポーランド
- その他
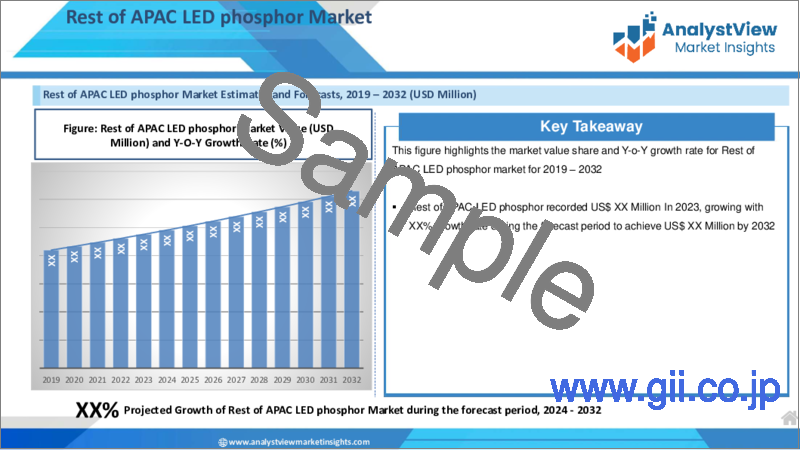
- アジア太平洋(APAC)
- 概要
- アジア太平洋地域の主要メーカー
- インド
- 中国
- 日本
- 韓国
- オーストラリア
- タイ
- インドネシア
- フィリピン
- その他
- ラテンアメリカ
- 概要
- ラテンアメリカの主要メーカー
- ブラジル
- メキシコ
- アルゼンチン
- コロンビア
- その他
- 中東とアフリカ
- 概要
- 中東およびアフリカの主要メーカー
- サウジアラビア
- アラブ首長国連邦
- イスラエル
- トルコ
- アルジェリア
- エジプト
- その他
第10章 主要ベンダー分析-LED蛍光体業界
- 競合ダッシュボード
- 企業プロファイル
- Beijing Yuji International Co., Ltd.
- Edison Opto Corporation
- General Electric Company
- Harvatek Corporation
- Intematix Corporation
- Leuchtstoffwerk Breitungen GmbH
- Lumileds Holding BV
- Luming Technology Group Co.,Ltd.
- Materion Corporation
- Mitsubishi Signage Corporation
- Nichia Corporation
- Nippon Electric Glass Co.,Ltd.
- OSRAM GmbH
- PhosphorTech Corporation
- Tailorlux GmbH
- Others
第11章 アナリストの全方位展望
List of Tables
- TABLE List of data sources
- TABLE Market drivers; Impact Analysis
- TABLE Market restraints; Impact Analysis
- TABLE LED phosphor Market: Product Snapshot (2022)
- TABLE Segment Dashboard; Definition and Scope, by Product
- TABLE Global LED phosphor Market, by Product 2018-2030 (USD Million)
- TABLE LED phosphor Market: Application Snapshot (2022)
- TABLE Segment Dashboard; Definition and Scope, by Application
- TABLE Global LED phosphor Market, by Application 2018-2030 (USD Million)
- TABLE LED phosphor Market: Regional snapshot (2022)
- TABLE Segment Dashboard; Definition and Scope, by Region
- TABLE Global LED phosphor Market, by Region 2018-2030 (USD Million)
- TABLE North America LED phosphor Market, by Country, 2018-2030 (USD Million)
- TABLE North America LED phosphor Market, by Product, 2018-2030 (USD Million)
- TABLE North America LED phosphor Market, by Application, 2018-2030 (USD Million)
- TABLE Europe LED phosphor Market, by Country, 2018-2030 (USD Million)
- TABLE Europe LED phosphor Market, by Product, 2018-2030 (USD Million)
- TABLE Europe LED phosphor Market, by Application, 2018-2030 (USD Million)
- TABLE Asia Pacific LED phosphor Market, by Country, 2018-2030 (USD Million)
- TABLE Asia Pacific LED phosphor Market, by Product, 2018-2030 (USD Million)
- TABLE Asia Pacific LED phosphor Market, by Application, 2018-2030 (USD Million)
- TABLE Latin America LED phosphor Market, by Country, 2018-2030 (USD Million)
- TABLE Latin America LED phosphor Market, by Product, 2018-2030 (USD Million)
- TABLE Latin America LED phosphor Market, by Application, 2018-2030 (USD Million)
- TABLE Middle East and Africa LED phosphor Market, by Country, 2018-2030 (USD Million)
- TABLE Middle East and Africa LED phosphor Market, by Product, 2018-2030 (USD Million)
- TABLE Middle East and Africa LED phosphor Market, by Application, 2018-2030 (USD Million)
REPORT HIGHLIGHT
LED phosphor Market size was valued at USD 1,732.9 Million in 2022, expanding at a CAGR of 8.7% from 2023 to 2030.
LED phosphor refers to a photoluminescent substance that captures the energy from violet and blue light emitted by gallium nitride and various other LED chips, transforming it into visible light. These phosphors play a critical role in determining the stability, efficiency, and quality of light emitted by LEDs.
LED phosphor Market- Market Dynamics
Increasing preference for LED lighting technologies over traditional lighting systems to propel market demand
The increasing preference for LED lighting technologies over traditional lighting systems stands as a pivotal growth driver for the LED phosphors market. Moreover, the surge in the adoption of white LEDs has further propelled the market for LED phosphors. Additionally, the automotive sector is anticipated to expand due to heightened emphasis on automotive lighting for various auto components. There has been a significant increase in performance expectations over the years, particularly in terms of intense heat and light characteristics in the latest headlight designs for vehicles.LED phosphor technology facilitates the digitalization of automotive headlights, introducing entirely new functionalities like advanced driving beam (ADB). The rising demand for diverse color requirements in headlights and the booming automotive production are poised to augment the demand for LED phosphors within the automotive industry during the forecast period.
LED phosphor Market- Key Insights
- As per the analysis shared by our research analyst, the global market is estimated to grow annually at a CAGR of around 8.7% over the forecast period (2023-2030)
- Based on Product segmentation, nitride was predicted to show maximum market share in the year 2022
- Based on Application segmentation, lighting was the leading type in 2022
- On the basis of region, North America was the leading revenue generator in 2022
LED phosphor Market- Segmentation Analysis:
The Global LED phosphor Market is segmented on the basis of Product, Application, and Region.
The market is divided into five categories based on Product: Phosphate, Garnet, Silicate, Nitride and Others. In terms of type, the nitride segment emerged as the revenue leader in the global LED phosphors market in 2022. Nitride LED phosphors, commonly used in wafer form, exhibit remarkable blue emissions and resilience against high voltages without degradation. These materials hold substantial potential for lighting applications such as residential, workplace, and street lights, where the necessity for white light enhances visibility. The projected demand for nitride LED phosphors is expected to propel the LED phosphors market in the forthcoming years.
The market is divided into seven categories based on Application: Automotive, Portable PCs, Smartphones, Flat Panel TVs, Signage, Lighting and Others. Based on application, the lighting segment dominated the global LED phosphors market in 2022. LEDs, renowned for their significantly lower electricity consumption compared to incandescent bulbs and decorative LED lights, offer a cooler operational temperature, reducing the risk of combustion or burns. Recessed LED downlights, widely utilized in residential kitchens, hallways, bathrooms, and various office and commercial settings, are witnessing increased demand. Consequently, the anticipated growth in demand for decorative lights is projected to uplift the LED phosphors market during the forecast period.
LED phosphor Market- Geographical Insights
Geographically, this market is widespread into the regions of North America, Latin America, Europe, Asia Pacific, and the Middle East and Africa. These regions are further divided as per the nations bringing business.
LED phosphor Market- Competitive Landscape:
LED phosphor companies strategize by directing their focus towards research and development to innovate phosphor materials, aiming for enhanced efficiency, superior color quality, and heightened stability. They invest resources in developing phosphor technologies that cater to various LED applications, spanning general lighting, automotive lighting, displays, and more. Moreover, strategies encompass optimizing manufacturing processes for cost-effectiveness, exploring eco-friendly and rare-earth-element-free phosphors, and fostering partnerships to expand market penetration while driving technological advancements in LED lighting solutions. The LED phosphors market exhibits fragmentation, with key players like Phosphor Tech Corporation, Beijing Yuji International Co. Ltd, Intematix Corporation, Denka Co. Ltd, and Nichia Corporation holding prominent positions. These market participants adopt strategies such as partnerships and acquisitions to bolster their product portfolios and establish sustainable competitive advantages.
Recent Developments:
In November 2022, Cree LED, a subsidiary of SGH, unveiled PhotophyllTMSelect LEDs, featuring an progressive horticulture spectrum available in the XLamp XP-G3 LEDs as well as the J Series 2835 3V G Class LEDs. LEDs utilizing PhotophyllSelect technology have undergone extensive characterization in horticulture metrics, enabling luminaire manufacturers to easily adjust blue/green/red spectral ratios to meet specific plant requirements.
SCOPE OF THE REPORT
The scope of this report covers the market by its major segments, which include as follows:
GLOBAL LED PHOSPHOR MARKET KEY PLAYERS
- Beijing Yuji International Co., Ltd.
- Edison Opto Corporation
- General Electric Company
- Harvatek Corporation
- Intematix Corporation
- Leuchtstoffwerk Breitungen GmbH
- Lumileds Holding B.V.
- Luming Technology Group Co.,Ltd.
- Materion Corporation
- Mitsubishi Signage Corporation
- Nichia Corporation
- Nippon Electric Glass Co.,Ltd.
- OSRAM GmbH
- PhosphorTech Corporation
- Tailorlux GmbH
- Others
GLOBAL LED PHOSPHOR MARKET, BY PRODUCT
- Phosphate
- Garnet
- Silicate
- Nitride
- Others
GLOBAL LED PHOSPHOR MARKET, BY APPLICATION
- Automotive
- Portable PCs
- Smartphones
- Flat Panel TVs
- Signage
- Lighting
- Others
GLOBAL LED PHOSPHOR MARKET, BY REGION
- North America
- The U.S.
- Canada
- Europe
- Germany
- France
- Italy
- Spain
- United Kingdom
- Russia
- Netherlands
- Sweden
- Poland
- Rest of Europe
- Asia Pacific
- India
- China
- South Korea
- Japan
- Australia
- Thailand
- Indonesia
- Philippines
- Rest of APAC
- Latin America
- Brazil
- Mexico
- Argentina
- Colombia
- Rest of LATAM
- The Middle East and Africa
- Saudi Arabia
- United Arab Emirates
- Israel
- Turkey
- Algeria
- Egypt
- Rest of MEA
Table of Contents
1. LED phosphor Market Overview
- 1.1. Study Scope
- 1.2. Market Estimation Years
2. Executive Summary
- 2.1. Market Snippet
- 2.1.1. LED phosphor Market Snippet by Product
- 2.1.2. LED phosphor Market Snippet by Application
- 2.1.3. LED phosphor Market Snippet by Country
- 2.1.4. LED phosphor Market Snippet by Region
- 2.2. Competitive Insights
3. LED phosphor Key Market Trends
- 3.1. LED phosphor Market Drivers
- 3.1.1. Impact Analysis of Market Drivers
- 3.2. LED phosphor Market Restraints
- 3.2.1. Impact Analysis of Market Restraints
- 3.3. LED phosphor Market Opportunities
- 3.4. LED phosphor Market Future Trends
4. LED phosphor Industry Study
- 4.1. PEST Analysis
- 4.2. Porter's Five Forces Analysis
- 4.3. Growth Prospect Mapping
- 4.4. Regulatory Framework Analysis
5. LED phosphor Market: COVID-19 Impact Analysis
- 5.1. Pre-COVID-19 Impact Analysis
- 5.2. Post-COVID-19 Impact Analysis
- 5.2.1. Top Performing Segments
- 5.2.2. Marginal Growth Segments
- 5.2.3. Top Looser Segments
- 5.2.4. Marginal Loss Segments
6. LED phosphor Market Landscape
- 6.1. LED phosphor Market Share Analysis, 2022
- 6.2. Breakdown Data, by Key Manufacturer
- 6.2.1. Established Players' Analysis
- 6.2.2. Emerging Players' Analysis
7. LED phosphor Market - By Product
- 7.1. Overview
- 7.1.1. Segment Share Analysis, By Product, 2022 & 2030 (%)
- 7.1.2. Phosphate
- 7.1.3. Garnet
- 7.1.4. Silicate
- 7.1.5. Nitride
- 7.1.6. Others
8. LED phosphor Market - By Application
- 8.1. Overview
- 8.1.1. Segment Share Analysis, By Application, 2022 & 2030 (%)
- 8.1.2. Automotive
- 8.1.3. Portable PCs
- 8.1.4. Smartphones
- 8.1.5. Flat Panel TVs
- 8.1.6. Signage
- 8.1.7. Lighting
- 8.1.8. Others
9. LED phosphor Market- By Geography
- 9.1. Introduction
- 9.1.1. Segment Share Analysis, By Geography, 2022 & 2030 (%)
- 9.2. North America
- 9.2.1. Overview
- 9.2.2. LED phosphor Key Manufacturers in North America
- 9.2.3. North America Market Size and Forecast, By Country, 2018 - 2030 (US$ Million)
- 9.2.4. North America Market Size and Forecast, By Product, 2018 - 2030 (US$ Million)
- 9.2.5. North America Market Size and Forecast, By Application, 2018 - 2030 (US$ Million)
- 9.2.6. U.S.
- 9.2.6.1. Overview
- 9.2.6.2. Market Analysis, Forecast, and Y-O-Y Growth Rate, 2018 - 2030, (US$ Million)
- 9.2.6.3. U.S. Market Size and Forecast, By Product, 2018 - 2030 (US$ Million)
- 9.2.6.4. U.S. Market Size and Forecast, By Application, 2018 - 2030 (US$ Million)
- 9.2.7. Canada
- 9.2.7.1. Overview
- 9.2.7.2. Market Analysis, Forecast, and Y-O-Y Growth Rate, 2018 - 2030, (US$ Million)
- 9.2.7.3. Canada Market Size and Forecast, By Product, 2018 - 2030 (US$ Million)
- 9.2.7.4. Canada Market Size and Forecast, By Application, 2018 - 2030 (US$ Million)
- 9.3. Europe
- 9.3.1. Overview
- 9.3.2. LED phosphor Key Manufacturers in Europe
- 9.3.3. Europe Market Size and Forecast, By Country, 2018 - 2030 (US$ Million)
- 9.3.4. Europe Market Size and Forecast, By Product, 2018 - 2030 (US$ Million)
- 9.3.5. Europe Market Size and Forecast, By Application, 2018 - 2030 (US$ Million)
- 9.3.6. Germany
- 9.3.6.1. Overview
- 9.3.6.2. Market Analysis, Forecast, and Y-O-Y Growth Rate, 2018 - 2030, (US$ Million)
- 9.3.6.3. Germany Market Size and Forecast, By Product, 2018 - 2030 (US$ Million)
- 9.3.6.4. Germany Market Size and Forecast, By Application, 2018 - 2030 (US$ Million)
- 9.3.7. Italy
- 9.3.7.1. Overview
- 9.3.7.2. Market Analysis, Forecast, and Y-O-Y Growth Rate, 2018 - 2030, (US$ Million)
- 9.3.7.3. Italy Market Size and Forecast, By Product, 2018 - 2030 (US$ Million)
- 9.3.7.4. Italy Market Size and Forecast, By Application, 2018 - 2030 (US$ Million)
- 9.3.8. United Kingdom
- 9.3.8.1. Overview
- 9.3.8.2. Market Analysis, Forecast, and Y-O-Y Growth Rate, 2018 - 2030, (US$ Million)
- 9.3.8.3. United Kingdom Market Size and Forecast, By Product, 2018 - 2030 (US$ Million)
- 9.3.8.4. United Kingdom Market Size and Forecast, By Application, 2018 - 2030 (US$ Million)
- 9.3.9. France
- 9.3.9.1. Overview
- 9.3.9.2. Market Analysis, Forecast, and Y-O-Y Growth Rate, 2018 - 2030, (US$ Million)
- 9.3.9.3. France Market Size and Forecast, By Product, 2018 - 2030 (US$ Million)
- 9.3.9.4. France Market Size and Forecast, By Application, 2018 - 2030 (US$ Million)
- 9.3.10. Russia
- 9.3.10.1. Market Analysis, Forecast, and Y-O-Y Growth Rate, 2018 - 2030, (US$ Million)
- 9.3.10.2. Russia Market Size and Forecast, By Product, 2018 - 2030 (US$ Million)
- 9.3.10.3. Russia Market Size and Forecast, By Application, 2018 - 2030 (US$ Million)
- 9.3.11. Netherlands
- 9.3.11.1. Market Analysis, Forecast, and Y-O-Y Growth Rate, 2018 - 2030, (US$ Million)
- 9.3.11.2. Netherlands Market Size and Forecast, By Product, 2018 - 2030 (US$ Million)
- 9.3.11.3. Netherlands Market Size and Forecast, By Application, 2018 - 2030 (US$ Million)
- 9.3.12. Sweden
- 9.3.12.1. Market Analysis, Forecast, and Y-O-Y Growth Rate, 2018 - 2030, (US$ Million)
- 9.3.12.2. Sweden Market Size and Forecast, By Product, 2018 - 2030 (US$ Million)
- 9.3.12.3. Sweden Market Size and Forecast, By Application, 2018 - 2030 (US$ Million)
- 9.3.13. Poland
- 9.3.13.1. Market Analysis, Forecast, and Y-O-Y Growth Rate, 2018 - 2030, (US$ Million)
- 9.3.13.2. Poland Market Size and Forecast, By Product, 2018 - 2030 (US$ Million)
- 9.3.13.3. Poland Market Size and Forecast, By Application, 2018 - 2030 (US$ Million)
- 9.3.14. Rest of Europe
- 9.3.14.1. Overview
- 9.3.14.2. Market Analysis, Forecast, and Y-O-Y Growth Rate, 2018 - 2030, (US$ Million)
- 9.3.14.3. Rest of the Europe Market Size and Forecast, By Product, 2018 - 2030 (US$ Million)
- 9.3.14.4. Rest of the Europe Market Size and Forecast, By Application, 2018 - 2030 (US$ Million)
- 9.4. Asia Pacific (APAC)
- 9.4.1. Overview
- 9.4.2. LED phosphor Key Manufacturers in Asia Pacific
- 9.4.3. Asia Pacific Market Size and Forecast, By Country, 2018 - 2030 (US$ Million)
- 9.4.4. Asia Pacific Market Size and Forecast, By Product, 2018 - 2030 (US$ Million)
- 9.4.5. Asia Pacific Market Size and Forecast, By Application, 2018 - 2030 (US$ Million)
- 9.4.6. India
- 9.4.6.1. Overview
- 9.4.6.2. Market Analysis, Forecast, and Y-O-Y Growth Rate, 2018 - 2030, (US$ Million)
- 9.4.6.3. India Market Size and Forecast, By Product, 2018 - 2030 (US$ Million)
- 9.4.6.4. India Market Size and Forecast, By Application, 2018 - 2030 (US$ Million)
- 9.4.7. China
- 9.4.7.1. Overview
- 9.4.7.2. Market Analysis, Forecast, and Y-O-Y Growth Rate, 2018 - 2030, (US$ Million)
- 9.4.7.3. China Market Size and Forecast, By Product, 2018 - 2030 (US$ Million)
- 9.4.7.4. China Market Size and Forecast, By Application, 2018 - 2030 (US$ Million)
- 9.4.8. Japan
- 9.4.8.1. Overview
- 9.4.8.2. Market Analysis, Forecast, and Y-O-Y Growth Rate, 2018 - 2030, (US$ Million)
- 9.4.8.3. Japan Market Size and Forecast, By Product, 2018 - 2030 (US$ Million)
- 9.4.8.4. Japan Market Size and Forecast, By Application, 2018 - 2030 (US$ Million)
- 9.4.9. South Korea
- 9.4.9.1. Overview
- 9.4.9.2. Market Analysis, Forecast, and Y-O-Y Growth Rate, 2018 - 2030, (US$ Million)
- 9.4.9.3. South Korea Market Size and Forecast, By Product, 2018 - 2030 (US$ Million)
- 9.4.9.4. South Korea Market Size and Forecast, By Application, 2018 - 2030 (US$ Million)
- 9.4.10. Australia
- 9.4.10.1. Overview
- 9.4.10.2. Market Analysis, Forecast, and Y-O-Y Growth Rate, 2018 - 2030, (US$ Million)
- 9.4.10.3. Australia Market Size and Forecast, By Product, 2018 - 2030 (US$ Million)
- 9.4.10.4. Australia Market Size and Forecast, By Application, 2018 - 2030 (US$ Million)
- 9.4.11. Thailand
- 9.4.11.1. Overview
- 9.4.11.2. Market Analysis, Forecast, and Y-O-Y Growth Rate, 2018 - 2030, (US$ Million)
- 9.4.11.3. Thailand Market Size and Forecast, By Product, 2018 - 2030 (US$ Million)
- 9.4.11.4. Thailand Market Size and Forecast, By Application, 2018 - 2030 (US$ Million)
- 9.4.12. Indonesia
- 9.4.12.1. Overview
- 9.4.12.2. Market Analysis, Forecast, and Y-O-Y Growth Rate, 2018 - 2030, (US$ Million)
- 9.4.12.3. Indonesia Market Size and Forecast, By Product, 2018 - 2030 (US$ Million)
- 9.4.12.4. Indonesia Market Size and Forecast, By Application, 2018 - 2030 (US$ Million)
- 9.4.13. Philippines
- 9.4.13.1. Overview
- 9.4.13.2. Market Analysis, Forecast, and Y-O-Y Growth Rate, 2018 - 2030, (US$ Million)
- 9.4.13.3. Philippines Market Size and Forecast, By Product, 2018 - 2030 (US$ Million)
- 9.4.13.4. Philippines Market Size and Forecast, By Application, 2018 - 2030 (US$ Million)
- 9.4.14. Rest of APAC
- 9.4.14.1. Overview
- 9.4.14.2. Market Analysis, Forecast, and Y-O-Y Growth Rate, 2018 - 2030, (US$ Million)
- 9.4.14.3. Rest of APAC Market Size and Forecast, By Product, 2018 - 2030 (US$ Million)
- 9.4.14.4. Rest of APAC Market Size and Forecast, By Application, 2018 - 2030 (US$ Million)
- 9.5. Latin America
- 9.5.1. Overview
- 9.5.2. LED phosphor Key Manufacturers in Latin America
- 9.5.3. Latin America Market Size and Forecast, By Country, 2018 - 2030 (US$ Million)
- 9.5.4. Latin America Market Size and Forecast, By Product, 2018 - 2030 (US$ Million)
- 9.5.5. Latin America Market Size and Forecast, By Application, 2018 - 2030 (US$ Million)
- 9.5.6. Brazil
- 9.5.6.1. Overview
- 9.5.6.2. Market Analysis, Forecast, and Y-O-Y Growth Rate, 2018 - 2030, (US$ Million)
- 9.5.6.3. Brazil Market Size and Forecast, By Product, 2018 - 2030 (US$ Million)
- 9.5.6.4. Brazil Market Size and Forecast, By Application, 2018 - 2030 (US$ Million)
- 9.5.7. Mexico
- 9.5.7.1. Overview
- 9.5.7.2. Market Analysis, Forecast, and Y-O-Y Growth Rate, 2018 - 2030, (US$ Million)
- 9.5.7.3. Mexico Market Size and Forecast, By Product, 2018 - 2030 (US$ Million)
- 9.5.7.4. Mexico Market Size and Forecast, By Application, 2018 - 2030 (US$ Million)
- 9.5.8. Argentina
- 9.5.8.1. Overview
- 9.5.8.2. Market Analysis, Forecast, and Y-O-Y Growth Rate, 2018 - 2030, (US$ Million)
- 9.5.8.3. Argentina Market Size and Forecast, By Product, 2018 - 2030 (US$ Million)
- 9.5.8.4. Argentina Market Size and Forecast, By Application, 2018 - 2030 (US$ Million)
- 9.5.9. Colombia
- 9.5.9.1. Overview
- 9.5.9.2. Market Analysis, Forecast, and Y-O-Y Growth Rate, 2018 - 2030, (US$ Million)
- 9.5.9.3. Colombia Market Size and Forecast, By Product, 2018 - 2030 (US$ Million)
- 9.5.9.4. Colombia Market Size and Forecast, By Application, 2018 - 2030 (US$ Million)
- 9.5.10. Rest of LATAM
- 9.5.10.1. Overview
- 9.5.10.2. Market Analysis, Forecast, and Y-O-Y Growth Rate, 2018 - 2030, (US$ Million)
- 9.5.10.3. Rest of LATAM Market Size and Forecast, By Product, 2018 - 2030 (US$ Million)
- 9.5.10.4. Rest of LATAM Market Size and Forecast, By Application, 2018 - 2030 (US$ Million)
- 9.6. Middle East and Africa
- 9.6.1. Overview
- 9.6.2. LED phosphor Key Manufacturers in Middle East and Africa
- 9.6.3. Middle East and Africa Market Size and Forecast, By Country, 2018 - 2030 (US$ Million)
- 9.6.4. Middle East and Africa Market Size and Forecast, By Product, 2018 - 2030 (US$ Million)
- 9.6.5. Middle East and Africa Market Size and Forecast, By Application, 2018 - 2030 (US$ Million)
- 9.6.6. Saudi Arabia
- 9.6.6.1. Overview
- 9.6.6.2. Market Analysis, Forecast, and Y-O-Y Growth Rate, 2018 - 2030, (US$ Million)
- 9.6.6.3. Saudi Arabia Market Size and Forecast, By Product, 2018 - 2030 (US$ Million)
- 9.6.6.4. Saudi Arabia Market Size and Forecast, By Application, 2018 - 2030 (US$ Million)
- 9.6.7. United Arab Emirates
- 9.6.7.1. Overview
- 9.6.7.2. Market Analysis, Forecast, and Y-O-Y Growth Rate, 2018 - 2030, (US$ Million)
- 9.6.7.3. United Arab Emirates Market Size and Forecast, By Product, 2018 - 2030 (US$ Million)
- 9.6.7.4. United Arab Emirates Market Size and Forecast, By Application, 2018 - 2030 (US$ Million)
- 9.6.8. Israel
- 9.6.8.1. Overview
- 9.6.8.2. Market Analysis, Forecast, and Y-O-Y Growth Rate, 2018 - 2030, (US$ Million)
- 9.6.8.3. Israel Market Size and Forecast, By Product, 2018 - 2030 (US$ Million)
- 9.6.8.4. Israel Market Size and Forecast, By Application, 2018 - 2030 (US$ Million)
- 9.6.9. Turkey
- 9.6.9.1. Overview
- 9.6.9.2. Market Analysis, Forecast, and Y-O-Y Growth Rate, 2018 - 2030, (US$ Million)
- 9.6.9.3. Turkey Market Size and Forecast, By Product, 2018 - 2030 (US$ Million)
- 9.6.9.4. Turkey Market Size and Forecast, By Application, 2018 - 2030 (US$ Million)
- 9.6.10. Algeria
- 9.6.10.1. Overview
- 9.6.10.2. Market Analysis, Forecast, and Y-O-Y Growth Rate, 2018 - 2030, (US$ Million)
- 9.6.10.3. Algeria Market Size and Forecast, By Product, 2018 - 2030 (US$ Million)
- 9.6.10.4. Algeria Market Size and Forecast, By Application, 2018 - 2030 (US$ Million)
- 9.6.11. Egypt
- 9.6.11.1. Overview
- 9.6.11.2. Market Analysis, Forecast, and Y-O-Y Growth Rate, 2018 - 2030, (US$ Million)
- 9.6.11.3. Egypt Market Size and Forecast, By Product, 2018 - 2030 (US$ Million)
- 9.6.11.4. Egypt Market Size and Forecast, By Application, 2018 - 2030 (US$ Million)
- 9.6.12. Rest of MEA
- 9.6.12.1. Overview
- 9.6.12.2. Market Analysis, Forecast, and Y-O-Y Growth Rate, 2018 - 2030, (US$ Million)
- 9.6.12.3. Rest of MEA Market Size and Forecast, By Product, 2018 - 2030 (US$ Million)
- 9.6.12.4. Rest of MEA Market Size and Forecast, By Application, 2018 - 2030 (US$ Million)
10. Key Vendor Analysis- LED phosphor Industry
- 10.1. Competitive Dashboard
- 10.2. Company Profiles
- 10.2.1. Beijing Yuji International Co., Ltd.
- 10.2.2. Edison Opto Corporation
- 10.2.3. General Electric Company
- 10.2.4. Harvatek Corporation
- 10.2.5. Intematix Corporation
- 10.2.6. Leuchtstoffwerk Breitungen GmbH
- 10.2.7. Lumileds Holding B.V.
- 10.2.8. Luming Technology Group Co.,Ltd.
- 10.2.9. Materion Corporation
- 10.2.10. Mitsubishi Signage Corporation
- 10.2.11. Nichia Corporation
- 10.2.12. Nippon Electric Glass Co.,Ltd.
- 10.2.13. OSRAM GmbH
- 10.2.14. PhosphorTech Corporation
- 10.2.15. Tailorlux GmbH
- 10.2.16. Others
11. 360 Degree Analyst View
12. Appendix
- 12.1. Research Methodology
- 12.2. References
- 12.3. Abbreviations
- 12.4. Disclaimer
- 12.5. Contact Us
