|
|
市場調査レポート
商品コード
1401810
植物表現型解析装置市場:タイプ別、用途別、国別、地域別 - 産業分析、市場規模、市場シェア、2023年~2030年、予測Plant phenotyping Equipment Market, By Type, By Application, By Country, and By Region - Industry Analysis, Market Size, Market Share & Forecast from 2023-2030 |
||||||
|
|
|||||||
カスタマイズ可能
|
|||||||


| 植物表現型解析装置市場:タイプ別、用途別、国別、地域別 - 産業分析、市場規模、市場シェア、2023年~2030年、予測 |
|
出版日: 2023年12月01日
発行: AnalystView Market Insights
ページ情報: 英文 284 Pages
納期: 2~3営業日
|

- 全表示
- 概要
- 図表
- 目次
レポートハイライト
植物表現型解析装置市場規模は2022年に2億5,000万米ドルとなり、2023年から2030年にかけてCAGR 13.2%で拡大
植物表現型解析装置市場 - 市場力学
植物表現型解析装置市場の成長は、世界人口の増加による農産物需要の増加が牽引すると予測されます。
世界人口の増加により、農産物の需要増に対応するための食糧増産が必要となります。植物表現型分析装置は、作物の収量を最適化し、植物の特性を改善する上で重要な役割を果たしており、それによってより効率的で生産性の高い農業部門に貢献しています。世界人口の約45%は、農業が世帯主の主な職業である世帯に居住しています。このうち32%近くが貧困層に分類されます。また、経済調査局によると、米国の農業・食品・関連産業は2021年の国内総生産(GDP)に約1兆2,640億米ドルをもたらし、5.4%のシェアを占めています。センサーの強化、自動化、データ分析など、植物表現型判定技術の継続的な進歩は、市場に有望な機会を提供しています。しかし、一部の農家や農業利害関係者の間では、植物表現型解析装置の利点や能力に関する認識が不足しており、普及の妨げとなっています。
植物表現型解析装置市場 - 主要洞察
当社のリサーチアナリストが共有した分析によると、世界の植物表現型解析装置市場は、予測期間(2023年~2030年)に約13.2%のCAGRで毎年成長すると予測されています。
タイプセグメンテーションに基づくと、画像解析システムが2022年に最大市場シェアを示すと予測されました。
用途別では、品質評価が2022年の主要タイプでした。
地域別では、北米が2022年に主要な収益源となった。
植物表現型解析装置市場 - セグメンテーション分析:
世界の植物表現型解析装置市場は、タイプ、用途、地域に基づいてセグメント化されます。
市場はタイプによって4つのカテゴリーに分けられる:画像解析システム、キャノピー解析システム、マルチスペクトル科学カメラ、蛍光光度計、その他。画像解析システムは市場で大きな存在感を示しています。これらのシステムは、植物の特性、発育、環境影響に対する反応に関する包括的で測定可能なデータを提供することで、植物表現型解析ソリューションにおいて重要な役割を果たしています。
市場は用途に基づいて4つのカテゴリーに分けられる:植物調査、育種、製品開発、品質評価です。品質評価分野が市場を独占しています。品質評価用の植物表現型測定装置は、植物の全体的な品質に関連する形質を測定・分析するために設計されています。品質評価センサーを搭載したドローンなど、大規模農地やプランテーションをモニタリングするためのリモートセンシング技術の利用が増加しています。
植物表現型解析装置市場 - 地理的洞察
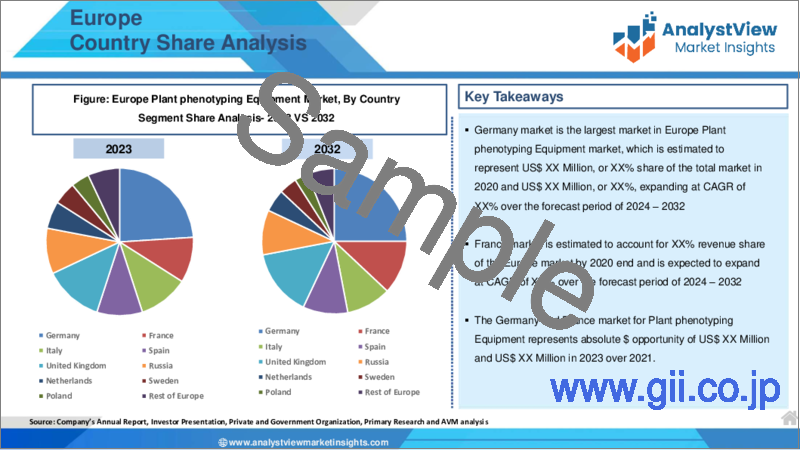
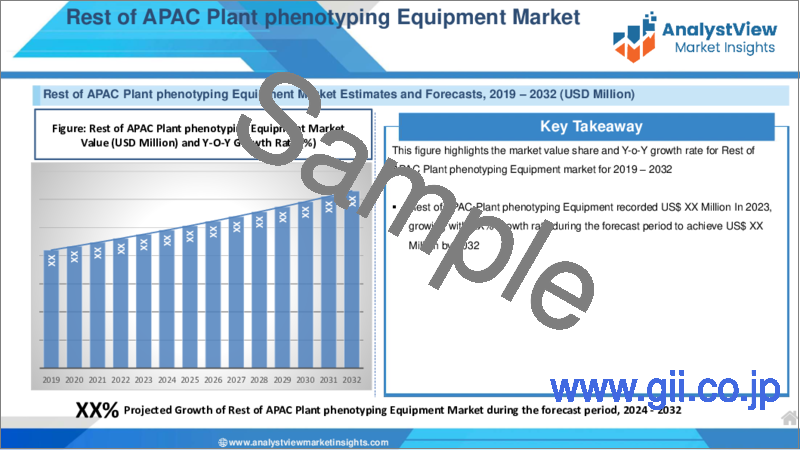
地域的には、植物表現型解析装置市場は、北米、ラテンアメリカ、欧州、アジア太平洋、中東・アフリカを含む様々な地域に広がっています。これらの地域は、事業活動に関与する国に基づいてさらに分割されます。市場の成長は、主に研究機関における植物表現型解析装置の採用増加により、北米が支配的になると予想されます。北米は常に技術革新の最前線にあり、この地域の研究機関は特に植物研究に最先端のツールを取り入れることに関心を持っています。研究開発プロジェクトに資金を提供できることが、先進的な植物表現型解析装置の採用をさらに促進しています。全米科学技術統計センターによると、HERD調査は毎年実施され、1会計年度に15万米ドル以上を別会計の研究開発に費やした米国の大学の情報を収集しています。一方、欧州は、主に植物遺伝学、育種、形質分析に焦点を当てた研究開発活動への投資により、今後数年間は第2位の市場シェアを維持します。
植物表現型解析装置市場 - 競合情勢:
植物表現型分析装置市場は、精密農業と作物改良の需要増加の結果として成長を経験しています。植物音声学は、生物学、工学、ロボット工学、データ解析を組み合わせて、植物の遺伝子がさまざまな生育条件下でどのように発現するかを理解する新興分野です。メーカーは、ハイスループット植物表現型解析装置の用途を拡大するため、畳み込みニューラルネットワークのような機械学習ベースの技術など、画像解析における最近の進歩を取り入れることに注力しています。さらに、機器メーカー、研究機関、農業関連企業の間で戦略的提携が結ばれ、フェノタイピング能力の強化が図られています。また、企業が特定のニッチに特化したり、さまざまな作物や研究プログラムの固有の要件に対応する高度にカスタマイズ可能なソリューションを提供したりする可能性もあります。
目次
第1章 植物表現型解析装置市場概要
- 調査範囲
- 市場推定年数
第2章 エグゼクティブサマリー
- 市場内訳
- 競合考察
第3章 植物表現型解析装置の主要な市場動向
- 市場促進要因
- 市場抑制要因
- 市場機会
- 今後の市場動向
第4章 植物表現型解析装置産業調査
- PEST分析
- ポーターのファイブフォース分析
- 成長見通しのマッピング
- 規制枠組みの分析
第5章 植物表現型解析装置市場:COVID-19感染症の影響分析
- 新型コロナウイルス感染症以前の影響分析
- 新型コロナウイルス感染症後の影響分析
第6章 植物表現型検査機器市場情勢
- 植物表現型解析装置市場シェア分析、2022年
- 主要メーカー別の内訳データ
- 既存企業の分析
- 新興企業の分析
第7章 植物表現型解析装置市場 - タイプ別
- 概要
- タイプ別セグメントシェア分析
- 画像解析システム
- キャノピー解析システム
- マルチスペクトル科学カメラ
- 蛍光光度計
- その他
第8章 植物表現型解析装置市場 - 用途別
- 概要
- 用途別のセグメントシェア分析
- 植物研究
- 育種
- 製品開発
- 品質評価
第9章 植物表現型解析装置市場 - 地域別
- イントロダクション
- 北米
- 概要
- 北米の主要メーカー
- 米国
- カナダ
- 欧州
- 概要
- 欧州の主要メーカー
- ドイツ
- イタリア
- 英国
- フランス
- ロシア
- オランダ
- スウェーデン
- ポーランド
- その他
- アジア太平洋(APAC)
- 概要
- アジア太平洋の主要メーカー
- インド
- 中国
- 日本
- 韓国
- オーストラリア
- タイ
- インドネシア
- フィリピン
- その他
- ラテンアメリカ
- 概要
- ラテンアメリカの主要メーカー
- ブラジル
- メキシコ
- アルゼンチン
- コロンビア
- その他
- 中東・アフリカ
- 概要
- 中東・アフリカの主要メーカー
- サウジアラビア
- アラブ首長国連邦
- イスラエル
- トルコ
- アルジェリア
- エジプト
- その他
第10章 主要ベンダー分析 - 植物表現型解析装置業界
- 競合ダッシュボード
- 企業プロファイル
- Phenomix Sciences
- Saga Robotics AS
- Kingsoft Office Software
- PHENOSPEX
- Keygene
- SMO bv
- BASF SE
- Controlled Environments Limited
- EarthSense, Inc.
- Qubit Biology Inc.
- LemnaTec GmbH
- Heinz Walz GmbH
- PSI(Photon Systems Instruments)spol. s ro
- その他
第11章 アナリストの全方位展望
List of Tables
- TABLE List of data sources
- TABLE Market drivers; Impact Analysis
- TABLE Market restraints; Impact Analysis
- TABLE Plant phenotyping Equipment Market: Type Snapshot (2022)
- TABLE Segment Dashboard; Definition and Scope, by Type
- TABLE Global Plant phenotyping Equipment Market, by Type 2018-2030 (USD Million)
- TABLE Plant phenotyping Equipment Market: Application Snapshot (2022)
- TABLE Segment Dashboard; Definition and Scope, by Application
- TABLE Global Plant phenotyping Equipment Market, by Application 2018-2030 (USD Million)
- TABLE Plant phenotyping Equipment Market: Regional snapshot (2022)
- TABLE Segment Dashboard; Definition and Scope, by Region
- TABLE Global Plant phenotyping Equipment Market, by Region 2018-2030 (USD Million)
- TABLE North America Plant phenotyping Equipment Market, by Country, 2018-2030 (USD Million)
- TABLE North America Plant phenotyping Equipment Market, by Type, 2018-2030 (USD Million)
- TABLE North America Plant phenotyping Equipment Market, by Application, 2018-2030 (USD Million)
- TABLE Europe Plant phenotyping Equipment Market, by Country, 2018-2030 (USD Million)
- TABLE Europe Plant phenotyping Equipment Market, by Type, 2018-2030 (USD Million)
- TABLE Europe Plant phenotyping Equipment Market, by Application, 2018-2030 (USD Million)
- TABLE Asia Pacific Plant phenotyping Equipment Market, by Country, 2018-2030 (USD Million)
- TABLE Asia Pacific Plant phenotyping Equipment Market, by Type, 2018-2030 (USD Million)
- TABLE Asia Pacific Plant phenotyping Equipment Market, by Application, 2018-2030 (USD Million)
- TABLE Latin America Plant phenotyping Equipment Market, by Country, 2018-2030 (USD Million)
- TABLE Latin America Plant phenotyping Equipment Market, by Type, 2018-2030 (USD Million)
- TABLE Latin America Plant phenotyping Equipment Market, by Application, 2018-2030 (USD Million)
- TABLE Middle East and Africa Plant phenotyping Equipment Market, by Country, 2018-2030 (USD Million)
- TABLE Middle East and Africa Plant phenotyping Equipment Market, by Type, 2018-2030 (USD Million)
- TABLE Middle East and Africa Plant phenotyping Equipment Market, by Application, 2018-2030 (USD Million)
REPORT HIGHLIGHT
Plant phenotyping Equipment Market size was valued at USD 250 Million in 2022, expanding at a CAGR of 13.2% from 2023 to 2030.
Plant phenotyping equipment plays a crucial role in understanding and analyzing the characteristics and traits of plants. This equipment assists researchers and agriculturists in gathering valuable data for plant breeding, crop improvement, and precision agriculture. The incorporation of technology in plant phenotyping continues to be essential in addressing global challenges related to food security and sustainable agriculture. However, traditional phenotyping methods that involve manual labor are time-consuming and demanding. Furthermore, the limited space and diverse types of growing structures present challenges for large-scale and high-throughput phenotyping. In this study, a cost-effective high-throughput phenotyping system was developed, capable of adapting to different growing bed structures while maintaining reliable spatial-temporal continuity. The system consisted of an affordable phenotype sensor network integrated with a Raspberry Pi board and camera module. By utilizing distributed camera sensors, the system can provide real-time crop imagery information throughout the entire growing bed. Additionally, the modularized image-processing architecture facilitates the examination of various phenotypic indices.
Plant Phenotyping Equipment Market- Market Dynamics
The growth of the Plant Phenotyping Equipment market is expected to be driven by the rising global population, which has led to an increased demand for agricultural goods.
The increasing global population necessitates a rise in food production to meet the growing demand for agricultural goods. Plant phenotyping equipment plays a vital role in optimizing crop yields and improving plant characteristics, thereby contributing to a more efficient and productive agriculture sector. Approximately 45% of the world's population resides in households where agricultural activities are the primary occupation of the household head. Among this group, nearly 32% are classified as poor. Additionally, the Agriculture, food, and related industries in the United States contributed approximately USD1.264 trillion to the country's gross domestic product (GDP) in 2021, accounting for a 5.4 percent share, according to the Economic Research Service. The continuous advancements in plant phenotyping technologies, including enhanced sensors, automation, and data analytics, offer promising opportunities for the market. However, the lack of awareness among some farmers and agricultural stakeholders regarding the benefits and capabilities of plant phenotyping equipment hinders its widespread adoption.
Plant phenotyping Equipment Market- Key Insights
As per the analysis shared by our research analyst, the global Plant Phenotyping Equipment market is estimated to grow annually at a CAGR of around 13.2% over the forecast period (2023-2030)
Based on Type segmentation, Image Analysis Systems was predicted to show maximum market share in the year 2022
Based on application segmentation, Quality Assessment was the leading type in 2022
Based on region, North America was the leading revenue generator in 2022
Plant Phenotyping Equipment Market- Segmentation Analysis:
The Global Plant Phenotyping Equipment Market is segmented based on Type, Application and Region.
The market is divided into four categories based on Type: Image Analysis Systems, Canopy Analysis Systems, Multispectral Scientific Cameras, Fluorometers and Others. Image analysis systems have a significant presence in the market. These systems play a crucial role in plant phenotyping solutions by offering comprehensive and measurable data on plant characteristics, development, and reactions to environmental influences.
The market is divided into four categories based on application: Plant Research, Breeding, Product Development and Quality Assessment. Quality Assessment segment dominates the market. Plant phenotyping equipment for quality assessment is designed to measure and analyze traits related to the overall quality of plants. Increasing use of remote sensing technologies, such as drones equipped with quality assessment sensors, for monitoring large agricultural fields and plantations.
Plant phenotyping Equipment Market- Geographical Insights
Geographically, the Plant Phenotyping Equipment market is spread across various regions including North America, Latin America, Europe, Asia Pacific, and the Middle East and Africa. These regions are further divided based on the countries involved in business activities. The growth of the market is expected to be dominated by North America, primarily due to the increasing adoption of Plant Phenotyping Equipment in research institutions. North America has always been at the forefront of technological innovation, and research institutions in this region are particularly interested in incorporating state-of-the-art tools for plant research. The availability of funding for research and development projects further facilitates the adoption of advanced plant phenotyping equipment. According to the National Center for Science and Engineering Statistics, the HERD Survey is conducted annually to gather information on U.S. colleges and universities that have spent at least USD150,000 on separately accounted-for R&D in a fiscal year. Europe, on the other hand, holds the second largest market share in the upcoming years, mainly due to the investments made in research and development activities focused on plant genetics, breeding, and trait analysis.
Plant Phenotyping Equipment Market- Competitive Landscape:
The plant phenotyping equipment market is experiencing growth as a result of the increasing demand for precision agriculture and crop improvement. Plant phonemics is an emerging field that combines biology, engineering, robotics, and data analysis to understand how plant genetics are expressed under various growing conditions. Manufacturers have been focusing on incorporating recent advancements in image analysis, such as machine learning-based techniques like convolutional neural networks, to expand the applications of high-throughput plant phenotyping equipment. Additionally, strategic alliances between equipment manufacturers, research institutions, and agricultural companies have been formed to enhance phenotyping capabilities. There is also potential for companies to specialize in specific niches or provide highly customizable solutions to cater to the unique requirements of different crops and research programs.
Recent Developments:
21 June 2022, The creation of a digital phenotype library by APPF is aimed at developing machine learning algorithms for the identification of plant stress. The ultimate goal of this project is to train these algorithms to accurately determine the specific type of environmental stress that plants are subjected to, using their morphology and/or spectral reflectance. This will enable the provision of targeted feedback to the growers.
SCOPE OF THE REPORT
The scope of this report covers the market by its major segments, which include as follows:
GLOBAL PLANT PHENOTYPING EQUIPMENT MARKET KEY PLAYERS
- Phenomix Sciences
- Saga Robotics AS
- Kingsoft Office Software
- PHENOSPEX
- Keygene
- SMO bv
- BASF SE
- Controlled Environments Limited
- EarthSense, Inc.
- Qubit Biology Inc.
- LemnaTec GmbH
- Heinz Walz GmbH
- PSI (Photon Systems Instruments) spol. s r.o.
- Others
GLOBAL PLANT PHENOTYPING EQUIPMENT MARKET, BY TYPE
- Image Analysis Systems
- Canopy Analysis Systems
- Multispectral Scientific Cameras
- Fluorometers
- Others
GLOBAL PLANT PHENOTYPING EQUIPMENT MARKET, BY APPLICATION
- Plant Research
- Breeding
- Product Development
- Quality Assessment
GLOBAL PLANT PHENOTYPING EQUIPMENT MARKET, BY REGION
- North America
- The U.S.
- Canada
- Europe
- Germany
- France
- Italy
- Spain
- United Kingdom
- Russia
- Netherlands
- Sweden
- Poland
- Rest of Europe
- Asia Pacific
- India
- China
- South Korea
- Japan
- Australia
- Thailand
- Indonesia
- Philippines
- Rest of APAC
- Latin America
- Brazil
- Mexico
- Argentina
- Colombia
- Rest of LATAM
- The Middle East and Africa
- Saudi Arabia
- United Arab Emirates
- Israel
- Turkey
- Algeria
- Egypt
- Rest of MEA
Table of Contents
1. Plant phenotyping Equipment Market Overview
- 1.1. Study Scope
- 1.2. Market Estimation Years
2. Executive Summary
- 2.1. Market Snippet
- 2.1.1. Plant phenotyping Equipment Market Snippet by Type
- 2.1.2. Plant phenotyping Equipment Market Snippet by Application
- 2.1.3. Plant phenotyping Equipment Market Snippet by Country
- 2.1.4. Plant phenotyping Equipment Market Snippet by Region
- 2.2. Competitive Insights
3. Plant phenotyping Equipment Key Market Trends
- 3.1. Plant phenotyping Equipment Market Drivers
- 3.1.1. Impact Analysis of Market Drivers
- 3.2. Plant phenotyping Equipment Market Restraints
- 3.2.1. Impact Analysis of Market Restraints
- 3.3. Plant phenotyping Equipment Market Opportunities
- 3.4. Plant phenotyping Equipment Market Future Trends
4. Plant phenotyping Equipment Industry Study
- 4.1. PEST Analysis
- 4.2. Porter's Five Forces Analysis
- 4.3. Growth Prospect Mapping
- 4.4. Regulatory Framework Analysis
5. Plant phenotyping Equipment Market: COVID-19 Impact Analysis
- 5.1. Pre-COVID-19 Impact Analysis
- 5.2. Post-COVID-19 Impact Analysis
- 5.2.1. Top Performing Segments
- 5.2.2. Marginal Growth Segments
- 5.2.3. Top Looser Segments
- 5.2.4. Marginal Loss Segments
6. Plant phenotyping Equipment Market Landscape
- 6.1. Plant phenotyping Equipment Market Share Analysis, 2022
- 6.2. Breakdown Data, by Key Manufacturer
- 6.2.1. Established Players' Analysis
- 6.2.2. Emerging Players' Analysis
7. Plant phenotyping Equipment Market - By Type
- 7.1. Overview
- 7.1.1. Segment Share Analysis, By Type, 2022 & 2030 (%)
- 7.1.2. Image Analysis Systems
- 7.1.3. Canopy Analysis Systems
- 7.1.4. Multispectral Scientific Cameras
- 7.1.5. Fluorometers
- 7.1.6. Others
8. Plant phenotyping Equipment Market - By Application
- 8.1. Overview
- 8.1.1. Segment Share Analysis, By Application, 2022 & 2030 (%)
- 8.1.2. Plant Research
- 8.1.3. Breeding
- 8.1.4. Product Development
- 8.1.5. Quality Assessment
9. Plant phenotyping Equipment Market- By Geography
- 9.1. Introduction
- 9.1.1. Segment Share Analysis, By Geography, 2022 & 2030 (%)
- 9.2. North America
- 9.2.1. Overview
- 9.2.2. Plant phenotyping Equipment Key Manufacturers in North America
- 9.2.3. North America Market Size and Forecast, By Country, 2018 - 2030 (US$ Million)
- 9.2.4. North America Market Size and Forecast, By Type, 2018 - 2030 (US$ Million)
- 9.2.5. North America Market Size and Forecast, By Application, 2018 - 2030 (US$ Million)
- 9.2.6. U.S.
- 9.2.6.1. Overview
- 9.2.6.2. Market Analysis, Forecast, and Y-O-Y Growth Rate, 2018 - 2030, (US$ Million)
- 9.2.6.3. U.S. Market Size and Forecast, By Type, 2018 - 2030 (US$ Million)
- 9.2.6.4. U.S. Market Size and Forecast, By Application, 2018 - 2030 (US$ Million)
- 9.2.7. Canada
- 9.2.7.1. Overview
- 9.2.7.2. Market Analysis, Forecast, and Y-O-Y Growth Rate, 2018 - 2030, (US$ Million)
- 9.2.7.3. Canada Market Size and Forecast, By Type, 2018 - 2030 (US$ Million)
- 9.2.7.4. Canada Market Size and Forecast, By Application, 2018 - 2030 (US$ Million)
- 9.3. Europe
- 9.3.1. Overview
- 9.3.2. Plant phenotyping Equipment Key Manufacturers in Europe
- 9.3.3. Europe Market Size and Forecast, By Country, 2018 - 2030 (US$ Million)
- 9.3.4. Europe Market Size and Forecast, By Type, 2018 - 2030 (US$ Million)
- 9.3.5. Europe Market Size and Forecast, By Application, 2018 - 2030 (US$ Million)
- 9.3.6. Germany
- 9.3.6.1. Overview
- 9.3.6.2. Market Analysis, Forecast, and Y-O-Y Growth Rate, 2018 - 2030, (US$ Million)
- 9.3.6.3. Germany Market Size and Forecast, By Type, 2018 - 2030 (US$ Million)
- 9.3.6.4. Germany Market Size and Forecast, By Application, 2018 - 2030 (US$ Million)
- 9.3.7. Italy
- 9.3.7.1. Overview
- 9.3.7.2. Market Analysis, Forecast, and Y-O-Y Growth Rate, 2018 - 2030, (US$ Million)
- 9.3.7.3. Italy Market Size and Forecast, By Type, 2018 - 2030 (US$ Million)
- 9.3.7.4. Italy Market Size and Forecast, By Application, 2018 - 2030 (US$ Million)
- 9.3.8. United Kingdom
- 9.3.8.1. Overview
- 9.3.8.2. Market Analysis, Forecast, and Y-O-Y Growth Rate, 2018 - 2030, (US$ Million)
- 9.3.8.3. United Kingdom Market Size and Forecast, By Type, 2018 - 2030 (US$ Million)
- 9.3.8.4. United Kingdom Market Size and Forecast, By Application, 2018 - 2030 (US$ Million)
- 9.3.9. France
- 9.3.9.1. Overview
- 9.3.9.2. Market Analysis, Forecast, and Y-O-Y Growth Rate, 2018 - 2030, (US$ Million)
- 9.3.9.3. France Market Size and Forecast, By Type, 2018 - 2030 (US$ Million)
- 9.3.9.4. France Market Size and Forecast, By Application, 2018 - 2030 (US$ Million)
- 9.3.10. Russia
- 9.3.10.1. Market Analysis, Forecast, and Y-O-Y Growth Rate, 2018 - 2030, (US$ Million)
- 9.3.10.2. Russia Market Size and Forecast, By Type, 2018 - 2030 (US$ Million)
- 9.3.10.3. Russia Market Size and Forecast, By Application, 2018 - 2030 (US$ Million)
- 9.3.11. Netherlands
- 9.3.11.1. Market Analysis, Forecast, and Y-O-Y Growth Rate, 2018 - 2030, (US$ Million)
- 9.3.11.2. Netherlands Market Size and Forecast, By Type, 2018 - 2030 (US$ Million)
- 9.3.11.3. Netherlands Market Size and Forecast, By Application, 2018 - 2030 (US$ Million)
- 9.3.12. Sweden
- 9.3.12.1. Market Analysis, Forecast, and Y-O-Y Growth Rate, 2018 - 2030, (US$ Million)
- 9.3.12.2. Sweden Market Size and Forecast, By Type, 2018 - 2030 (US$ Million)
- 9.3.12.3. Sweden Market Size and Forecast, By Application, 2018 - 2030 (US$ Million)
- 9.3.13. Poland
- 9.3.13.1. Market Analysis, Forecast, and Y-O-Y Growth Rate, 2018 - 2030, (US$ Million)
- 9.3.13.2. Poland Market Size and Forecast, By Type, 2018 - 2030 (US$ Million)
- 9.3.13.3. Poland Market Size and Forecast, By Application, 2018 - 2030 (US$ Million)
- 9.3.14. Rest of Europe
- 9.3.14.1. Overview
- 9.3.14.2. Market Analysis, Forecast, and Y-O-Y Growth Rate, 2018 - 2030, (US$ Million)
- 9.3.14.3. Rest of the Europe Market Size and Forecast, By Type, 2018 - 2030 (US$ Million)
- 9.3.14.4. Rest of the Europe Market Size and Forecast, By Application, 2018 - 2030 (US$ Million)
- 9.4. Asia Pacific (APAC)
- 9.4.1. Overview
- 9.4.2. Plant phenotyping Equipment Key Manufacturers in Asia Pacific
- 9.4.3. Asia Pacific Market Size and Forecast, By Country, 2018 - 2030 (US$ Million)
- 9.4.4. Asia Pacific Market Size and Forecast, By Type, 2018 - 2030 (US$ Million)
- 9.4.5. Asia Pacific Market Size and Forecast, By Application, 2018 - 2030 (US$ Million)
- 9.4.6. India
- 9.4.6.1. Overview
- 9.4.6.2. Market Analysis, Forecast, and Y-O-Y Growth Rate, 2018 - 2030, (US$ Million)
- 9.4.6.3. India Market Size and Forecast, By Type, 2018 - 2030 (US$ Million)
- 9.4.6.4. India Market Size and Forecast, By Application, 2018 - 2030 (US$ Million)
- 9.4.7. China
- 9.4.7.1. Overview
- 9.4.7.2. Market Analysis, Forecast, and Y-O-Y Growth Rate, 2018 - 2030, (US$ Million)
- 9.4.7.3. China Market Size and Forecast, By Type, 2018 - 2030 (US$ Million)
- 9.4.7.4. China Market Size and Forecast, By Application, 2018 - 2030 (US$ Million)
- 9.4.8. Japan
- 9.4.8.1. Overview
- 9.4.8.2. Market Analysis, Forecast, and Y-O-Y Growth Rate, 2018 - 2030, (US$ Million)
- 9.4.8.3. Japan Market Size and Forecast, By Type, 2018 - 2030 (US$ Million)
- 9.4.8.4. Japan Market Size and Forecast, By Application, 2018 - 2030 (US$ Million)
- 9.4.9. South Korea
- 9.4.9.1. Overview
- 9.4.9.2. Market Analysis, Forecast, and Y-O-Y Growth Rate, 2018 - 2030, (US$ Million)
- 9.4.9.3. South Korea Market Size and Forecast, By Type, 2018 - 2030 (US$ Million)
- 9.4.9.4. South Korea Market Size and Forecast, By Application, 2018 - 2030 (US$ Million)
- 9.4.10. Australia
- 9.4.10.1. Overview
- 9.4.10.2. Market Analysis, Forecast, and Y-O-Y Growth Rate, 2018 - 2030, (US$ Million)
- 9.4.10.3. Australia Market Size and Forecast, By Type, 2018 - 2030 (US$ Million)
- 9.4.10.4. Australia Market Size and Forecast, By Application, 2018 - 2030 (US$ Million)
- 9.4.11. Thailand
- 9.4.11.1. Overview
- 9.4.11.2. Market Analysis, Forecast, and Y-O-Y Growth Rate, 2018 - 2030, (US$ Million)
- 9.4.11.3. Thailand Market Size and Forecast, By Type, 2018 - 2030 (US$ Million)
- 9.4.11.4. Thailand Market Size and Forecast, By Application, 2018 - 2030 (US$ Million)
- 9.4.12. Indonesia
- 9.4.12.1. Overview
- 9.4.12.2. Market Analysis, Forecast, and Y-O-Y Growth Rate, 2018 - 2030, (US$ Million)
- 9.4.12.3. Indonesia Market Size and Forecast, By Type, 2018 - 2030 (US$ Million)
- 9.4.12.4. Indonesia Market Size and Forecast, By Application, 2018 - 2030 (US$ Million)
- 9.4.13. Philippines
- 9.4.13.1. Overview
- 9.4.13.2. Market Analysis, Forecast, and Y-O-Y Growth Rate, 2018 - 2030, (US$ Million)
- 9.4.13.3. Philippines Market Size and Forecast, By Type, 2018 - 2030 (US$ Million)
- 9.4.13.4. Philippines Market Size and Forecast, By Application, 2018 - 2030 (US$ Million)
- 9.4.14. Rest of APAC
- 9.4.14.1. Overview
- 9.4.14.2. Market Analysis, Forecast, and Y-O-Y Growth Rate, 2018 - 2030, (US$ Million)
- 9.4.14.3. Rest of APAC Market Size and Forecast, By Type, 2018 - 2030 (US$ Million)
- 9.4.14.4. Rest of APAC Market Size and Forecast, By Application, 2018 - 2030 (US$ Million)
- 9.5. Latin America
- 9.5.1. Overview
- 9.5.2. Plant phenotyping Equipment Key Manufacturers in Latin America
- 9.5.3. Latin America Market Size and Forecast, By Country, 2018 - 2030 (US$ Million)
- 9.5.4. Latin America Market Size and Forecast, By Type, 2018 - 2030 (US$ Million)
- 9.5.5. Latin America Market Size and Forecast, By Application, 2018 - 2030 (US$ Million)
- 9.5.6. Brazil
- 9.5.6.1. Overview
- 9.5.6.2. Market Analysis, Forecast, and Y-O-Y Growth Rate, 2018 - 2030, (US$ Million)
- 9.5.6.3. Brazil Market Size and Forecast, By Type, 2018 - 2030 (US$ Million)
- 9.5.6.4. Brazil Market Size and Forecast, By Application, 2018 - 2030 (US$ Million)
- 9.5.7. Mexico
- 9.5.7.1. Overview
- 9.5.7.2. Market Analysis, Forecast, and Y-O-Y Growth Rate, 2018 - 2030, (US$ Million)
- 9.5.7.3. Mexico Market Size and Forecast, By Type, 2018 - 2030 (US$ Million)
- 9.5.7.4. Mexico Market Size and Forecast, By Application, 2018 - 2030 (US$ Million)
- 9.5.8. Argentina
- 9.5.8.1. Overview
- 9.5.8.2. Market Analysis, Forecast, and Y-O-Y Growth Rate, 2018 - 2030, (US$ Million)
- 9.5.8.3. Argentina Market Size and Forecast, By Type, 2018 - 2030 (US$ Million)
- 9.5.8.4. Argentina Market Size and Forecast, By Application, 2018 - 2030 (US$ Million)
- 9.5.9. Colombia
- 9.5.9.1. Overview
- 9.5.9.2. Market Analysis, Forecast, and Y-O-Y Growth Rate, 2018 - 2030, (US$ Million)
- 9.5.9.3. Colombia Market Size and Forecast, By Type, 2018 - 2030 (US$ Million)
- 9.5.9.4. Colombia Market Size and Forecast, By Application, 2018 - 2030 (US$ Million)
- 9.5.10. Rest of LATAM
- 9.5.10.1. Overview
- 9.5.10.2. Market Analysis, Forecast, and Y-O-Y Growth Rate, 2018 - 2030, (US$ Million)
- 9.5.10.3. Rest of LATAM Market Size and Forecast, By Type, 2018 - 2030 (US$ Million)
- 9.5.10.4. Rest of LATAM Market Size and Forecast, By Application, 2018 - 2030 (US$ Million)
- 9.6. Middle East and Africa
- 9.6.1. Overview
- 9.6.2. Plant phenotyping Equipment Key Manufacturers in Middle East and Africa
- 9.6.3. Middle East and Africa Market Size and Forecast, By Country, 2018 - 2030 (US$ Million)
- 9.6.4. Middle East and Africa Market Size and Forecast, By Type, 2018 - 2030 (US$ Million)
- 9.6.5. Middle East and Africa Market Size and Forecast, By Application, 2018 - 2030 (US$ Million)
- 9.6.6. Saudi Arabia
- 9.6.6.1. Overview
- 9.6.6.2. Market Analysis, Forecast, and Y-O-Y Growth Rate, 2018 - 2030, (US$ Million)
- 9.6.6.3. Saudi Arabia Market Size and Forecast, By Type, 2018 - 2030 (US$ Million)
- 9.6.6.4. Saudi Arabia Market Size and Forecast, By Application, 2018 - 2030 (US$ Million)
- 9.6.7. United Arab Emirates
- 9.6.7.1. Overview
- 9.6.7.2. Market Analysis, Forecast, and Y-O-Y Growth Rate, 2018 - 2030, (US$ Million)
- 9.6.7.3. United Arab Emirates Market Size and Forecast, By Type, 2018 - 2030 (US$ Million)
- 9.6.7.4. United Arab Emirates Market Size and Forecast, By Application, 2018 - 2030 (US$ Million)
- 9.6.8. Israel
- 9.6.8.1. Overview
- 9.6.8.2. Market Analysis, Forecast, and Y-O-Y Growth Rate, 2018 - 2030, (US$ Million)
- 9.6.8.3. Israel Market Size and Forecast, By Type, 2018 - 2030 (US$ Million)
- 9.6.8.4. Israel Market Size and Forecast, By Application, 2018 - 2030 (US$ Million)
- 9.6.9. Turkey
- 9.6.9.1. Overview
- 9.6.9.2. Market Analysis, Forecast, and Y-O-Y Growth Rate, 2018 - 2030, (US$ Million)
- 9.6.9.3. Turkey Market Size and Forecast, By Type, 2018 - 2030 (US$ Million)
- 9.6.9.4. Turkey Market Size and Forecast, By Application, 2018 - 2030 (US$ Million)
- 9.6.10. Algeria
- 9.6.10.1. Overview
- 9.6.10.2. Market Analysis, Forecast, and Y-O-Y Growth Rate, 2018 - 2030, (US$ Million)
- 9.6.10.3. Algeria Market Size and Forecast, By Type, 2018 - 2030 (US$ Million)
- 9.6.10.4. Algeria Market Size and Forecast, By Application, 2018 - 2030 (US$ Million)
- 9.6.11. Egypt
- 9.6.11.1. Overview
- 9.6.11.2. Market Analysis, Forecast, and Y-O-Y Growth Rate, 2018 - 2030, (US$ Million)
- 9.6.11.3. Egypt Market Size and Forecast, By Type, 2018 - 2030 (US$ Million)
- 9.6.11.4. Egypt Market Size and Forecast, By Application, 2018 - 2030 (US$ Million)
- 9.6.12. Rest of MEA
- 9.6.12.1. Overview
- 9.6.12.2. Market Analysis, Forecast, and Y-O-Y Growth Rate, 2018 - 2030, (US$ Million)
- 9.6.12.3. Rest of MEA Market Size and Forecast, By Type, 2018 - 2030 (US$ Million)
- 9.6.12.4. Rest of MEA Market Size and Forecast, By Application, 2018 - 2030 (US$ Million)
10. Key Vendor Analysis- Plant phenotyping Equipment Industry
- 10.1. Competitive Dashboard
- 10.2. Company Profiles
- 10.2.1. Phenomix Sciences
- 10.2.2. Saga Robotics AS
- 10.2.3. Kingsoft Office Software
- 10.2.4. PHENOSPEX
- 10.2.5. Keygene
- 10.2.6. SMO bv
- 10.2.7. BASF SE
- 10.2.8. Controlled Environments Limited
- 10.2.9. EarthSense, Inc.
- 10.2.10. Qubit Biology Inc.
- 10.2.11. LemnaTec GmbH
- 10.2.12. Heinz Walz GmbH
- 10.2.13. PSI (Photon Systems Instruments) spol. s r.o.
- 10.2.14. Others
11. 360 Degree Analyst View
12. Appendix
- 12.1. Research Methodology
- 12.2. References
- 12.3. Abbreviations
- 12.4. Disclaimer
- 12.5. Contact Us
