|
|
市場調査レポート
商品コード
1388785
フレキシブルエレクトロニクス市場:コンポーネント別、回路構造別、アプリケーション別、国別、地域別 - 産業分析、市場規模、市場シェア、予測、2023-2030年Flexible Electronics Market, By Component, By Circuit Structure, By Application, By Country, and By Region -Industry Analysis, Market Size, Market Share & Forecast from 2023-2030 |
||||||
|
|
|||||||
|
● お客様のご希望に応じて、既存データの加工や未掲載情報(例:国別セグメント)の追加などの対応が可能です。 詳細はお問い合わせください。 |
|||||||


| フレキシブルエレクトロニクス市場:コンポーネント別、回路構造別、アプリケーション別、国別、地域別 - 産業分析、市場規模、市場シェア、予測、2023-2030年 |
|
出版日: 2023年11月01日
発行: AnalystView Market Insights
ページ情報: 英文 322 Pages
納期: 2~3営業日
|
- 全表示
- 概要
- 図表
- 目次
レポートハイライト
フレキシブルエレクトロニクスの市場規模は2022年に250億2,253万米ドルとなり、2023年から2030年にかけてCAGR 11.42%で拡大
フレキシブルエレクトロニクスは、ポリイミド、PEEK(ポリエーテルエーテルケトン)、透明導電性ポリエステルフィルムなどのフレキシブル基板に電子デバイスを実装し、電子回路を取り付ける技術として知られています。フレキシブルエレクトロニクスは、壊れにくく、柔軟性が高いため、小型電子機器への回路搭載が容易であることから、小型電子機器に好まれています。さらに、フレキシブルエレクトロニクスは、リジッドアクティブプラスチックディスプレイを統合することができます。フレキシブルエレクトロニクスは、フレキシブル太陽電池アレイやプラスチック基板で構成されるフレキシブルOLEDエレクトロニクスへの広範な応用から、著しい成長を遂げています。
フレキシブルエレクトロニクス市場-市場力学
利点に関する意識の高まりと政府支援の増加が市場を後押し
フレキシブルエレクトロニクスの世界市場の成長を加速させている主な要因は、フレキシブルエレクトロニクスを広範な用途に利用することの利点に関する認識が高まっていることです。スマートフォンやウェアラブルデバイスの受け入れ拡大、薄膜太陽電池モジュールの採用増加などが世界市場を牽引すると予想されます。しかし、フレキシブルでない製品のような代替品の存在は、世界のフレキシブルエレクトロニクス市場の抑制要因として作用すると予測されています。さらに、フレキシブルプリント回路は特殊用途向けに設計されており、回路設計、配線、写真製版の価格が高いです。さらに、技術面では、ヘルスケアや防衛産業を含む広大なエンドユーザー採用のための改善要求の高まりが、有利な機会を提供すると予測されます。また、照明技術や再生可能エネルギープロジェクトに対する政府支援の増加も、主要プレーヤーにとってトレンドとなる機会を提供すると予想されます。ヘルスケアアプリケーションでは、フレキシブルデバイスの導入が増加していることが、予測されるフレキシブルエレクトロニクス市場の収益を押し上げる重要な要因となっています。
フレキシブルエレクトロニクス市場-セグメンテーション分析:
フレキシブルエレクトロニクスの世界市場は、コンポーネント、回路構造、アプリケーション、地域によって区分されます。
市場は、コンポーネントに基づいて、メモリーデバイス、ディスプレイ、センサー、電池、その他の4つのカテゴリーに分けられます。予測期間中、最も高い成長率を示すのはディスプレイ分野です。このセグメントは、巻いたり、曲げたり、柔軟性を提供できる高度なディスプレイに対する消費者からの需要が高まっていることに起因しています。さらに、フレキシブルディスプレイは消費電力が少ないため、従来のディスプレイよりもエネルギー効率が高いです。
同市場は、用途によって産業用、コンシューマーエレクトロニクス用、ヘルスケア用、車載用、その他の4つに分類されます。コンシューマーエレクトロニクス分野は、予測期間中も優位性を維持しそうです。スマートフォン、スマートウォッチ、ノートパソコンなど、電池寿命が長く軽量な製品への需要が高まっています。フレキシブル電池、センサー、ディスプレイを統合し、より高品質な製品を提供しようとするメーカーの姿勢は、スマートコンポーネントの採用を増加させ、コンシューマーエレクトロニクス分野の成長をさらに後押しすると予想されます。
フレキシブルエレクトロニクス市場-地域別インサイト
地域別に見ると、フレキシブルエレクトロニクス市場は北米、アジア太平洋地域、欧州、その他世界の地域に区分されます。北米はフレキシブルエレクトロニクス市場の収益シェアを加速させると予測されています。効果的なユーザー体験を提供するスマートデバイスやウェアラブルに対する需要の高まりが、市場成長の主な要因の1つです。消費者は日常生活に無理なく溶け込む製品を求めており、メーカー各社は人間の形状に適合し、快適で邪魔にならない機能を提供できるフレキシブルエレクトロニクスを開発する必要に迫られています。この動向は、材料サプライヤー、デザイン会社、エレクトロニクスメーカー間のコラボレーションを後押しし、フレキシブルエレクトロニクスで可能なことの限界を押し広げ、イノベーションを促進しています。さらに、アジア太平洋地域が予測期間中に最も高い成長率を示すと予想されています。この成長は、スマートな電気自動車の台頭や、自動車分野での民生用エレクトロニクスの応用範囲の広さによるものと予想されます。さらに、ポータブルで革新的なデバイスに対する需要の増加が、同地域におけるフレキシブルエレクトロニクスの成長を支えるものと予想されます。
フレキシブルエレクトロニクス市場-競合情勢:
業界各社は、スマートビルの電力管理やゼロ電力用ワイヤレスセンサー、農業現場報告/モニタリングデバイス、情報ロガー伝送などの新しいアプリケーションを可能にする最先端技術を駆使し、競争優位性を獲得しています。さらに、市場プレーヤーは、競合情勢の中で浮揚するために、M&A、地域情勢別拡大、パートナーシップなどの様々な成長戦略に取り組んでいます。例えば、2023年1月のCES 2023で、LG Displayはデスクトップとテレビ用の最新OLEDディスプレイを発表しました。韓国のショーパネル・メーカーによると、この企業のOLEDディスプレイは究極の輝度を持ち、2,100台で、先行するプレミアムOLEDスクリーンより60%大きいです。
目次
第1章 フレキシブルエレクトロニクス市場概要
- 調査範囲
- 市場推定年数
第2章 エグゼクティブサマリー
- 市場内訳
- 競合考察
第3章 フレキシブルエレクトロニクスの主要市場動向
- 市場促進要因
- 市場抑制要因
- 市場機会
- 今後の市場動向
第4章 フレキシブルエレクトロニクス産業の調査
- PEST分析
- ポーターのファイブフォース分析
- 成長見通しのマッピング
- 規制枠組みの分析
第5章 フレキシブルエレクトロニクス市場:COVID-19の影響分析
- COVID-19以前の影響分析
- COVID-19以後の影響分析
第6章 フレキシブルエレクトロニクス市場情勢
- フレキシブルエレクトロニクス市場シェア分析、2022年
- 主要メーカー別の内訳データ
- 既存企業の分析
- 新興企業の分析
第7章 フレキシブルエレクトロニクス市場:コンポーネント別
- 概要
- コンポーネント別のセグメントシェア分析
- メモリデバイス
- ディスプレイ
- センサー
- 電池
- その他
第8章 フレキシブルエレクトロニクス市場:回路構造別
- 概要
- 回路構造別のセグメントシェア分析
- スカルプチャー
- マルチレイヤー
- 両面
- 片面
- その他
第9章 フレキシブルエレクトロニクス市場:アプリケーション別
- 概要
- アプリケーション別のセグメントシェア分析
- 産業
- コンシューマーエレクトロニクス
- ヘルスケア
- 自動車
- その他
第10章 フレキシブルエレクトロニクス市場:地域別
- イントロダクション
- 北米
- 概要
- 北米の主要メーカー
- 米国
- カナダ
- 欧州
- 概要
- 欧州の主要メーカー
- ドイツ
- イタリア
- 英国
- フランス
- ロシア
- オランダ
- スウェーデン
- ポーランド
- その他
- アジア太平洋(APAC)
- 概要
- アジア太平洋地域の主要メーカー
- インド
- 中国
- 日本
- 韓国
- オーストラリア
- タイ
- インドネシア
- フィリピン
- その他
- ラテンアメリカ
- 概要
- ラテンアメリカの主要メーカー
- ブラジル
- メキシコ
- アルゼンチン
- コロンビア
- その他
- 中東とアフリカ
- 概要
- 中東とアフリカの主要メーカー
- サウジアラビア
- アラブ首長国連邦
- イスラエル
- トルコ
- アルジェリア
- エジプト
- その他
第11章 主要ベンダー分析:フレキシブルエレクトロニクス産業
- 競合ダッシュボード
- 企業プロファイル
- SAMSUNG
- ITN Energy Systems Inc.
- 3M
- MFLEX
- First Solar
- Au Optronics Corp.
- E INK HOLDINGS INC
- Enfucell Softbattery
- General Electric
- SOLAR FRONTIER KK
- LG Electronics
- Blue Spark Technologies
- Palo Alto Research Center LLC
- SOLAR FRONTIER KK
第12章 アナリストの全方位展望
List of Tables
- TABLE List of data sources
- TABLE Market drivers; Impact Analysis
- TABLE Market restraints; Impact Analysis
- TABLE Flexible Electronics Market: Component Snapshot (2022)
- TABLE Segment Dashboard; Definition and Scope, by Component
- TABLE Global Flexible Electronics Market, by Component2018-2030 (USD Million)
- TABLE Flexible Electronics Market: Circuit StructureSnapshot (2022)
- TABLE Segment Dashboard; Definition and Scope, by Circuit Structure
- TABLE Global Flexible Electronics Market, by Circuit Structure2018-2030 (USD Million)
- TABLE Flexible Electronics Market: Application Snapshot (2022)
- TABLE Segment Dashboard; Definition and Scope, by Application
- TABLE Global Flexible Electronics Market, by Application 2018-2030 (USD Million)
- TABLE Flexible Electronics Market: Regional snapshot (2022)
- TABLE Segment Dashboard; Definition and Scope, by Region
- TABLE Global Flexible Electronics Market, by Region 2018-2030 (USD Million)
- TABLE North America Flexible Electronics Market, by Country, 2018-2030 (USD Million)
- TABLE North America Flexible Electronics Market, by Component, 2018-2030 (USD Million)
- TABLE North America Flexible Electronics Market, by Circuit Structure, 2018-2030 (USD Million)
- TABLE North America Flexible Electronics Market, by Application, 2018-2030 (USD Million)
- TABLE Europe Flexible Electronics Market, by Country, 2018-2030 (USD Million)
- TABLE Europe Flexible Electronics Market, by Component, 2018-2030 (USD Million)
- TABLE Europe Flexible Electronics Market, by Circuit Structure, 2018-2030 (USD Million)
- TABLE Europe Flexible Electronics Market, by Application, 2018-2030 (USD Million)
- TABLE Asia Pacific Flexible Electronics Market, by Country, 2018-2030 (USD Million)
- TABLE Asia Pacific Flexible Electronics Market, by Component, 2018-2030 (USD Million)
- TABLE Asia Pacific Flexible Electronics Market, by Circuit Structure, 2018-2030 (USD Million)
- TABLE Asia Pacific Flexible Electronics Market, by Application, 2018-2030 (USD Million)
- TABLE Latin America Flexible Electronics Market, by Country, 2018-2030 (USD Million)
- TABLE Latin America Flexible Electronics Market, by Component, 2018-2030 (USD Million)
- TABLE Latin America Flexible Electronics Market, by Circuit Structure, 2018-2030 (USD Million)
- TABLE Latin America Flexible Electronics Market, by Application, 2018-2030 (USD Million)
- TABLE Middle East and Africa Flexible Electronics Market, by Country, 2018-2030 (USD Million)
- TABLE Middle East and Africa Flexible Electronics Market, by Component, 2018-2030 (USD Million)
- TABLE Middle East and Africa Flexible Electronics Market, by Circuit Structure, 2018-2030 (USD Million)
- TABLE Middle East and Africa Flexible Electronics Market, by Application, 2018-2030 (USD Million)
List of Figures
- FIGURE Flexible Electronics Market Segmentation
- FIGURE Market research methodology
- FIGURE Value chain analysis
- FIGURE Porter's Five Forces Analysis
- FIGURE Market Attractiveness Analysis
- FIGURE COVID-19 Impact Analysis
- FIGURE Pre & Post COVID-19 Impact Comparision Study
- FIGURE Competitive Landscape; Key company market share analysis, 2022
- FIGURE Component segment market share analysis, 2022&2030
- FIGURE Component segment market size forecast and trend analysis, 2018 to 2030 (USD Million)
- FIGURE Circuit Structure segment market share analysis, 2022&2030
- FIGURE Circuit Structure segment market size forecast and trend analysis, 2018 to 2030 (USD Million)
- FIGURE Application segment market share analysis, 2022&2030
- FIGURE Application segment market size forecast and trend analysis, 2018 to 2030 (USD Million)
- FIGURE Regional segment market share analysis, 2022&2030
- FIGURE Regional segment market size forecast and trend analysis, 2018 to 2030 (USD Million)
- FIGURE North America Flexible Electronics Market share and leading players, 2022
- FIGURE Europe Flexible Electronics Market share and leading players, 2022
- FIGURE Asia Pacific Flexible Electronics Market share and leading players, 2022
- FIGURE Latin America Flexible Electronics Market share and leading players, 2022
- FIGURE Middle East and Africa Flexible Electronics Market share and leading players, 2022
- FIGURE North America market share analysis by country, 2022
- FIGURE U.S. Flexible Electronics Market size, forecast and trend analysis, 2018 to 2030 (USD Million)
- FIGURE Canada Flexible Electronics Market size, forecast and trend analysis, 2018 to 2030 (USD Million)
- FIGURE Europe Flexible Electronics Market share analysis by country, 2022
- FIGURE Germany Flexible Electronics Market size, forecast and trend analysis, 2018 to 2030 (USD Million)
- FIGURE Spain Flexible Electronics Market size, forecast and trend analysis, 2018 to 2030 (USD Million)
- FIGURE Italy Flexible Electronics Market size, forecast and trend analysis, 2018 to 2030 (USD Million)
- FIGURE France Flexible Electronics Market size, forecast and trend analysis, 2018 to 2030 (USD Million)
- FIGURE UK Flexible Electronics Market size, forecast and trend analysis, 2018 to 2030 (USD Million)
- FIGURE Russia Flexible Electronics Market size, forecast and trend analysis, 2018 to 2030 (USD Million)
- FIGURE Netherlands Flexible Electronics Market size, forecast and trend analysis, 2018 to 2030 (USD Million)
- FIGURE Sweden Flexible Electronics Market size, forecast and trend analysis, 2018 to 2030 (USD Million)
- FIGURE Poland Flexible Electronics Market size, forecast and trend analysis, 2018 to 2030 (USD Million)
- FIGURE Rest of the Europe Flexible Electronics Market size, forecast and trend analysis, 2018 to 2030 (USD Million)
- FIGURE Asia Pacific Flexible Electronics Market share analysis by country, 2022
- FIGURE India Flexible Electronics Market size, forecast and trend analysis, 2018 to 2030 (USD Million)
- FIGURE China Flexible Electronics Market size, forecast and trend analysis, 2018 to 2030 (USD Million)
- FIGURE Japan Flexible Electronics Market size, forecast and trend analysis, 2018 to 2030 (USD Million)
- FIGURE South Korea Flexible Electronics Market size, forecast and trend analysis, 2018 to 2030 (USD Million)
- FIGURE Australia Flexible Electronics Market size, forecast and trend analysis, 2018 to 2030 (USD Million)
- FIGURE Thailand Flexible Electronics Market size, forecast and trend analysis, 2018 to 2030 (USD Million)
- FIGURE Indonesia Flexible Electronics Market size, forecast and trend analysis, 2018 to 2030 (USD Million)
- FIGURE Phillipines Flexible Electronics Market size, forecast and trend analysis, 2018 to 2030 (USD Million)
- FIGURE Rest of APAC Flexible Electronics Market size, forecast and trend analysis, 2018 to 2030 (USD Million)
- FIGURE Latin America Flexible Electronics Market size, forecast and trend analysis, 2018 to 2030 (USD Million)
- FIGURE Latin America Flexible Electronics Market share analysis by country, 2022
- FIGURE Brazil Flexible Electronics Market size, forecast and trend analysis, 2018 to 2030 (USD Million)
- FIGURE Mexico Flexible Electronics Market size, forecast and trend analysis, 2018 to 2030 (USD Million)
- FIGURE Argentina Flexible Electronics Market size, forecast and trend analysis, 2018 to 2030 (USD Million)
- FIGURE Colombia Flexible Electronics Market size, forecast and trend analysis, 2018 to 2030 (USD Million)
- FIGURE Rest of LATAM Flexible Electronics Market size, forecast and trend analysis, 2018 to 2030 (USD Million)
- FIGURE Middle East and Africa Flexible Electronics Market size, forecast and trend analysis, 2018 to 2030 (USD Million)
- FIGURE Middle East and Africa Flexible Electronics Market share analysis by country, 2022
- FIGURE Saudi Arabia Flexible Electronics Market size, forecast and trend analysis, 2018 to 2030 (USD Million)
- FIGURE United Arab Emirates Flexible Electronics Market size, forecast and trend analysis, 2018 to 2030 (USD Million)
- FIGURE Israel Flexible Electronics Market size, forecast and trend analysis, 2018 to 2030 (USD Million)
- FIGURE Turkey Flexible Electronics Market size, forecast and trend analysis, 2018 to 2030 (USD Million)
- FIGURE Algeria Flexible Electronics Market size, forecast and trend analysis, 2018 to 2030 (USD Million)
- FIGURE Egypt Flexible Electronics Market size, forecast and trend analysis, 2018 to 2030 (USD Million)
- FIGURE Rest of MEA Flexible Electronics Market size, forecast and trend analysis, 2018 to 2030 (USD Million)
REPORT HIGHLIGHT
Flexible electronics market size was valued at USD 25,022.53 Million in 2022, expanding at a CAGR of 11.42% from 2023 to 2030.
Flexible electronics is known as the technology for attaching electronic circuitry by mounting the electronic devices on flexible substrates such as polyimide, PEEK (Polyether Ether Ketone), and transparent conductive polyester film. Flexible electronics are preferred for the small electronics devices as it is unbreakable and more flexible which makes it simple to install a circuit in the small devices. Additionally, flexible electronics can integrate a rigid active plastic display. Flexible electronics have witnessed significant growth, ranging from the extensive applications in flexible solar cell arrays and flexible OLED electronics which are made up of a plastic substrate.
Flexible Electronics Market- Market Dynamics
Growing awareness regarding the advantages and increasing government support propels the market
The major factor accounting for accelerating the growth of the global flexible electronics market is the rising awareness regarding the advantages of utilizing flexible electronics in vast applications. The growing acceptance of smartphones and wearable devices and the increasing adoption of thin-film solar modules are anticipated to drive the global market. However, the presence of recognized substitutes such as inflexible products is projected to act as a restraining factor in the global flexible electronics market. Furthermore, the flexible printed circuits are designed for special applications, and the price of circuit design, wiring, and photographic plate is high. Moreover, in terms of technology, the rising requirement for improvements for a vast end-user adoption including the healthcare and defense industry is predicted to offer lucrative opportunities. The lighting technologies and increasing government support for renewable energy projects are also expected to tender trending opportunities for the key players. In healthcare applications, the rising implementation of flexible devices is a significant factor that will fuel the flexible electronics market revenue in the forecast years.
Flexible Electronics Market- Key Insights
- As per the analysis shared by our research analyst, the global flexible electronics market is estimated to grow annually at a CAGR of around 11.42% over the forecast period (2023-2030)
- The flexible electronics industry is projected to grow at a significant rate due to the increasing acceptance of smartphones and wearable devices
- Based on component segmentation, displays was predicted to show maximum market share in the year 2022
- Based on region, North America was the leading revenue generator in 2022
Flexible Electronics Market- Segmentation Analysis:
The global flexible electronics market is segmented on the basis of Component, Circuit Structure, Application, and region.
The market is divided into four categories based on components: memory devices, displays, sensors, batteries, and others. The displays segment is accounted to witness the highest growth rate over the forecast period. The segment is attributed to the rising demand from consumers for advanced displays that can roll, bend, or provide a level of flexibility. Additionally, flexible displays are more energy efficient than conventional displays because they consume less power.
The market is divided into four categories based on applications: industrial, consumer electronics, healthcare, automotive, and others. The consumer electronics segment is likely to maintain its dominance in the forecast period. Demand is increasing for products including, smartphones, smartwatches, and laptops that have extended battery life and are lightweight. Manufacturers' approach toward integrating flexible batteries, sensors, and displays to introduce more products with improved quality is increasing the adoption of smart components further anticipated to support the growth of the consumer electronics segment.
Flexible Electronics Market- Geographical Insights
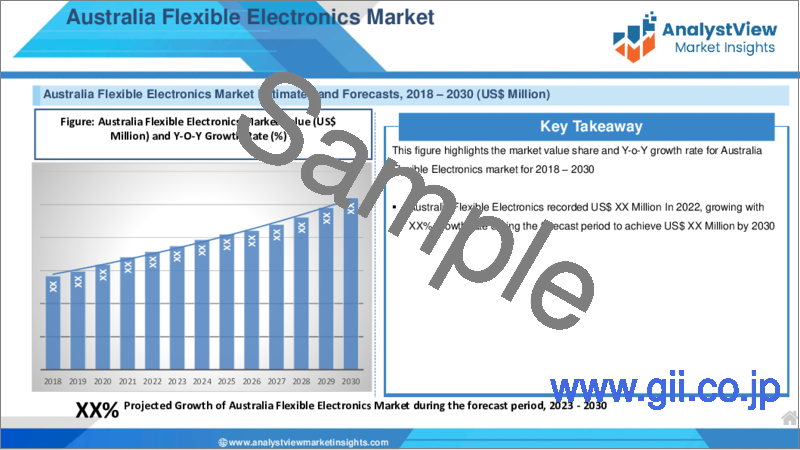
Region-wise, the flexible electronics market can be segmented into North America, Asia Pacific, Europe, and the Rest of the World. North America is projected to accelerate the flexible electronics market revenue share. The growing demand for smart devices and wearables that provide effective user experiences is one of the major drivers for the growth of the market. Consumers want products that effortlessly integrate into their daily lives, pushing manufacturers to develop flexible electronics that can conform to the human shape and offer comfortable, unobtrusive functionality. This trend has aided collaborations between material suppliers, design firms, and electronics manufacturers, pushing the boundaries and fostering innovation of what's possible with flexible electronics. Furthermore, Asia Pacific is expected to witness the highest growth rate over the forecast rate. This growth can be anticipated due to the rise of smart electric vehicles and in the automotive sector, the vast applicability of consumer electronics. Additionally, increasing demand for portable and innovative devices is expected to support the growth of flexible electronics in the region.
Flexible Electronics Market- Competitive Landscape:
Prominent industry members use cutting-edge techniques that enable new applications, such as smart building power management and wireless sensors for zero power, agriculture field reporting/monitoring devices, and information logger transmission to gain competitive advantage. Moreover, market players engage in various growth strategies, such as mergers & acquisitions, geographical expansion, and partnerships, to stay afloat in the competitive landscape scenario. For instance, in January 2023At CES 2023, LG Display introduced its newest OLED displays for desktops and TVs. The business's OLED displays have an ultimate luminance, of 2,100 units, that's 60% greater than its preceding premium OLED screens, according to the South Korean show panel producer.
Recent Developments:
For instance, in June 2023, FLEX PLUS, an innovative high-value-added battery package from Forsee Power, is now available for large electric vehicles. The newly announced FLEX PLUS battery pack rounds out the PLUS format business family, which currently includes ZEN PLUS, a high-energy battery pack range..
SCOPE OF THE REPORT
The scope of this report covers the market by its major segments, which include as follows:
GLOBAL FLEXIBLE ELECTRONICS MARKET KEY PLAYERS
- SAMSUNG
- ITN Energy Systems Inc.
- 3M
- MFLEX
- First Solar
- Au Optronics Corp.
- E INK HOLDINGS INC
- Enfucell Softbattery
- General Electric
- SOLAR FRONTIER K.K.
- LG Electronics
- Blue Spark Technologies
- Palo Alto Research Center LLC
- SOLAR FRONTIER K.K.
GLOBALFLEXIBLE ELECTRONICS MARKET, BY COMPONENT
- Memory Devices
- Displays
- Sensors
- Batteries
- Others
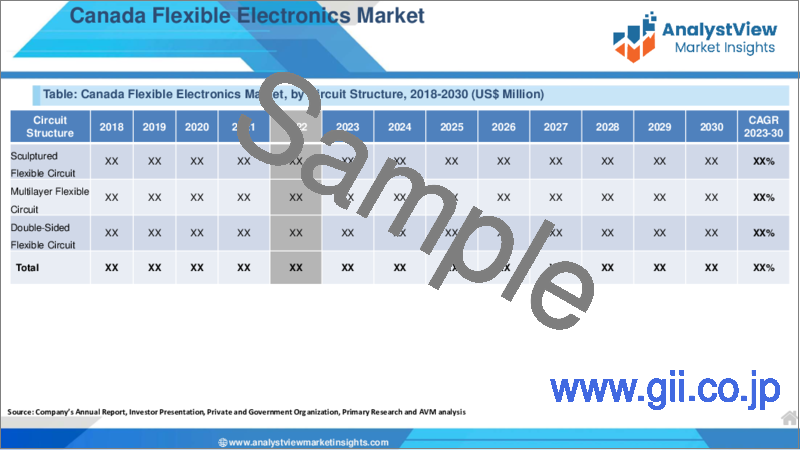
GLOBAL FLEXIBLE ELECTRONICS MARKET, BY CIRCUIT STRUCTURE
- Sculptured Flexible Circuit
- Multilayer Flexible Circuit
- Double-Sided Flexible Circuit
- Single-Sided Flexible Circuit
- Others
GLOBAL FLEXIBLE ELECTRONICS MARKET, BY APPLICATION
- Industrial
- Consumer Electronics
- Healthcare
- Automotive
- Others
GLOBAL FLEXIBLE ELECTRONICS MARKET, BY REGION
- North America
- The U.S.
- Canada
- Europe
- Germany
- France
- Italy
- Spain
- United Kingdom
- Russia
- Netherlands
- Sweden
- Poland
- Rest of Europe
- Asia Pacific
- India
- China
- South Korea
- Japan
- Australia
- Thailand
- Indonesia
- Philippines
- Rest of APAC
- Latin America
- Brazil
- Mexico
- Argentina
- Colombia
- Rest of LATAM
- The Middle East and Africa
- Saudi Arabia
- United Arab Emirates
- Israel
- Turkey
- Algeria
- Egypt
- Rest of MEA
Table of Contents
1. Flexible Electronics Market Overview
- 1.1. Study Scope
- 1.2. Market Estimation Years
2. Executive Summary
- 2.1. Market Snippet
- 2.1.1. Flexible Electronics Market Snippet by Component
- 2.1.2. Flexible Electronics Market Snippet by Circuit Structure
- 2.1.3. Flexible Electronics Market Snippet by Application
- 2.1.4. Flexible Electronics Market Snippet by Country
- 2.1.5. Flexible Electronics Market Snippet by Region
- 2.2. Competitive Insights
3. Flexible Electronics Key Market Trends
- 3.1. Flexible Electronics Market Drivers
- 3.1.1. Impact Analysis of Market Drivers
- 3.2. Flexible Electronics Market Restraints
- 3.2.1. Impact Analysis of Market Restraints
- 3.3. Flexible Electronics Market Opportunities
- 3.4. Flexible Electronics Market Future Trends
4. Flexible Electronics Industry Study
- 4.1. PEST Analysis
- 4.2. Porter's Five Forces Analysis
- 4.3. Growth Prospect Mapping
- 4.4. Regulatory Framework Analysis
5. Flexible Electronics Market: COVID-19 Impact Analysis
- 5.1. Pre-COVID-19 Impact Analysis
- 5.2. Post-COVID-19 Impact Analysis
- 5.2.1. Top Performing Segments
- 5.2.2. Marginal Growth Segments
- 5.2.3. Top Looser Segments
- 5.2.4. Marginal Loss Segments
6. Flexible Electronics Market Landscape
- 6.1. Flexible Electronics Market Share Analysis, 2022
- 6.2. Breakdown Data, by Key Manufacturer
- 6.2.1. Established Players' Analysis
- 6.2.2. Emerging Players' Analysis
7. Flexible Electronics Market - By Component
- 7.1. Overview
- 7.1.1. Segment Share Analysis, By Component, 2022&2030 (%)
- 7.1.2. Memory Devices
- 7.1.3. Displays
- 7.1.4. Sensors
- 7.1.5. Batteries
- 7.1.6. Others
8. Flexible Electronics Market - By Circuit Structure
- 8.1. Overview
- 8.1.1. Segment Share Analysis, By Circuit Structure, 2022&2030 (%)
- 8.1.2. Sculptured Flexible Circuit
- 8.1.3. Multilayer Flexible Circuit
- 8.1.4. Double-Sided Flexible Circuit
- 8.1.5. Single-Sided Flexible Circuit
- 8.1.6. Others
9. Flexible Electronics Market - By Application
- 9.1. Overview
- 9.1.1. Segment Share Analysis, By Application, 2022&2030 (%)
- 9.1.2. Industrial
- 9.1.3. Consumer Electronics
- 9.1.4. Healthcare
- 9.1.5. Automotive
- 9.1.6. Others
10. Flexible Electronics Market- By Geography
- 10.1. Introduction
- 10.1.1. Segment Share Analysis, By Geography, 2022&2030 (%)
- 10.2. North America
- 10.2.1. Overview
- 10.2.2. Flexible Electronics Key Manufacturers in North America
- 10.2.3. North America Market Size and Forecast, By Country, 2018 - 2030 (US$ Million)
- 10.2.4. North America Market Size and Forecast, By Component, 2018 - 2030 (US$ Million)
- 10.2.5. North America Market Size and Forecast, By Circuit Structure, 2018 - 2030 (US$ Million)
- 10.2.6. North America Market Size and Forecast, By Application, 2018 - 2030 (US$ Million)
- 10.2.7. U.S.
- 10.2.7.1. Overview
- 10.2.7.2. Market Analysis, Forecast, and Y-O-Y Growth Rate, 2018 - 2030, (US$ Million)
- 10.2.7.3. U.S. Market Size and Forecast, By Component, 2018 - 2030 (US$ Million)
- 10.2.7.4. U.S. Market Size and Forecast, By Circuit Structure, 2018 - 2030 (US$ Million)
- 10.2.7.5. U.S. Market Size and Forecast, By Application, 2018 - 2030 (US$ Million)
- 10.2.8. Canada
- 10.2.8.1. Overview
- 10.2.8.2. Market Analysis, Forecast, and Y-O-Y Growth Rate, 2018 - 2030, (US$ Million)
- 10.2.8.3. Canada Market Size and Forecast, By Component, 2018 - 2030 (US$ Million)
- 10.2.8.4. Canada Market Size and Forecast, By Circuit Structure, 2018 - 2030 (US$ Million)
- 10.2.8.5. Canada Market Size and Forecast, By Application, 2018 - 2030 (US$ Million)
- 10.3. Europe
- 10.3.1. Overview
- 10.3.2. Flexible Electronics Key Manufacturers in Europe
- 10.3.3. Europe Market Size and Forecast, By Country, 2018 - 2030 (US$ Million)
- 10.3.4. Europe Market Size and Forecast, By Component, 2018 - 2030 (US$ Million)
- 10.3.5. Europe Market Size and Forecast, By Circuit Structure, 2018 - 2030 (US$ Million)
- 10.3.6. Europe Market Size and Forecast, By Application, 2018 - 2030 (US$ Million)
- 10.3.7. Germany
- 10.3.7.1. Overview
- 10.3.7.2. Market Analysis, Forecast, and Y-O-Y Growth Rate, 2018 - 2030, (US$ Million)
- 10.3.7.3. Germany Market Size and Forecast, By Component, 2018 - 2030 (US$ Million)
- 10.3.7.4. Germany Market Size and Forecast, By Circuit Structure, 2018 - 2030 (US$ Million)
- 10.3.7.5. Germany Market Size and Forecast, By Application, 2018 - 2030 (US$ Million)
- 10.3.8. Italy
- 10.3.8.1. Overview
- 10.3.8.2. Market Analysis, Forecast, and Y-O-Y Growth Rate, 2018 - 2030, (US$ Million)
- 10.3.8.3. Italy Market Size and Forecast, By Component, 2018 - 2030 (US$ Million)
- 10.3.8.4. Italy Market Size and Forecast, By Circuit Structure, 2018 - 2030 (US$ Million)
- 10.3.8.5. Italy Market Size and Forecast, By Application, 2018 - 2030 (US$ Million)
- 10.3.9. United Kingdom
- 10.3.9.1. Overview
- 10.3.9.2. Market Analysis, Forecast, and Y-O-Y Growth Rate, 2018 - 2030, (US$ Million)
- 10.3.9.3. United Kingdom Market Size and Forecast, By Component, 2018 - 2030 (US$ Million)
- 10.3.9.4. United Kingdom Market Size and Forecast, By Circuit Structure, 2018 - 2030 (US$ Million)
- 10.3.9.5. United Kingdom Market Size and Forecast, By Application, 2018 - 2030 (US$ Million)
- 10.3.10. France
- 10.3.10.1. Overview
- 10.3.10.2. Market Analysis, Forecast, and Y-O-Y Growth Rate, 2018 - 2030, (US$ Million)
- 10.3.10.3. France Market Size and Forecast, By Component, 2018 - 2030 (US$ Million)
- 10.3.10.4. France Market Size and Forecast, By Circuit Structure, 2018 - 2030 (US$ Million)
- 10.3.10.5. France Market Size and Forecast, By Application, 2018 - 2030 (US$ Million)
- 10.3.11. Russia
- 10.3.11.1. Market Analysis, Forecast, and Y-O-Y Growth Rate, 2018 - 2030, (US$ Million)
- 10.3.11.2. Russia Market Size and Forecast, By Component, 2018 - 2030 (US$ Million)
- 10.3.11.3. Russia Market Size and Forecast, By Circuit Structure, 2018 - 2030 (US$ Million)
- 10.3.11.4. Russia Market Size and Forecast, By Application, 2018 - 2030 (US$ Million)
- 10.3.12. Netherlands
- 10.3.12.1. Market Analysis, Forecast, and Y-O-Y Growth Rate, 2018 - 2030, (US$ Million)
- 10.3.12.2. Netherlands Market Size and Forecast, By Component, 2018 - 2030 (US$ Million)
- 10.3.12.3. Netherlands Market Size and Forecast, By Circuit Structure, 2018 - 2030 (US$ Million)
- 10.3.12.4. Netherlands Market Size and Forecast, By Application, 2018 - 2030 (US$ Million)
- 10.3.13. Sweden
- 10.3.13.1. Market Analysis, Forecast, and Y-O-Y Growth Rate, 2018 - 2030, (US$ Million)
- 10.3.13.2. Sweden Market Size and Forecast, By Component, 2018 - 2030 (US$ Million)
- 10.3.13.3. Sweden Market Size and Forecast, By Circuit Structure, 2018 - 2030 (US$ Million)
- 10.3.13.4. Sweden Market Size and Forecast, By Application, 2018 - 2030 (US$ Million)
- 10.3.14. Poland
- 10.3.14.1. Market Analysis, Forecast, and Y-O-Y Growth Rate, 2018 - 2030, (US$ Million)
- 10.3.14.2. Poland Market Size and Forecast, By Component, 2018 - 2030 (US$ Million)
- 10.3.14.3. Poland Market Size and Forecast, By Circuit Structure, 2018 - 2030 (US$ Million)
- 10.3.14.4. Poland Market Size and Forecast, By Application, 2018 - 2030 (US$ Million)
- 10.3.15. Rest of Europe
- 10.3.15.1. Overview
- 10.3.15.2. Market Analysis, Forecast, and Y-O-Y Growth Rate, 2018 - 2030, (US$ Million)
- 10.3.15.3. Rest of the Europe Market Size and Forecast, By Component, 2018 - 2030 (US$ Million)
- 10.3.15.4. Rest of the Europe Market Size and Forecast, By Circuit Structure, 2018 - 2030 (US$ Million)
- 10.3.15.5. Rest of the Europe Market Size and Forecast, By Application, 2018 - 2030 (US$ Million)
- 10.4. Asia Pacific (APAC)
- 10.4.1. Overview
- 10.4.2. Flexible Electronics Key Manufacturers in Asia Pacific
- 10.4.3. Asia Pacific Market Size and Forecast, By Country, 2018 - 2030 (US$ Million)
- 10.4.4. Asia Pacific Market Size and Forecast, By Component, 2018 - 2030 (US$ Million)
- 10.4.5. Asia Pacific Market Size and Forecast, By Circuit Structure, 2018 - 2030 (US$ Million)
- 10.4.6. Asia Pacific Market Size and Forecast, By Application, 2018 - 2030 (US$ Million)
- 10.4.7. India
- 10.4.7.1. Overview
- 10.4.7.2. Market Analysis, Forecast, and Y-O-Y Growth Rate, 2018 - 2030, (US$ Million)
- 10.4.7.3. India Market Size and Forecast, By Component, 2018 - 2030 (US$ Million)
- 10.4.7.4. India Market Size and Forecast, By Circuit Structure, 2018 - 2030 (US$ Million)
- 10.4.7.5. India Market Size and Forecast, By Application, 2018 - 2030 (US$ Million)
- 10.4.8. China
- 10.4.8.1. Overview
- 10.4.8.2. Market Analysis, Forecast, and Y-O-Y Growth Rate, 2018 - 2030, (US$ Million)
- 10.4.8.3. China Market Size and Forecast, By Component, 2018 - 2030 (US$ Million)
- 10.4.8.4. China Market Size and Forecast, By Circuit Structure, 2018 - 2030 (US$ Million)
- 10.4.8.5. China Market Size and Forecast, By Application, 2018 - 2030 (US$ Million)
- 10.4.9. Japan
- 10.4.9.1. Overview
- 10.4.9.2. Market Analysis, Forecast, and Y-O-Y Growth Rate, 2018 - 2030, (US$ Million)
- 10.4.9.3. Japan Market Size and Forecast, By Component, 2018 - 2030 (US$ Million)
- 10.4.9.4. Japan Market Size and Forecast, By Circuit Structure, 2018 - 2030 (US$ Million)
- 10.4.9.5. Japan Market Size and Forecast, By Application, 2018 - 2030 (US$ Million)
- 10.4.10. South Korea
- 10.4.10.1. Overview
- 10.4.10.2. Market Analysis, Forecast, and Y-O-Y Growth Rate, 2018 - 2030, (US$ Million)
- 10.4.10.3. South Korea Market Size and Forecast, By Component, 2018 - 2030 (US$ Million)
- 10.4.10.4. South Korea Market Size and Forecast, By Circuit Structure, 2018 - 2030 (US$ Million)
- 10.4.10.5. South Korea Market Size and Forecast, By Application, 2018 - 2030 (US$ Million)
- 10.4.11. Australia
- 10.4.11.1. Overview
- 10.4.11.2. Market Analysis, Forecast, and Y-O-Y Growth Rate, 2018 - 2030, (US$ Million)
- 10.4.11.3. Australia Market Size and Forecast, By Component, 2018 - 2030 (US$ Million)
- 10.4.11.4. Australia Market Size and Forecast, By Circuit Structure, 2018 - 2030 (US$ Million)
- 10.4.11.5. Australia Market Size and Forecast, By Application, 2018 - 2030 (US$ Million)
- 10.4.12. Thailand
- 10.4.12.1. Overview
- 10.4.12.2. Market Analysis, Forecast, and Y-O-Y Growth Rate, 2018 - 2030, (US$ Million)
- 10.4.12.3. Thailand Market Size and Forecast, By Component, 2018 - 2030 (US$ Million)
- 10.4.12.4. Thailand Market Size and Forecast, By Circuit Structure, 2018 - 2030 (US$ Million)
- 10.4.12.5. Thailand Market Size and Forecast, By Application, 2018 - 2030 (US$ Million)
- 10.4.13. Indonesia
- 10.4.13.1. Overview
- 10.4.13.2. Market Analysis, Forecast, and Y-O-Y Growth Rate, 2018 - 2030, (US$ Million)
- 10.4.13.3. Indonesia Market Size and Forecast, By Component, 2018 - 2030 (US$ Million)
- 10.4.13.4. Indonesia Market Size and Forecast, By Circuit Structure, 2018 - 2030 (US$ Million)
- 10.4.13.5. Indonesia Market Size and Forecast, By Application, 2018 - 2030 (US$ Million)
- 10.4.14. Philippines
- 10.4.14.1. Overview
- 10.4.14.2. Market Analysis, Forecast, and Y-O-Y Growth Rate, 2018 - 2030, (US$ Million)
- 10.4.14.3. Philippines Market Size and Forecast, By Component, 2018 - 2030 (US$ Million)
- 10.4.14.4. Philippines Market Size and Forecast, By Circuit Structure, 2018 - 2030 (US$ Million)
- 10.4.14.5. Philippines Market Size and Forecast, By Application, 2018 - 2030 (US$ Million)
- 10.4.15. Rest of APAC
- 10.4.15.1. Overview
- 10.4.15.2. Market Analysis, Forecast, and Y-O-Y Growth Rate, 2018 - 2030, (US$ Million)
- 10.4.15.3. Rest of APAC Market Size and Forecast, By Component, 2018 - 2030 (US$ Million)
- 10.4.15.4. Rest of APAC Market Size and Forecast, By Circuit Structure, 2018 - 2030 (US$ Million)
- 10.4.15.5. Rest of APAC Market Size and Forecast, By Application, 2018 - 2030 (US$ Million)
- 10.5. Latin America
- 10.5.1. Overview
- 10.5.2. Flexible Electronics Key Manufacturers in Latin America
- 10.5.3. Latin America Market Size and Forecast, By Country, 2018 - 2030 (US$ Million)
- 10.5.4. Latin America Market Size and Forecast, By Component, 2018 - 2030 (US$ Million)
- 10.5.5. Latin America Market Size and Forecast, By Circuit Structure, 2018 - 2030 (US$ Million)
- 10.5.6. Latin America Market Size and Forecast, By Application, 2018 - 2030 (US$ Million)
- 10.5.7. Brazil
- 10.5.7.1. Overview
- 10.5.7.2. Market Analysis, Forecast, and Y-O-Y Growth Rate, 2018 - 2030, (US$ Million)
- 10.5.7.3. Brazil Market Size and Forecast, By Component, 2018 - 2030 (US$ Million)
- 10.5.7.4. Brazil Market Size and Forecast, By Circuit Structure, 2018 - 2030 (US$ Million)
- 10.5.7.5. Brazil Market Size and Forecast, By Application, 2018 - 2030 (US$ Million)
- 10.5.8. Mexico
- 10.5.8.1. Overview
- 10.5.8.2. Market Analysis, Forecast, and Y-O-Y Growth Rate, 2018 - 2030, (US$ Million)
- 10.5.8.3. Mexico Market Size and Forecast, By Component, 2018 - 2030 (US$ Million)
- 10.5.8.4. Mexico Market Size and Forecast, By Circuit Structure, 2018 - 2030 (US$ Million)
- 10.5.8.5. Mexico Market Size and Forecast, By Application, 2018 - 2030 (US$ Million)
- 10.5.9. Argentina
- 10.5.9.1. Overview
- 10.5.9.2. Market Analysis, Forecast, and Y-O-Y Growth Rate, 2018 - 2030, (US$ Million)
- 10.5.9.3. Argentina Market Size and Forecast, By Component, 2018 - 2030 (US$ Million)
- 10.5.9.4. Argentina Market Size and Forecast, By Circuit Structure, 2018 - 2030 (US$ Million)
- 10.5.9.5. Argentina Market Size and Forecast, By Application, 2018 - 2030 (US$ Million)
- 10.5.10. Colombia
- 10.5.10.1. Overview
- 10.5.10.2. Market Analysis, Forecast, and Y-O-Y Growth Rate, 2018 - 2030, (US$ Million)
- 10.5.10.3. Colombia Market Size and Forecast, By Component, 2018 - 2030 (US$ Million)
- 10.5.10.4. Colombia Market Size and Forecast, By Circuit Structure, 2018 - 2030 (US$ Million)
- 10.5.10.5. Colombia Market Size and Forecast, By Application, 2018 - 2030 (US$ Million)
- 10.5.11. Rest of LATAM
- 10.5.11.1. Overview
- 10.5.11.2. Market Analysis, Forecast, and Y-O-Y Growth Rate, 2018 - 2030, (US$ Million)
- 10.5.11.3. Rest of LATAM Market Size and Forecast, By Component, 2018 - 2030 (US$ Million)
- 10.5.11.4. Rest of LATAM Market Size and Forecast, By Circuit Structure, 2018 - 2030 (US$ Million)
- 10.5.11.5. Rest of LATAM Market Size and Forecast, By Application, 2018 - 2030 (US$ Million)
- 10.6. Middle East and Africa
- 10.6.1. Overview
- 10.6.2. Flexible Electronics Key Manufacturers in Middle East and Africa
- 10.6.3. Middle East and Africa Market Size and Forecast, By Country, 2018 - 2030 (US$ Million)
- 10.6.4. Middle East and Africa Market Size and Forecast, By Component, 2018 - 2030 (US$ Million)
- 10.6.5. Middle East and Africa Market Size and Forecast, By Circuit Structure, 2018 - 2030 (US$ Million)
- 10.6.6. Middle East and Africa Market Size and Forecast, By Application, 2018 - 2030 (US$ Million)
- 10.6.7. Saudi Arabia
- 10.6.7.1. Overview
- 10.6.7.2. Market Analysis, Forecast, and Y-O-Y Growth Rate, 2018 - 2030, (US$ Million)
- 10.6.7.3. Saudi Arabia Market Size and Forecast, By Component, 2018 - 2030 (US$ Million)
- 10.6.7.4. Saudi Arabia Market Size and Forecast, By Circuit Structure, 2018 - 2030 (US$ Million)
- 10.6.7.5. Saudi Arabia Market Size and Forecast, By Application, 2018 - 2030 (US$ Million)
- 10.6.8. United Arab Emirates
- 10.6.8.1. Overview
- 10.6.8.2. Market Analysis, Forecast, and Y-O-Y Growth Rate, 2018 - 2030, (US$ Million)
- 10.6.8.3. United Arab Emirates Market Size and Forecast, By Component, 2018 - 2030 (US$ Million)
- 10.6.8.4. United Arab Emirates Market Size and Forecast, By Circuit Structure, 2018 - 2030 (US$ Million)
- 10.6.8.5. United Arab Emirates Market Size and Forecast, By Application, 2018 - 2030 (US$ Million)
- 10.6.9. Israel
- 10.6.9.1. Overview
- 10.6.9.2. Market Analysis, Forecast, and Y-O-Y Growth Rate, 2018 - 2030, (US$ Million)
- 10.6.9.3. Israel Market Size and Forecast, By Component, 2018 - 2030 (US$ Million)
- 10.6.9.4. Israel Market Size and Forecast, By Circuit Structure, 2018 - 2030 (US$ Million)
- 10.6.9.5. Israel Market Size and Forecast, By Application, 2018 - 2030 (US$ Million)
- 10.6.10. Turkey
- 10.6.10.1. Overview
- 10.6.10.2. Market Analysis, Forecast, and Y-O-Y Growth Rate, 2018 - 2030, (US$ Million)
- 10.6.10.3. Turkey Market Size and Forecast, By Component, 2018 - 2030 (US$ Million)
- 10.6.10.4. Turkey Market Size and Forecast, By Circuit Structure, 2018 - 2030 (US$ Million)
- 10.6.10.5. Turkey Market Size and Forecast, By Application, 2018 - 2030 (US$ Million)
- 10.6.11. Algeria
- 10.6.11.1. Overview
- 10.6.11.2. Market Analysis, Forecast, and Y-O-Y Growth Rate, 2018 - 2030, (US$ Million)
- 10.6.11.3. Algeria Market Size and Forecast, By Component, 2018 - 2030 (US$ Million)
- 10.6.11.4. Algeria Market Size and Forecast, By Circuit Structure, 2018 - 2030 (US$ Million)
- 10.6.11.5. Algeria Market Size and Forecast, By Application, 2018 - 2030 (US$ Million)
- 10.6.12. Egypt
- 10.6.12.1. Overview
- 10.6.12.2. Market Analysis, Forecast, and Y-O-Y Growth Rate, 2018 - 2030, (US$ Million)
- 10.6.12.3. Egypt Market Size and Forecast, By Component, 2018 - 2030 (US$ Million)
- 10.6.12.4. Egypt Market Size and Forecast, By Circuit Structure, 2018 - 2030 (US$ Million)
- 10.6.12.5. Egypt Market Size and Forecast, By Application, 2018 - 2030 (US$ Million)
- 10.6.13. Rest of MEA
- 10.6.13.1. Overview
- 10.6.13.2. Market Analysis, Forecast, and Y-O-Y Growth Rate, 2018 - 2030, (US$ Million)
- 10.6.13.3. Rest of MEA Market Size and Forecast, By Component, 2018 - 2030 (US$ Million)
- 10.6.13.4. Rest of MEA Market Size and Forecast, By Circuit Structure, 2018 - 2030 (US$ Million)
- 10.6.13.5. Rest of MEA Market Size and Forecast, By Application, 2018 - 2030 (US$ Million)
11. Key Vendor Analysis- Flexible Electronics Industry
- 11.1. Competitive Dashboard
- 11.2. Company Profiles
- 11.2.1. SAMSUNG
- 11.2.2. ITN Energy Systems Inc.
- 11.2.3. 3M
- 11.2.4. MFLEX
- 11.2.5. First Solar
- 11.2.6. Au Optronics Corp.
- 11.2.7. E INK HOLDINGS INC
- 11.2.8. Enfucell Softbattery
- 11.2.9. General Electric
- 11.2.10. SOLAR FRONTIER K.K.
- 11.2.11. LG Electronics
- 11.2.12. Blue Spark Technologies
- 11.2.13. Palo Alto Research Center LLC
- 11.2.14. SOLAR FRONTIER K.K.
12. 360 Degree Analyst View
13. Appendix
- 13.1. Research Methodology
- 13.2. References
- 13.3. Abbreviations
- 13.4. Disclaimer
- 13.5. Contact Us