|
|
市場調査レポート
商品コード
1373931
コンドロイチン硫酸市場:供給源別、用途別、国別、地域別- 産業分析、市場規模、市場シェア、2023-2030年予測Chondroitin Sulfate Market, by Source, Application, By Country, and By Region - Industry Analysis, Market Size, Market Share & Forecast from 2023-2030 |
||||||
|
|
|||||||
カスタマイズ可能
|
|||||||


| コンドロイチン硫酸市場:供給源別、用途別、国別、地域別- 産業分析、市場規模、市場シェア、2023-2030年予測 |
|
出版日: 2023年10月01日
発行: AnalystView Market Insights
ページ情報: 英文 317 Pages
納期: 2~3営業日
|

- 全表示
- 概要
- 図表
- 目次
レポートハイライト
コンドロイチン硫酸の市場規模は2022年に12億5,042万米ドルとなり、2023年から2030年にかけてCAGR 3.49%で拡大しました。
コンドロイチン硫酸の作用機序は、軟骨の保水能力と必須栄養素の保持を促進し、軟骨組織のクッション性と衝撃吸収性をサポートすることであると考えられています。これは、関節機能の維持が重要な変形性関節症のような症状において特に価値があります。
コンドロイチン硫酸市場力学
変形性関節症患者の増加が市場成長を促進
コンドロイチン硫酸市場は、コンドロイチン硫酸による治療が必要となることが多い変形性関節症の有病率の増加と、様々な産業におけるコンドロイチン硫酸の利用拡大が主な要因となって、予測期間中に大きな成長を遂げるものと期待されています。
コンドロイチン硫酸で管理されることの多い骨粗鬆症は、この成長に大きく寄与しています。2022年1月にJournal of Climacteric誌に発表された論文によると、骨粗鬆症の結果、3秒に1回の割合で骨粗鬆症性骨折が発生するという驚異的な統計があり、世界中で毎年890万人以上の骨折が記録されています。報告書はさらに、世界で2億人の女性が骨粗鬆症の影響を受けていることを強調しています。骨粗鬆症に罹患している人口が多いことから、市場の拡大が期待されています。さらに、コンドロイチン硫酸塩は、白内障手術や移植用角膜の保存液、ドライアイに対処する点眼薬としての用途があり、さまざまな医療領域での利用がさらに広がっています。
コンドロイチン硫酸市場-主要インサイト
当社の調査アナリストの調査結果によると、コンドロイチン硫酸の世界市場は、2023年から2030年までの予測期間を通じて、年間成長率約3.49%を記録する見込みです。
コンドロイチン硫酸市場は、主に変形性関節症の有病率の増加に起因する大幅な成長を示すと予想されます。
供給源のセグメンテーションでは、2022年はウシが優勢でした。
用途別では、医薬品が2022年の用途別でトップの座を占めました。
地域別では、北米が2022年の主な収益源として浮上しました。
コンドロイチン硫酸市場-セグメンテーション分析:
世界のコンドロイチン硫酸市場は、供給源、用途、地域を含む主要なパラメータに基づいて構成されています。
供給源のカテゴリーでは、市場は明確なセグメントに細分化されます:サメ、豚、合成、牛、その他。特筆すべきは、牛由来ソース部門が世界の業界を支配していることです。この優位性は、牛由来のコンドロイチン硫酸が、パーソナルケア&化粧品、医薬品、栄養補助食品を含む多様な応用分野で世界的に広く利用されていることに起因しています。一方、サメ由来のコンドロイチン硫酸は、栄養補助食品、医薬品、動物飼料業界の限られた企業によって使用されています。サメは現在絶滅危惧種と見なされており、業界の成長に潜在的な障害をもたらしていることは注目に値します。
コンドロイチン硫酸市場-地理的洞察
地理的な観点から、この市場には北米、ラテンアメリカ、欧州、アジア太平洋、中東・アフリカなどの地域が含まれます。北米地域は大きな成長が見込まれています。同地域のコンドロイチン硫酸市場の隆盛は、同地域の製薬部門がよく確立されていることと、米国食品医薬品局(FDA)により承認されたコンドロイチン硫酸製品の数が増加していることに起因しています。このような規制上の承認は、北米での市場拡大を推進する上で極めて重要な役割を果たしています。
コンドロイチン硫酸市場-競合情勢:
企業は、企業ウェブサイト、eコマース・プラットフォーム、小売店、流通パートナー、最終消費者など、多数のチャネルを通じて製品を販売しています。製品メーカーは、製品価格、性能、製造工程、技術、ブランド評価、製品の入手可能性など、さまざまな次元で競合を繰り広げています。市場での存在感を高め、市場シェアを拡大するために、企業は新製品の導入、流通網の拡大、研究開発への投資拡大、M&Aへの参加など、主要な戦略を活用することが多いです。
目次
第1章 コンドロイチン硫酸市場概要
- 調査範囲
- 市場推定年数
第2章 エグゼクティブサマリー
- 市場内訳
- 競合考察
第3章 半導体メモリの主要市場動向
- コンドロイチン硫酸市場促進要因
- コンドロイチン硫酸市場抑制要因
- コンドロイチン硫酸市場の機会
- コンドロイチン硫酸市場の今後の動向
第4章 半導体メモリ産業の調査
- PEST分析
- ポーターのファイブフォース分析
- 成長見通しのマッピング
- 規制枠組みの分析
第5章 コンドロイチン硫酸市場:COVID-19感染症の影響分析
- 新型コロナウイルス感染症以前の影響分析
- 新型コロナウイルス感染症後の影響分析
第6章 コンドロイチン硫酸市場情勢
- コンドロイチン硫酸市場シェア分析、2022年
- 主要メーカー別の内訳データ
- 既存企業の分析
- 新興企業の分析
第7章 コンドロイチン硫酸市場- ソース別
- 概要
- ソース別セグメントシェア分析
- サメ
- 豚
- 合成
- ウシ
- その他
第8章 コンドロイチン硫酸市場- アプリケーション別
- 概要
- アプリケーション別のセグメントシェア分析
- 化粧品
- 医薬品
- 獣医
第9章 コンドロイチン硫酸市場-地域別
- イントロダクション
- 北米
- 概要
- 北米の主要メーカー
- 米国
- カナダ
- 欧州
- 概要
- 欧州の主要メーカー
- ドイツ
- イタリア
- 英国
- フランス
- ロシア
- オランダ
- スウェーデン
- ポーランド
- その他
- アジア太平洋(APAC)
- 概要
- アジア太平洋地域の主要メーカー
- インド
- 中国
- 日本
- 韓国
- オーストラリア
- タイ
- インドネシア
- フィリピン
- その他
- ラテンアメリカ
- 概要
- ラテンアメリカの主要メーカー
- ブラジル
- メキシコ
- アルゼンチン
- コロンビア
- その他
- 中東とアフリカ
- 概要
- 中東およびアフリカの主要メーカー
- サウジアラビア
- アラブ首長国連邦
- イスラエル
- トルコ
- アルジェリア
- エジプト
- その他
第10章 主要ベンダー分析- 半導体メモリ業界
- 競合ダッシュボード
- 企業プロファイル
- TSI Group Ltd.
- Synutra Ingredients
- Summit Nutritionals International, Inc.
- Sino Lion(USA)Inc.
- Sigma-Aldrich(now part of MilliporeSigma)
- Shandong Runxin Biotechnology Co., Ltd.
- Qingdao WanTuMing Biological Products Co., Ltd.
- Marlyn Nutraceuticals, Inc.
- Jiaxing Hengjie Biopharmaceutical Co., Ltd.
- Hebei Smart Chemicals Co., Ltd.
- Hangzhou Kalong Trade Co., Ltd.
- Hangzhou Focus Corporation
- Changzhou ComWin Fine Chemicals Co., Ltd.
- Bioiberica
- Baoji Tendenci Chemical Co., Ltd.
第11章 アナリストの全方位展望
List of Tables
- TABLE List of data sources
- TABLE Market drivers; Impact Analysis
- TABLE Market restraints; Impact Analysis
- TABLE Chondroitin Sulfate Market: Source Snapshot (2022)
- TABLE Segment Dashboard; Definition and Scope, by Source
- TABLE Global Chondroitin Sulfate Market, by Source 2018-2030 (USD Million)
- TABLE Chondroitin Sulfate Market: Application Snapshot (2022)
- TABLE Segment Dashboard; Definition and Scope, by Application
- TABLE Global Chondroitin Sulfate Market, by Application 2018-2030 (USD Million)
- TABLE Chondroitin Sulfate Market: Regional snapshot (2022)
- TABLE Segment Dashboard; Definition and Scope, by Region
- TABLE Global Chondroitin Sulfate Market, by Region 2018-2030 (USD Million)
- TABLE North America Chondroitin Sulfate Market, by Country, 2018-2030 (USD Million)
- TABLE North America Chondroitin Sulfate Market, by Source, 2018-2030 (USD Million)
- TABLE North America Chondroitin Sulfate Market, by Application, 2018-2030 (USD Million)
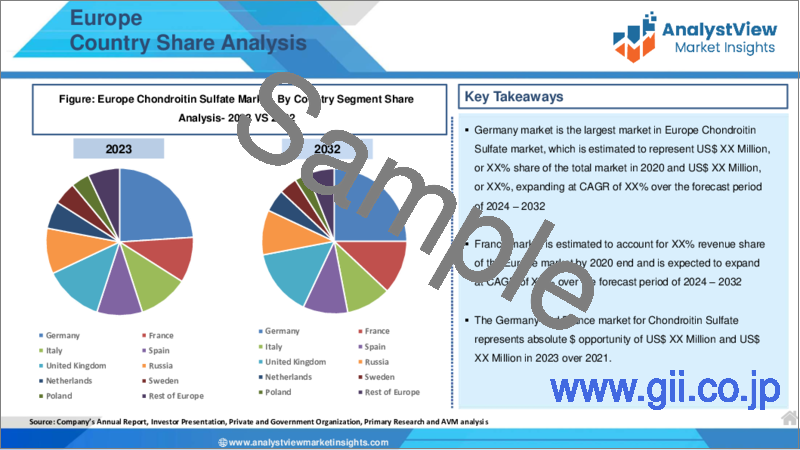
- TABLE Europe Chondroitin Sulfate Market, by Country, 2018-2030 (USD Million)
- TABLE Europe Chondroitin Sulfate Market, by Source, 2018-2030 (USD Million)
- TABLE Europe Chondroitin Sulfate Market, by Application, 2018-2030 (USD Million)
- TABLE Asia Pacific Chondroitin Sulfate Market, by Country, 2018-2030 (USD Million)
- TABLE Asia Pacific Chondroitin Sulfate Market, by Source, 2018-2030 (USD Million)
- TABLE Asia Pacific Chondroitin Sulfate Market, by Application, 2018-2030 (USD Million)
- TABLE Latin America Chondroitin Sulfate Market, by Country, 2018-2030 (USD Million)
- TABLE Latin America Chondroitin Sulfate Market, by Source, 2018-2030 (USD Million)
- TABLE Latin America Chondroitin Sulfate Market, by Application, 2018-2030 (USD Million)
- TABLE Middle East and Africa Chondroitin Sulfate Market, by Country, 2018-2030 (USD Million)
- TABLE Middle East and Africa Chondroitin Sulfate Market, by Source, 2018-2030 (USD Million)
- TABLE Middle East and Africa Chondroitin Sulfate Market, by Application, 2018-2030 (USD Million)
REPORT HIGHLIGHT
Chondroitin Sulfate market size was valued at USD 1,250.42 Million in 2022, expanding at a CAGR of 3.49% from 2023 to 2030.
Chondroitin sulfate, an organic compound, is naturally found in the cartilage and various connective tissues of animals. It plays a crucial role in the extracellular matrix, which provides stability, structure, and flexibility to tissues such as blood vessels, joints, and skin. Chondroitin sulfate is commonly utilized as a dietary supplement for joint health due to its potential to reduce inflammation, alleviate discomfort, and enhance joint mobility.
Its mechanism of action is believed to involve promoting the cartilage's ability to retain water and essential nutrients, which, in turn, supports the cushioning and shock-absorbing properties of the tissue. This is particularly valuable in conditions like osteoarthritis, where maintaining joint function is vital.
Chondroitin Sulfate Market Dynamics
The rising occurrence of osteoarthritis cases propelled the market growth
The chondroitin sulfate market is expected to witness significant growth in the forecast period, primarily driven by the increasing prevalence of osteoarthritis cases, which often necessitate chondroitin sulfate treatment, and the expanding utilization of chondroitin sulfate across various industries.
Osteoporosis, which is frequently managed with chondroitin sulfate, presents a significant contributor to this growth. According to a January 2022 article published in the Journal of Climacteric, osteoporosis results in a staggering statistic of one osteoporotic fracture occurring every three seconds, with over 8.9 million fractures recorded worldwide each year. The report further highlights that 200 million women globally are affected by osteoporosis. Given the extensive population impacted by this condition, it is anticipated to drive market expansion. Moreover, chondroitin sulfate finds applications in cataract surgery, serving as a solution to preserve corneas used for transplants and as an eye drop for addressing dry eye conditions, further broadening its usage in various medical domains.
Chondroitin Sulfate Market- Key Insights
According to our research analyst's findings, the Global Chondroitin Sulfate market is poised to experience an annual growth rate of approximately 3.49% throughout the forecast period, spanning from 2023 to 2030.
The Chondroitin Sulfate market is expected to exhibit substantial growth, primarily attributed to the increasing prevalence of osteoarthritis cases.
In terms of Source segmentation, the year 2022 saw bovine as the predominant source category.
Regarding Application segmentation, Pharmaceuticals held the top position among applications in 2022.
Geographically, North America emerged as the primary revenue generator in the year 2022.
Chondroitin Sulfate Market- Segmentation Analysis:
The Global Chondroitin Sulfate market is structured based on key parameters including Source, Application, and Region.
Within the Source category, the market is subdivided into distinct segments: Shark, Swine, Synthetic, Bovine, and Others. Notably, the bovine source sector dominated the global industry. This dominance is attributed to the widespread utilization of bovine-derived chondroitin sulfate across a diverse range of application sectors, including personal care & cosmetics, pharmaceuticals, and nutraceuticals, on a global scale. Shark-derived chondroitin sulfate, on the other hand, is employed by a limited number of companies in the nutraceutical, pharmaceutical, and animal feed industries. It's noteworthy that sharks are currently considered an endangered species, which poses potential obstacles to the industry's growth.
Chondroitin Sulfate Market- Geographical Insights
From a geographical perspective, this market encompasses regions including North America, Latin America, Europe, Asia Pacific, and the Middle East and Africa. The North America region is anticipated to experience significant growth. The region's thriving chondroitin sulfate market can be attributed to its well-established pharmaceutical sector and the increasing number of chondroitin sulfate products approved by the United States Food and Drug Administration (FDA). This regulatory approval plays a pivotal role in driving market expansion in North America.
Chondroitin Sulfate Market- Competitive Landscape:
Companies distribute their products through a multitude of channels, encompassing corporate websites, e-commerce platforms, retail outlets, distribution partners, and end consumers. Manufacturers of products engage in competition across a spectrum of dimensions, such as product pricing, performance, manufacturing processes, technology, brand reputation, and product availability. To bolster their market presence and extend their market share, businesses often leverage key strategies including the introduction of new products, expansion of distribution networks, increased investment in research and development, and participation in mergers and acquisitions.
SCOPE OF THE REPORT
The scope of this report covers the market by its major segments, which include as follows:
GLOBAL CHONDROITIN SULFATE MARKET KEY PLAYERS
- TSI Group Ltd.
- Synutra Ingredients
- Summit Nutritionals International, Inc.
- Sino Lion (USA) Inc.
- Sigma-Aldrich (now part of MilliporeSigma)
- Shandong Runxin Biotechnology Co., Ltd.
- Qingdao WanTuMing Biological Products Co., Ltd.
- Marlyn Nutraceuticals, Inc.
- Jiaxing Hengjie Biopharmaceutical Co., Ltd.
- Hebei Smart Chemicals Co., Ltd.
- Hangzhou Kalong Trade Co., Ltd.
- Hangzhou Focus Corporation
- Changzhou ComWin Fine Chemicals Co., Ltd.
- Bioiberica
- Baoji Tendenci Chemical Co., Ltd.
GLOBAL CHONDROITIN SULFATE MARKET, BY SOURCE
- Shark
- Swine
- Synthetic
- Bovine
- Others
GLOBAL CHONDROITIN SULFATE MARKET, BY APPLICATION
- Cosmetics
- Pharmaceuticals
- Veterinary
GLOBAL CHONDROITIN SULFATE MARKET, BY REGION
- North America
- The U.S.
- Canada
- Europe
- Germany
- France
- Italy
- Spain
- United Kingdom
- Russia
- Netherlands
- Sweden
- Poland
- Rest of Europe
- Asia Pacific
- India
- China
- South Korea
- Japan
- Australia
- Thailand
- Indonesia
- Philippines
- Rest of APAC
- Latin America
- Brazil
- Mexico
- Argentina
- Colombia
- Rest of LATAM
- The Middle East and Africa
- Saudi Arabia
- United Arab Emirates
- Israel
- Turkey
- Algeria
- Egypt
- Rest of MEA
Table of Contents
1. Chondroitin Sulfate Market Overview
- 1.1. Study Scope
- 1.2. Market Estimation Years
2. Executive Summary
- 2.1. Market Snippet
- 2.1.1. Chondroitin Sulfate Market Snippet by Source
- 2.1.2. Chondroitin Sulfate Market Snippet by Application
- 2.1.3. Chondroitin Sulfate Market Snippet by Country
- 2.1.4. Chondroitin Sulfate Market Snippet by Region
- 2.2. Competitive Insights
3. Semiconductor Memory Key Market Trends
- 3.1. Chondroitin Sulfate Market Drivers
- 3.1.1. Impact Analysis of Market Drivers
- 3.2. Chondroitin Sulfate Market Restraints
- 3.2.1. Impact Analysis of Market Restraints
- 3.3. Chondroitin Sulfate Market Opportunities
- 3.4. Chondroitin Sulfate Market Future Trends
4. Semiconductor Memory Industry Study
- 4.1. PEST Analysis
- 4.2. Porter's Five Forces Analysis
- 4.3. Growth Prospect Mapping
- 4.4. Regulatory Framework Analysis
5. Chondroitin Sulfate Market: COVID-19 Impact Analysis
- 5.1. Pre-COVID-19 Impact Analysis
- 5.2. Post-COVID-19 Impact Analysis
- 5.2.1. Top Performing Segments
- 5.2.2. Marginal Growth Segments
- 5.2.3. Top Looser Segments
- 5.2.4. Marginal Loss Segments
6. Chondroitin Sulfate Market Landscape
- 6.1. Chondroitin Sulfate Market Share Analysis, 2022
- 6.2. Breakdown Data, by Key Manufacturer
- 6.2.1. Established Players' Analysis
- 6.2.2. Emerging Players' Analysis
7. Chondroitin Sulfate Market - By Source
- 7.1. Overview
- 7.1.1. Segment Share Analysis, By Source, 2022 & 2030 (%)
- 7.1.2. Shark
- 7.1.3. Swine
- 7.1.4. Synthetic
- 7.1.5. Bovine
- 7.1.6. Others
8. Chondroitin Sulfate Market - By Application
- 8.1. Overview
- 8.1.1. Segment Share Analysis, By Application, 2022 & 2030 (%)
- 8.1.2. Cosmetics
- 8.1.3. Pharmaceuticals
- 8.1.4. Veterinary
9. Chondroitin Sulfate Market- By Geography
- 9.1. Introduction
- 9.1.1. Segment Share Analysis, By Geography, 2022 & 2030 (%)
- 9.2. North America
- 9.2.1. Overview
- 9.2.2. Semiconductor Memory Key Manufacturers in North America
- 9.2.3. North America Market Size and Forecast, By Country, 2018 - 2030 (US$ Million)
- 9.2.4. North America Market Size and Forecast, By Source, 2018 - 2030 (US$ Million)
- 9.2.5. North America Market Size and Forecast, By Application, 2018 - 2030 (US$ Million)
- 9.2.6. U.S.
- 9.2.6.1. Overview
- 9.2.6.2. Market Analysis, Forecast, and Y-O-Y Growth Rate, 2018 - 2030, (US$ Million)
- 9.2.6.3. U.S. Market Size and Forecast, By Source, 2018 - 2030 (US$ Million)
- 9.2.6.4. U.S. Market Size and Forecast, By Application, 2018 - 2030 (US$ Million)
- 9.2.7. Canada
- 9.2.7.1. Overview
- 9.2.7.2. Market Analysis, Forecast, and Y-O-Y Growth Rate, 2018 - 2030, (US$ Million)
- 9.2.7.3. Canada Market Size and Forecast, By Source, 2018 - 2030 (US$ Million)
- 9.2.7.4. Canada Market Size and Forecast, By Application, 2018 - 2030 (US$ Million)
- 9.3. Europe
- 9.3.1. Overview
- 9.3.2. Semiconductor Memory Key Manufacturers in Europe
- 9.3.3. Europe Market Size and Forecast, By Country, 2018 - 2030 (US$ Million)
- 9.3.4. Europe Market Size and Forecast, By Source, 2018 - 2030 (US$ Million)
- 9.3.5. Europe Market Size and Forecast, By Application, 2018 - 2030 (US$ Million)
- 9.3.6. Germany
- 9.3.6.1. Overview
- 9.3.6.2. Market Analysis, Forecast, and Y-O-Y Growth Rate, 2018 - 2030, (US$ Million)
- 9.3.6.3. Germany Market Size and Forecast, By Source, 2018 - 2030 (US$ Million)
- 9.3.6.4. Germany Market Size and Forecast, By Application, 2018 - 2030 (US$ Million)
- 9.3.7. Italy
- 9.3.7.1. Overview
- 9.3.7.2. Market Analysis, Forecast, and Y-O-Y Growth Rate, 2018 - 2030, (US$ Million)
- 9.3.7.3. Italy Market Size and Forecast, By Source, 2018 - 2030 (US$ Million)
- 9.3.7.4. Italy Market Size and Forecast, By Application, 2018 - 2030 (US$ Million)
- 9.3.8. United Kingdom
- 9.3.8.1. Overview
- 9.3.8.2. Market Analysis, Forecast, and Y-O-Y Growth Rate, 2018 - 2030, (US$ Million)
- 9.3.8.3. United Kingdom Market Size and Forecast, By Source, 2018 - 2030 (US$ Million)
- 9.3.8.4. United Kingdom Market Size and Forecast, By Application, 2018 - 2030 (US$ Million)
- 9.3.9. France
- 9.3.9.1. Overview
- 9.3.9.2. Market Analysis, Forecast, and Y-O-Y Growth Rate, 2018 - 2030, (US$ Million)
- 9.3.9.3. France Market Size and Forecast, By Source, 2018 - 2030 (US$ Million)
- 9.3.9.4. France Market Size and Forecast, By Application, 2018 - 2030 (US$ Million)
- 9.3.10. Russia
- 9.3.10.1. Market Analysis, Forecast, and Y-O-Y Growth Rate, 2018 - 2030, (US$ Million)
- 9.3.10.2. Russia Market Size and Forecast, By Source, 2018 - 2030 (US$ Million)
- 9.3.10.3. Russia Market Size and Forecast, By Application, 2018 - 2030 (US$ Million)
- 9.3.11. Netherlands
- 9.3.11.1. Market Analysis, Forecast, and Y-O-Y Growth Rate, 2018 - 2030, (US$ Million)
- 9.3.11.2. Netherlands Market Size and Forecast, By Source, 2018 - 2030 (US$ Million)
- 9.3.11.3. Netherlands Market Size and Forecast, By Application, 2018 - 2030 (US$ Million)
- 9.3.12. Sweden
- 9.3.12.1. Market Analysis, Forecast, and Y-O-Y Growth Rate, 2018 - 2030, (US$ Million)
- 9.3.12.2. Sweden Market Size and Forecast, By Source, 2018 - 2030 (US$ Million)
- 9.3.12.3. Sweden Market Size and Forecast, By Application, 2018 - 2030 (US$ Million)
- 9.3.13. Poland
- 9.3.13.1. Market Analysis, Forecast, and Y-O-Y Growth Rate, 2018 - 2030, (US$ Million)
- 9.3.13.2. Poland Market Size and Forecast, By Source, 2018 - 2030 (US$ Million)
- 9.3.13.3. Poland Market Size and Forecast, By Application, 2018 - 2030 (US$ Million)
- 9.3.14. Rest of Europe
- 9.3.14.1. Overview
- 9.3.14.2. Market Analysis, Forecast, and Y-O-Y Growth Rate, 2018 - 2030, (US$ Million)
- 9.3.14.3. Rest of the Europe Market Size and Forecast, By Source, 2018 - 2030 (US$ Million)
- 9.3.14.4. Rest of the Europe Market Size and Forecast, By Application, 2018 - 2030 (US$ Million)
- 9.4. Asia Pacific (APAC)
- 9.4.1. Overview
- 9.4.2. Semiconductor Memory Key Manufacturers in Asia Pacific
- 9.4.3. Asia Pacific Market Size and Forecast, By Country, 2018 - 2030 (US$ Million)
- 9.4.4. Asia Pacific Market Size and Forecast, By Source, 2018 - 2030 (US$ Million)
- 9.4.5. Asia Pacific Market Size and Forecast, By Application, 2018 - 2030 (US$ Million)
- 9.4.6. India
- 9.4.6.1. Overview
- 9.4.6.2. Market Analysis, Forecast, and Y-O-Y Growth Rate, 2018 - 2030, (US$ Million)
- 9.4.6.3. India Market Size and Forecast, By Source, 2018 - 2030 (US$ Million)
- 9.4.6.4. India Market Size and Forecast, By Application, 2018 - 2030 (US$ Million)
- 9.4.7. China
- 9.4.7.1. Overview
- 9.4.7.2. Market Analysis, Forecast, and Y-O-Y Growth Rate, 2018 - 2030, (US$ Million)
- 9.4.7.3. China Market Size and Forecast, By Source, 2018 - 2030 (US$ Million)
- 9.4.7.4. China Market Size and Forecast, By Application, 2018 - 2030 (US$ Million)
- 9.4.8. Japan
- 9.4.8.1. Overview
- 9.4.8.2. Market Analysis, Forecast, and Y-O-Y Growth Rate, 2018 - 2030, (US$ Million)
- 9.4.8.3. Japan Market Size and Forecast, By Source, 2018 - 2030 (US$ Million)
- 9.4.8.4. Japan Market Size and Forecast, By Application, 2018 - 2030 (US$ Million)
- 9.4.9. South Korea
- 9.4.9.1. Overview
- 9.4.9.2. Market Analysis, Forecast, and Y-O-Y Growth Rate, 2018 - 2030, (US$ Million)
- 9.4.9.3. South Korea Market Size and Forecast, By Source, 2018 - 2030 (US$ Million)
- 9.4.9.4. South Korea Market Size and Forecast, By Application, 2018 - 2030 (US$ Million)
- 9.4.10. Australia
- 9.4.10.1. Overview
- 9.4.10.2. Market Analysis, Forecast, and Y-O-Y Growth Rate, 2018 - 2030, (US$ Million)
- 9.4.10.3. Australia Market Size and Forecast, By Source, 2018 - 2030 (US$ Million)
- 9.4.10.4. Australia Market Size and Forecast, By Application, 2018 - 2030 (US$ Million)
- 9.4.11. Thailand
- 9.4.11.1. Overview
- 9.4.11.2. Market Analysis, Forecast, and Y-O-Y Growth Rate, 2018 - 2030, (US$ Million)
- 9.4.11.3. Thailand Market Size and Forecast, By Source, 2018 - 2030 (US$ Million)
- 9.4.11.4. Thailand Market Size and Forecast, By Application, 2018 - 2030 (US$ Million)
- 9.4.12. Indonesia
- 9.4.12.1. Overview
- 9.4.12.2. Market Analysis, Forecast, and Y-O-Y Growth Rate, 2018 - 2030, (US$ Million)
- 9.4.12.3. Indonesia Market Size and Forecast, By Source, 2018 - 2030 (US$ Million)
- 9.4.12.4. Indonesia Market Size and Forecast, By Application, 2018 - 2030 (US$ Million)
- 9.4.13. Philippines
- 9.4.13.1. Overview
- 9.4.13.2. Market Analysis, Forecast, and Y-O-Y Growth Rate, 2018 - 2030, (US$ Million)
- 9.4.13.3. Philippines Market Size and Forecast, By Source, 2018 - 2030 (US$ Million)
- 9.4.13.4. Philippines Market Size and Forecast, By Application, 2018 - 2030 (US$ Million)
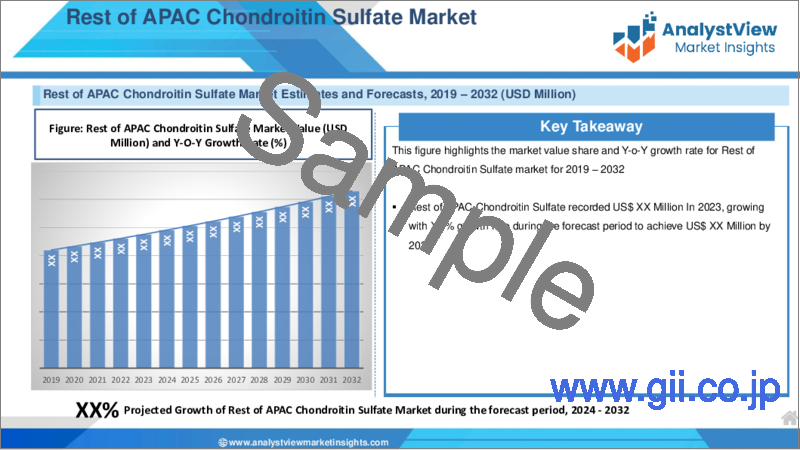
- 9.4.14. Rest of APAC
- 9.4.14.1. Overview
- 9.4.14.2. Market Analysis, Forecast, and Y-O-Y Growth Rate, 2018 - 2030, (US$ Million)
- 9.4.14.3. Rest of APAC Market Size and Forecast, By Source, 2018 - 2030 (US$ Million)
- 9.4.14.4. Rest of APAC Market Size and Forecast, By Application, 2018 - 2030 (US$ Million)
- 9.5. Latin America
- 9.5.1. Overview
- 9.5.2. Semiconductor Memory Key Manufacturers in Latin America
- 9.5.3. Latin America Market Size and Forecast, By Country, 2018 - 2030 (US$ Million)
- 9.5.4. Latin America Market Size and Forecast, By Source, 2018 - 2030 (US$ Million)
- 9.5.5. Latin America Market Size and Forecast, By Application, 2018 - 2030 (US$ Million)
- 9.5.6. Brazil
- 9.5.6.1. Overview
- 9.5.6.2. Market Analysis, Forecast, and Y-O-Y Growth Rate, 2018 - 2030, (US$ Million)
- 9.5.6.3. Brazil Market Size and Forecast, By Source, 2018 - 2030 (US$ Million)
- 9.5.6.4. Brazil Market Size and Forecast, By Application, 2018 - 2030 (US$ Million)
- 9.5.7. Mexico
- 9.5.7.1. Overview
- 9.5.7.2. Market Analysis, Forecast, and Y-O-Y Growth Rate, 2018 - 2030, (US$ Million)
- 9.5.7.3. Mexico Market Size and Forecast, By Source, 2018 - 2030 (US$ Million)
- 9.5.7.4. Mexico Market Size and Forecast, By Application, 2018 - 2030 (US$ Million)
- 9.5.8. Argentina
- 9.5.8.1. Overview
- 9.5.8.2. Market Analysis, Forecast, and Y-O-Y Growth Rate, 2018 - 2030, (US$ Million)
- 9.5.8.3. Argentina Market Size and Forecast, By Source, 2018 - 2030 (US$ Million)
- 9.5.8.4. Argentina Market Size and Forecast, By Application, 2018 - 2030 (US$ Million)
- 9.5.9. Colombia
- 9.5.9.1. Overview
- 9.5.9.2. Market Analysis, Forecast, and Y-O-Y Growth Rate, 2018 - 2030, (US$ Million)
- 9.5.9.3. Colombia Market Size and Forecast, By Source, 2018 - 2030 (US$ Million)
- 9.5.9.4. Colombia Market Size and Forecast, By Application, 2018 - 2030 (US$ Million)
- 9.5.10. Rest of LATAM
- 9.5.10.1. Overview
- 9.5.10.2. Market Analysis, Forecast, and Y-O-Y Growth Rate, 2018 - 2030, (US$ Million)
- 9.5.10.3. Rest of LATAM Market Size and Forecast, By Source, 2018 - 2030 (US$ Million)
- 9.5.10.4. Rest of LATAM Market Size and Forecast, By Application, 2018 - 2030 (US$ Million)
- 9.6. Middle East and Africa
- 9.6.1. Overview
- 9.6.2. Semiconductor Memory Key Manufacturers in Middle East and Africa
- 9.6.3. Middle East and Africa Market Size and Forecast, By Country, 2018 - 2030 (US$ Million)
- 9.6.4. Middle East and Africa Market Size and Forecast, By Source, 2018 - 2030 (US$ Million)
- 9.6.5. Middle East and Africa Market Size and Forecast, By Application, 2018 - 2030 (US$ Million)
- 9.6.6. Saudi Arabia
- 9.6.6.1. Overview
- 9.6.6.2. Market Analysis, Forecast, and Y-O-Y Growth Rate, 2018 - 2030, (US$ Million)
- 9.6.6.3. Saudi Arabia Market Size and Forecast, By Source, 2018 - 2030 (US$ Million)
- 9.6.6.4. Saudi Arabia Market Size and Forecast, By Application, 2018 - 2030 (US$ Million)
- 9.6.7. United Arab Emirates
- 9.6.7.1. Overview
- 9.6.7.2. Market Analysis, Forecast, and Y-O-Y Growth Rate, 2018 - 2030, (US$ Million)
- 9.6.7.3. United Arab Emirates Market Size and Forecast, By Source, 2018 - 2030 (US$ Million)
- 9.6.7.4. United Arab Emirates Market Size and Forecast, By Application, 2018 - 2030 (US$ Million)
- 9.6.8. Israel
- 9.6.8.1. Overview
- 9.6.8.2. Market Analysis, Forecast, and Y-O-Y Growth Rate, 2018 - 2030, (US$ Million)
- 9.6.8.3. Israel Market Size and Forecast, By Source, 2018 - 2030 (US$ Million)
- 9.6.8.4. Israel Market Size and Forecast, By Application, 2018 - 2030 (US$ Million)
- 9.6.9. Turkey
- 9.6.9.1. Overview
- 9.6.9.2. Market Analysis, Forecast, and Y-O-Y Growth Rate, 2018 - 2030, (US$ Million)
- 9.6.9.3. Turkey Market Size and Forecast, By Source, 2018 - 2030 (US$ Million)
- 9.6.9.4. Turkey Market Size and Forecast, By Application, 2018 - 2030 (US$ Million)
- 9.6.10. Algeria
- 9.6.10.1. Overview
- 9.6.10.2. Market Analysis, Forecast, and Y-O-Y Growth Rate, 2018 - 2030, (US$ Million)
- 9.6.10.3. Algeria Market Size and Forecast, By Source, 2018 - 2030 (US$ Million)
- 9.6.10.4. Algeria Market Size and Forecast, By Application, 2018 - 2030 (US$ Million)
- 9.6.11. Egypt
- 9.6.11.1. Overview
- 9.6.11.2. Market Analysis, Forecast, and Y-O-Y Growth Rate, 2018 - 2030, (US$ Million)
- 9.6.11.3. Egypt Market Size and Forecast, By Source, 2018 - 2030 (US$ Million)
- 9.6.11.4. Egypt Market Size and Forecast, By Application, 2018 - 2030 (US$ Million)
- 9.6.12. Rest of MEA
- 9.6.12.1. Overview
- 9.6.12.2. Market Analysis, Forecast, and Y-O-Y Growth Rate, 2018 - 2030, (US$ Million)
- 9.6.12.3. Rest of MEA Market Size and Forecast, By Source, 2018 - 2030 (US$ Million)
- 9.6.12.4. Rest of MEA Market Size and Forecast, By Application, 2018 - 2030 (US$ Million)
10. Key Vendor Analysis- Semiconductor Memory Industry
- 10.1. Competitive Dashboard
- 10.2. Company Profiles
- 10.2.1. TSI Group Ltd.
- 10.2.2. Synutra Ingredients
- 10.2.3. Summit Nutritionals International, Inc.
- 10.2.4. Sino Lion (USA) Inc.
- 10.2.5. Sigma-Aldrich (now part of MilliporeSigma)
- 10.2.6. Shandong Runxin Biotechnology Co., Ltd.
- 10.2.7. Qingdao WanTuMing Biological Products Co., Ltd.
- 10.2.8. Marlyn Nutraceuticals, Inc.
- 10.2.9. Jiaxing Hengjie Biopharmaceutical Co., Ltd.
- 10.2.10. Hebei Smart Chemicals Co., Ltd.
- 10.2.11. Hangzhou Kalong Trade Co., Ltd.
- 10.2.12. Hangzhou Focus Corporation
- 10.2.13. Changzhou ComWin Fine Chemicals Co., Ltd.
- 10.2.14. Bioiberica
- 10.2.15. Baoji Tendenci Chemical Co., Ltd.
11. 360 Degree Analyst View
12. Appendix
- 12.1. Research Methodology
- 12.2. References
- 12.3. Abbreviations
- 12.4. Disclaimer
- 12.5. Contact Us
