|
|
市場調査レポート
商品コード
1358213
テスト&バーンインソケット市場:動作別、タイプ別、用途別、国別、地域別- 産業分析、市場規模、市場シェア、2023-2030年予測Test & Burn-In Socket Market, By Operation, By Type, By Application, By Country, and By Region - Industry Analysis, Market Size, Market Share & Forecast from 2023-2030 |
||||||
|
|
|||||||
カスタマイズ可能
|
|||||||


| テスト&バーンインソケット市場:動作別、タイプ別、用途別、国別、地域別- 産業分析、市場規模、市場シェア、2023-2030年予測 |
|
出版日: 2023年10月01日
発行: AnalystView Market Insights
ページ情報: 英文 288 Pages
納期: 2~3営業日
|

- 全表示
- 概要
- 図表
- 目次
レポートハイライト
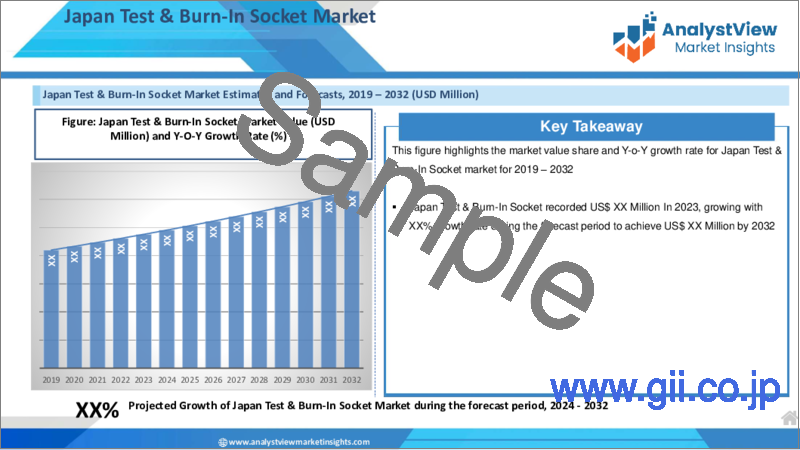
テスト&バーンインソケット市場規模は2022年に14億8,060万米ドルとなり、2023年から2030年にかけてCAGR 8.8%で拡大
テスト&バーンインソケット市場- 市場力学:
- 半導体需要の増加が市場成長を牽引
- 半導体デバイスの需要増加は、家電、自動車、モノのインターネット(IoT)、データセンターなど、さまざまな業界で顕著な傾向となっています。このような半導体生産の急増により、効率的なテストやバーンインプロセスを促進するテストソケットのニーズが高まっています。例えば、GSM(Global System for Mobile Communications)は、2025年までに世界人口の約3分の1が5Gネットワークにアクセスできるようになると予測しています。
- さらに、2022年末までに10億の5G接続があり、この数は2025年までに20億に達すると予測しています。さまざまな地域で5Gワイヤレスネットワークが急速に展開されることは、5G対応機器のメーカーや通信機器ベンダーに利益をもたらし、チップメーカーに有利な新市場を開拓する機会を提供します。この勢いは、今後数年間で大幅な市場成長を促進すると予想されます。
テスト&バーンインソケット市場-セグメンテーション分析:
- 世界規模のテスト&バーンインソケット市場は、動作、タイプ、アプリケーション、地域などの明確なカテゴリを中心に構成されています。
- 操作に関しては、世界のテスト&バーンインソケット市場は手動操作と自動操作の間に区別されます。特に、手動操作セグメントは、予測期間を通じてかなりの市場シェアを占める見込みです。このように手動ソケットが好まれるのは、自動化またはロボットハンドリングと比較した場合の費用対効果に起因しており、大量テストの自動化が必要でないシナリオでは好ましい選択肢となっています。
テスト&バーンイン用ソケット市場-競合情勢:
E-Tec Interconnect AG、Cohu, Inc.、Aries Electronics, Inc.、Contech Solutions、3M Company、Loranger International Corporation、Advanced Interconnections Corp.、JC CHERRY、Megatone Electronics Corp.、INNO GLOBAL、日本マイクロニクス、Johnstech International、Mill-Max Mfg.Corporation、FoundPac、C.C.P. Contact Probes Co.
目次
第1章 テストおよびバーンインソケット市場概要
- 調査範囲
- 市場推定年数
第2章 エグゼクティブサマリー
- 市場内訳
- 競合考察
第3章 テストおよびバーンインソケットの主要な市場動向
- 市場促進要因
- 市場抑制要因
- 市場機会
- 今後の市場動向
第4章 テストおよびバーンインソケット業界の調査
- PEST分析
- ポーターのファイブフォース分析
- 成長見通しのマッピング
- 規制枠組みの分析
第5章 テストおよびバーンインソケット市場:COVID-19症の影響分析
- 新型コロナウイルス感染症以前の影響分析
- 新型コロナウイルス感染症後の影響分析
第6章 テストおよびバーンインソケット市場情勢
- テストおよびバーンインソケットの市場シェア分析、2022年
- 主要メーカー別の内訳データ
- 既存企業の分析
- 新興企業の分析
第7章 テストおよびバーンインソケット市場- 動作別
- 概要
- 事業別セグメントシェア分析
- マニュアル
- 自動化
第8章 テストおよびバーンインソケット市場- タイプ別
- 概要
- タイプ別セグメントシェア分析
- バーンインタイプ
- 開発型
- 生産タイプ
- テストコンタクタのタイプ
第9章 テストおよびバーンインソケット市場- アプリケーション別
- 概要
- アプリケーション別のセグメントシェア分析
- 家電
- 自動車
- 防衛
- 医学
- その他
第10章 テストおよびバーンインソケット市場-地域別
- イントロダクション
- 北米
- 概要
- 北米の主要メーカー
- 米国
- カナダ
- 欧州
- 概要
- 欧州の主要メーカー
- ドイツ
- イタリア
- 英国
- フランス
- ロシア
- オランダ
- スウェーデン
- ポーランド
- その他
- アジア太平洋(APAC)
- 概要
- アジア太平洋地域の主要メーカー
- インド
- 中国
- 日本
- 韓国
- オーストラリア
- タイ
- インドネシア
- フィリピン
- その他
- ラテンアメリカ
- 概要
- ラテンアメリカの主要メーカー
- ブラジル
- メキシコ
- アルゼンチン
- コロンビア
- その他
- 中東とアフリカ
- 概要
- 中東およびアフリカの主要メーカー
- サウジアラビア
- アラブ首長国連邦
- イスラエル
- トルコ
- アルジェリア
- エジプト
- その他
第11章 主要ベンダー分析- テストおよびバーンインソケット業界
- 競合ダッシュボード
- 企業プロファイル
- Cohu, Inc.
- E-Tec Interconnect AG
- Contech Solutions
- Aries Electronics, Inc.
- 3M Company
- Advanced Interconnections Corp.
- Loranger International Corporation
- Megatone Electronics Corp.
- JC CHERRY
- INNO GLOABAL
- Micronics Japan
- Mill-Max Mfg. Corporation
- Johnstech International
- FoundPac
- CCP Contact Probes Co., Ltd.
第12章 アナリストの全方位展望
List of Tables
- TABLE List of data sources
- TABLE Market drivers; Impact Analysis
- TABLE Market restraints; Impact Analysis
- TABLE Test & Burn-In Socket Market: Operation Snapshot (2022)
- TABLE Segment Dashboard; Definition and Scope, by Operation
- TABLE Global Test & Burn-In Socket Market, by Operation 2018-2030 (USD Million)
- TABLE Test & Burn-In Socket Market: Type Snapshot (2022)
- TABLE Segment Dashboard; Definition and Scope, by Type
- TABLE Global Test & Burn-In Socket Market, by Type 2018-2030 (USD Million)
- TABLE Test & Burn-In Socket Market: Application Snapshot (2022)
- TABLE Segment Dashboard; Definition and Scope, by Application
- TABLE Global Test & Burn-In Socket Market, by Application 2018-2030 (USD Million)
- TABLE Test & Burn-In Socket Market: Regional snapshot (2022)
- TABLE Segment Dashboard; Definition and Scope, by Region
- TABLE Global Test & Burn-In Socket Market, by Region 2018-2030 (USD Million)
- TABLE North America Test & Burn-In Socket Market, by Country, 2018-2030 (USD Million)
- TABLE North America Test & Burn-In Socket Market, by Operation, 2018-2030 (USD Million)
- TABLE North America Test & Burn-In Socket Market, by Type, 2018-2030 (USD Million)
- TABLE North America Test & Burn-In Socket Market, by Application, 2018-2030 (USD Million)
- TABLE Europe Test & Burn-In Socket Market, by Country, 2018-2030 (USD Million)
- TABLE Europe Test & Burn-In Socket Market, by Operation, 2018-2030 (USD Million)
- TABLE Europe Test & Burn-In Socket Market, by Type, 2018-2030 (USD Million)
- TABLE Europe Test & Burn-In Socket Market, by Application, 2018-2030 (USD Million)
- TABLE Asia Pacific Test & Burn-In Socket Market, by Country, 2018-2030 (USD Million)
- TABLE Asia Pacific Test & Burn-In Socket Market, by Operation, 2018-2030 (USD Million)
- TABLE Asia Pacific Test & Burn-In Socket Market, by Type, 2018-2030 (USD Million)
- TABLE Asia Pacific Test & Burn-In Socket Market, by Application, 2018-2030 (USD Million)
- TABLE Latin America Test & Burn-In Socket Market, by Country, 2018-2030 (USD Million)
- TABLE Latin America Test & Burn-In Socket Market, by Operation, 2018-2030 (USD Million)
- TABLE Latin America Test & Burn-In Socket Market, by Type, 2018-2030 (USD Million)
- TABLE Latin America Test & Burn-In Socket Market, by Application, 2018-2030 (USD Million)
- TABLE Middle East and Africa Test & Burn-In Socket Market, by Country, 2018-2030 (USD Million)
- TABLE Middle East and Africa Test & Burn-In Socket Market, by Operation, 2018-2030 (USD Million)
- TABLE Middle East and Africa Test & Burn-In Socket Market, by Type, 2018-2030 (USD Million)
- TABLE Middle East and Africa Test & Burn-In Socket Market, by Application, 2018-2030 (USD Million)
REPORT HIGHLIGHT
Test & Burn-In Socket Market size was valued at USD 1,480.6 Million in 2022, expanding at a CAGR of 8.8% from 2023 to 2030.
Burn-in sockets, alternatively referred to as IC burn-in sockets, serve as essential components for securing integrated circuits (ICs) onto specialized test boards, known as burn-in boards. The burn-in testing procedure encompasses subjecting these semiconductor devices to rigorous conditions of elevated temperature and voltage within a high-temperature setting, all aimed at scrutinizing and assessing their overall quality and performance characteristics.
Test & Burn-In Socket Market - Market Dynamics:
- Increasing semiconductor demand drives market growth
- The increasing demand for semiconductor devices has become a prominent trend observed across various industries, including consumer electronics, automotive, the Internet of Things (IoT), and data centers. This surge in semiconductor production has subsequently led to a growing need for test sockets to facilitate efficient testing and burn-in processes. For instance, the Global System for Mobile Communications (GSM) organization predicts that by 2025, approximately one-third of the global population will have access to 5G networks.
- Furthermore, it anticipates that by the end of 2022, there will be 1 billion 5G connections, with this number reaching 2 billion by 2025. The rapid deployment of 5G wireless networks in various regions benefits manufacturers of 5G-capable devices and telecommunications equipment vendors, offering chipmakers the opportunity to tap into a lucrative new market. This momentum is expected to drive significant market growth in the years to come.
Test & Burn-In Socket Market - Key Insights:
- According to insights provided by our research analyst, the global market for Test & Burn-In Sockets is poised to experience substantial annual growth, with an estimated CAGR of approximately 8.8% throughout the forecast period spanning from 2023 to 2030.
- The Test & Burn-In Socket sector is forecasted to undergo substantial expansion, primarily driven by the escalating demand for semiconductor devices across various industries.
- Regarding operational aspects, the manual segment is anticipated to wield considerable influence on the market landscape throughout the projected period.
Test & Burn-In Socket Market- Segmentation Analysis:
- The Test & Burn-In Socket Market on a global scale is structured around distinct categories, including operation, type, application, and geographical regions.
- Concerning operation, the worldwide Test & Burn-In Socket market delineates between manual and automated operations. Notably, the manual operation segment is poised to occupy a substantial market share throughout the forecast period. This preference for manual sockets can be attributed to their cost-effectiveness when compared to automated or robotic handling alternatives, making them the preferred choice in scenarios where high-volume testing automation is not a requisite.
Test & Burn-In Socket Market- Competitive Landscape:
E-Tec Interconnect AG, Cohu, Inc., Aries Electronics, Inc., Contech Solutions, 3M Company, Loranger International Corporation, Advanced Interconnections Corp., JC CHERRY, Megatone Electronics Corp., INNO GLOBAL, Micronics Japan, Johnstech International, Mill-Max Mfg. Corporation, FoundPac, and C.C.P. Contact Probes Co., Ltd. are among the key players in this market.
SCOPE OF THE REPORT
The scope of this report covers the market by its major segments, which include as follows:
GLOBAL TEST & BURN-IN SOCKET MARKET KEY PLAYERS
- Cohu, Inc.
- E-Tec Interconnect AG
- Contech Solutions
- Aries Electronics, Inc.
- 3M Company
- Advanced Interconnections Corp.
- Loranger International Corporation
- Megatone Electronics Corp.
- JC CHERRY
- INNO GLOABAL
- Micronics Japan
- Mill-Max Mfg. Corporation
- Johnstech International
- FoundPac
- C.C.P. Contact Probes Co., Ltd.
GLOBAL TEST & BURN-IN SOCKET MARKET, BY OPERATION
- Manual
- Automated
GLOBAL TEST & BURN-IN SOCKET MARKET, BY TYPE
- Burn-in Type
- Development Type
- Production Type
- Test Contactor Type
GLOBAL TEST & BURN-IN SOCKET MARKET, BY APPLICATION
- Consumer Electronics
- Automotive
- Defense
- Medical
- Others
GLOBAL TEST & BURN-IN SOCKET MARKET, BY REGION
- North America
- The U.S.
- Canada
- Europe
- Germany
- France
- Italy
- Spain
- United Kingdom
- Russia
- Netherlands
- Sweden
- Poland
- Rest of Europe
- Asia Pacific
- India
- China
- South Korea
- Japan
- Australia
- Thailand
- Indonesia
- Philippines
- Rest of APAC
- Latin America
- Brazil
- Mexico
- Argentina
- Colombia
- Rest of LATAM
- The Middle East and Africa
- Saudi Arabia
- United Arab Emirates
- Israel
- Turkey
- Algeria
- Egypt
- Rest of MEA
Table of Contents
1. Test & Burn-In Socket Market Overview
- 1.1. Study Scope
- 1.2. Market Estimation Years
2. Executive Summary
- 2.1. Market Snippet
- 2.1.1. Test & Burn-In Socket Market Snippet by Operation
- 2.1.2. Test & Burn-In Socket Market Snippet by Type
- 2.1.3. Test & Burn-In Socket Market Snippet by Application
- 2.1.4. Test & Burn-In Socket Market Snippet by Country
- 2.1.5. Test & Burn-In Socket Market Snippet by Region
- 2.2. Competitive Insights
3. Test & Burn-In Socket Key Market Trends
- 3.1. Test & Burn-In Socket Market Drivers
- 3.1.1. Impact Analysis of Market Drivers
- 3.2. Test & Burn-In Socket Market Restraints
- 3.2.1. Impact Analysis of Market Restraints
- 3.3. Test & Burn-In Socket Market Opportunities
- 3.4. Test & Burn-In Socket Market Future Trends
4. Test & Burn-In Socket Industry Study
- 4.1. PEST Analysis
- 4.2. Porter's Five Forces Analysis
- 4.3. Growth Prospect Mapping
- 4.4. Regulatory Framework Analysis
5. Test & Burn-In Socket Market: COVID-19 Impact Analysis
- 5.1. Pre-COVID-19 Impact Analysis
- 5.2. Post-COVID-19 Impact Analysis
- 5.2.1. Top Performing Segments
- 5.2.2. Marginal Growth Segments
- 5.2.3. Top Looser Segments
- 5.2.4. Marginal Loss Segments
6. Test & Burn-In Socket Market Landscape
- 6.1. Test & Burn-In Socket Market Share Analysis, 2022
- 6.2. Breakdown Data, by Key Manufacturer
- 6.2.1. Established Players' Analysis
- 6.2.2. Emerging Players' Analysis
7. Test & Burn-In Socket Market - By Operation
- 7.1. Overview
- 7.1.1. Segment Share Analysis, By Operation, 2022 & 2030 (%)
- 7.1.2. Manual
- 7.1.3. Automated
8. Test & Burn-In Socket Market - By Type
- 8.1. Overview
- 8.1.1. Segment Share Analysis, By Type, 2022 & 2030 (%)
- 8.1.2. Burn-in Type
- 8.1.3. Development Type
- 8.1.4. Production Type
- 8.1.5. Test Contactor Type
9. Test & Burn-In Socket Market - By Application
- 9.1. Overview
- 9.1.1. Segment Share Analysis, By Application, 2022 & 2030 (%)
- 9.1.2. Consumer Electronics
- 9.1.3. Automotive
- 9.1.4. Defense
- 9.1.5. Medical
- 9.1.6. Others
10. Test & Burn-In Socket Market- By Geography
- 10.1. Introduction
- 10.1.1. Segment Share Analysis, By Geography, 2022 & 2030 (%)
- 10.2. North America
- 10.2.1. Overview
- 10.2.2. Test & Burn-In Socket Key Manufacturers in North America
- 10.2.3. North America Market Size and Forecast, By Country, 2018 - 2030 (US$ Million)
- 10.2.4. North America Market Size and Forecast, By Operation, 2018 - 2030 (US$ Million)
- 10.2.5. North America Market Size and Forecast, By Type, 2018 - 2030 (US$ Million)
- 10.2.6. North America Market Size and Forecast, By Application, 2018 - 2030 (US$ Million)
- 10.2.7. U.S.
- 10.2.7.1. Overview
- 10.2.7.2. Market Analysis, Forecast, and Y-O-Y Growth Rate, 2018 - 2030, (US$ Million)
- 10.2.7.3. U.S. Market Size and Forecast, By Operation, 2018 - 2030 (US$ Million)
- 10.2.7.4. U.S. Market Size and Forecast, By Type, 2018 - 2030 (US$ Million)
- 10.2.7.5. U.S. Market Size and Forecast, By Application, 2018 - 2030 (US$ Million)
- 10.2.8. Canada
- 10.2.8.1. Overview
- 10.2.8.2. Market Analysis, Forecast, and Y-O-Y Growth Rate, 2018 - 2030, (US$ Million)
- 10.2.8.3. Canada Market Size and Forecast, By Operation, 2018 - 2030 (US$ Million)
- 10.2.8.4. Canada Market Size and Forecast, By Type, 2018 - 2030 (US$ Million)
- 10.2.8.5. Canada Market Size and Forecast, By Application, 2018 - 2030 (US$ Million)
- 10.3. Europe
- 10.3.1. Overview
- 10.3.2. Test & Burn-In Socket Key Manufacturers in Europe
- 10.3.3. Europe Market Size and Forecast, By Country, 2018 - 2030 (US$ Million)
- 10.3.4. Europe Market Size and Forecast, By Operation, 2018 - 2030 (US$ Million)
- 10.3.5. Europe Market Size and Forecast, By Type, 2018 - 2030 (US$ Million)
- 10.3.6. Europe Market Size and Forecast, By Application, 2018 - 2030 (US$ Million)
- 10.3.7. Germany
- 10.3.7.1. Overview
- 10.3.7.2. Market Analysis, Forecast, and Y-O-Y Growth Rate, 2018 - 2030, (US$ Million)
- 10.3.7.3. Germany Market Size and Forecast, By Operation, 2018 - 2030 (US$ Million)
- 10.3.7.4. Germany Market Size and Forecast, By Type, 2018 - 2030 (US$ Million)
- 10.3.7.5. Germany Market Size and Forecast, By Application, 2018 - 2030 (US$ Million)
- 10.3.8. Italy
- 10.3.8.1. Overview
- 10.3.8.2. Market Analysis, Forecast, and Y-O-Y Growth Rate, 2018 - 2030, (US$ Million)
- 10.3.8.3. Italy Market Size and Forecast, By Operation, 2018 - 2030 (US$ Million)
- 10.3.8.4. Italy Market Size and Forecast, By Type, 2018 - 2030 (US$ Million)
- 10.3.8.5. Italy Market Size and Forecast, By Application, 2018 - 2030 (US$ Million)
- 10.3.9. United Kingdom
- 10.3.9.1. Overview
- 10.3.9.2. Market Analysis, Forecast, and Y-O-Y Growth Rate, 2018 - 2030, (US$ Million)
- 10.3.9.3. United Kingdom Market Size and Forecast, By Operation, 2018 - 2030 (US$ Million)
- 10.3.9.4. United Kingdom Market Size and Forecast, By Type, 2018 - 2030 (US$ Million)
- 10.3.9.5. United Kingdom Market Size and Forecast, By Application, 2018 - 2030 (US$ Million)
- 10.3.10. France
- 10.3.10.1. Overview
- 10.3.10.2. Market Analysis, Forecast, and Y-O-Y Growth Rate, 2018 - 2030, (US$ Million)
- 10.3.10.3. France Market Size and Forecast, By Operation, 2018 - 2030 (US$ Million)
- 10.3.10.4. France Market Size and Forecast, By Type, 2018 - 2030 (US$ Million)
- 10.3.10.5. France Market Size and Forecast, By Application, 2018 - 2030 (US$ Million)
- 10.3.11. Russia
- 10.3.11.1. Market Analysis, Forecast, and Y-O-Y Growth Rate, 2018 - 2030, (US$ Million)
- 10.3.11.2. Russia Market Size and Forecast, By Operation, 2018 - 2030 (US$ Million)
- 10.3.11.3. Russia Market Size and Forecast, By Type, 2018 - 2030 (US$ Million)
- 10.3.11.4. Russia Market Size and Forecast, By Application, 2018 - 2030 (US$ Million)
- 10.3.12. Netherlands
- 10.3.12.1. Market Analysis, Forecast, and Y-O-Y Growth Rate, 2018 - 2030, (US$ Million)
- 10.3.12.2. Netherlands Market Size and Forecast, By Operation, 2018 - 2030 (US$ Million)
- 10.3.12.3. Netherlands Market Size and Forecast, By Type, 2018 - 2030 (US$ Million)
- 10.3.12.4. Netherlands Market Size and Forecast, By Application, 2018 - 2030 (US$ Million)
- 10.3.13. Sweden
- 10.3.13.1. Market Analysis, Forecast, and Y-O-Y Growth Rate, 2018 - 2030, (US$ Million)
- 10.3.13.2. Sweden Market Size and Forecast, By Operation, 2018 - 2030 (US$ Million)
- 10.3.13.3. Sweden Market Size and Forecast, By Type, 2018 - 2030 (US$ Million)
- 10.3.13.4. Sweden Market Size and Forecast, By Application, 2018 - 2030 (US$ Million)
- 10.3.14. Poland
- 10.3.14.1. Market Analysis, Forecast, and Y-O-Y Growth Rate, 2018 - 2030, (US$ Million)
- 10.3.14.2. Poland Market Size and Forecast, By Operation, 2018 - 2030 (US$ Million)
- 10.3.14.3. Poland Market Size and Forecast, By Type, 2018 - 2030 (US$ Million)
- 10.3.14.4. Poland Market Size and Forecast, By Application, 2018 - 2030 (US$ Million)
- 10.3.15. Rest of Europe
- 10.3.15.1. Overview
- 10.3.15.2. Market Analysis, Forecast, and Y-O-Y Growth Rate, 2018 - 2030, (US$ Million)
- 10.3.15.3. Rest of the Europe Market Size and Forecast, By Operation, 2018 - 2030 (US$ Million)
- 10.3.15.4. Rest of the Europe Market Size and Forecast, By Type, 2018 - 2030 (US$ Million)
- 10.3.15.5. Rest of the Europe Market Size and Forecast, By Application, 2018 - 2030 (US$ Million)
- 10.4. Asia Pacific (APAC)
- 10.4.1. Overview
- 10.4.2. Test & Burn-In Socket Key Manufacturers in Asia Pacific
- 10.4.3. Asia Pacific Market Size and Forecast, By Country, 2018 - 2030 (US$ Million)
- 10.4.4. Asia Pacific Market Size and Forecast, By Operation, 2018 - 2030 (US$ Million)
- 10.4.5. Asia Pacific Market Size and Forecast, By Type, 2018 - 2030 (US$ Million)
- 10.4.6. Asia Pacific Market Size and Forecast, By Application, 2018 - 2030 (US$ Million)
- 10.4.7. India
- 10.4.7.1. Overview
- 10.4.7.2. Market Analysis, Forecast, and Y-O-Y Growth Rate, 2018 - 2030, (US$ Million)
- 10.4.7.3. India Market Size and Forecast, By Operation, 2018 - 2030 (US$ Million)
- 10.4.7.4. India Market Size and Forecast, By Type, 2018 - 2030 (US$ Million)
- 10.4.7.5. India Market Size and Forecast, By Application, 2018 - 2030 (US$ Million)
- 10.4.8. China
- 10.4.8.1. Overview
- 10.4.8.2. Market Analysis, Forecast, and Y-O-Y Growth Rate, 2018 - 2030, (US$ Million)
- 10.4.8.3. China Market Size and Forecast, By Operation, 2018 - 2030 (US$ Million)
- 10.4.8.4. China Market Size and Forecast, By Type, 2018 - 2030 (US$ Million)
- 10.4.8.5. China Market Size and Forecast, By Application, 2018 - 2030 (US$ Million)
- 10.4.9. Japan
- 10.4.9.1. Overview
- 10.4.9.2. Market Analysis, Forecast, and Y-O-Y Growth Rate, 2018 - 2030, (US$ Million)
- 10.4.9.3. Japan Market Size and Forecast, By Operation, 2018 - 2030 (US$ Million)
- 10.4.9.4. Japan Market Size and Forecast, By Type, 2018 - 2030 (US$ Million)
- 10.4.9.5. Japan Market Size and Forecast, By Application, 2018 - 2030 (US$ Million)
- 10.4.10. South Korea
- 10.4.10.1. Overview
- 10.4.10.2. Market Analysis, Forecast, and Y-O-Y Growth Rate, 2018 - 2030, (US$ Million)
- 10.4.10.3. South Korea Market Size and Forecast, By Operation, 2018 - 2030 (US$ Million)
- 10.4.10.4. South Korea Market Size and Forecast, By Type, 2018 - 2030 (US$ Million)
- 10.4.10.5. South Korea Market Size and Forecast, By Application, 2018 - 2030 (US$ Million)
- 10.4.11. Australia
- 10.4.11.1. Overview
- 10.4.11.2. Market Analysis, Forecast, and Y-O-Y Growth Rate, 2018 - 2030, (US$ Million)
- 10.4.11.3. Australia Market Size and Forecast, By Operation, 2018 - 2030 (US$ Million)
- 10.4.11.4. Australia Market Size and Forecast, By Type, 2018 - 2030 (US$ Million)
- 10.4.11.5. Australia Market Size and Forecast, By Application, 2018 - 2030 (US$ Million)
- 10.4.12. Thailand
- 10.4.12.1. Overview
- 10.4.12.2. Market Analysis, Forecast, and Y-O-Y Growth Rate, 2018 - 2030, (US$ Million)
- 10.4.12.3. Thailand Market Size and Forecast, By Operation, 2018 - 2030 (US$ Million)
- 10.4.12.4. Thailand Market Size and Forecast, By Type, 2018 - 2030 (US$ Million)
- 10.4.12.5. Thailand Market Size and Forecast, By Application, 2018 - 2030 (US$ Million)
- 10.4.13. Indonesia
- 10.4.13.1. Overview
- 10.4.13.2. Market Analysis, Forecast, and Y-O-Y Growth Rate, 2018 - 2030, (US$ Million)
- 10.4.13.3. Indonesia Market Size and Forecast, By Operation, 2018 - 2030 (US$ Million)
- 10.4.13.4. Indonesia Market Size and Forecast, By Type, 2018 - 2030 (US$ Million)
- 10.4.13.5. Indonesia Market Size and Forecast, By Application, 2018 - 2030 (US$ Million)
- 10.4.14. Philippines
- 10.4.14.1. Overview
- 10.4.14.2. Market Analysis, Forecast, and Y-O-Y Growth Rate, 2018 - 2030, (US$ Million)
- 10.4.14.3. Philippines Market Size and Forecast, By Operation, 2018 - 2030 (US$ Million)
- 10.4.14.4. Philippines Market Size and Forecast, By Type, 2018 - 2030 (US$ Million)
- 10.4.14.5. Philippines Market Size and Forecast, By Application, 2018 - 2030 (US$ Million)
- 10.4.15. Rest of APAC
- 10.4.15.1. Overview
- 10.4.15.2. Market Analysis, Forecast, and Y-O-Y Growth Rate, 2018 - 2030, (US$ Million)
- 10.4.15.3. Rest of APAC Market Size and Forecast, By Operation, 2018 - 2030 (US$ Million)
- 10.4.15.4. Rest of APAC Market Size and Forecast, By Type, 2018 - 2030 (US$ Million)
- 10.4.15.5. Rest of APAC Market Size and Forecast, By Application, 2018 - 2030 (US$ Million)
- 10.5. Latin America
- 10.5.1. Overview
- 10.5.2. Test & Burn-In Socket Key Manufacturers in Latin America
- 10.5.3. Latin America Market Size and Forecast, By Country, 2018 - 2030 (US$ Million)
- 10.5.4. Latin America Market Size and Forecast, By Operation, 2018 - 2030 (US$ Million)
- 10.5.5. Latin America Market Size and Forecast, By Type, 2018 - 2030 (US$ Million)
- 10.5.6. Latin America Market Size and Forecast, By Application, 2018 - 2030 (US$ Million)
- 10.5.7. Brazil
- 10.5.7.1. Overview
- 10.5.7.2. Market Analysis, Forecast, and Y-O-Y Growth Rate, 2018 - 2030, (US$ Million)
- 10.5.7.3. Brazil Market Size and Forecast, By Operation, 2018 - 2030 (US$ Million)
- 10.5.7.4. Brazil Market Size and Forecast, By Type, 2018 - 2030 (US$ Million)
- 10.5.7.5. Brazil Market Size and Forecast, By Application, 2018 - 2030 (US$ Million)
- 10.5.8. Mexico
- 10.5.8.1. Overview
- 10.5.8.2. Market Analysis, Forecast, and Y-O-Y Growth Rate, 2018 - 2030, (US$ Million)
- 10.5.8.3. Mexico Market Size and Forecast, By Operation, 2018 - 2030 (US$ Million)
- 10.5.8.4. Mexico Market Size and Forecast, By Type, 2018 - 2030 (US$ Million)
- 10.5.8.5. Mexico Market Size and Forecast, By Application, 2018 - 2030 (US$ Million)
- 10.5.9. Argentina
- 10.5.9.1. Overview
- 10.5.9.2. Market Analysis, Forecast, and Y-O-Y Growth Rate, 2018 - 2030, (US$ Million)
- 10.5.9.3. Argentina Market Size and Forecast, By Operation, 2018 - 2030 (US$ Million)
- 10.5.9.4. Argentina Market Size and Forecast, By Type, 2018 - 2030 (US$ Million)
- 10.5.9.5. Argentina Market Size and Forecast, By Application, 2018 - 2030 (US$ Million)
- 10.5.10. Colombia
- 10.5.10.1. Overview
- 10.5.10.2. Market Analysis, Forecast, and Y-O-Y Growth Rate, 2018 - 2030, (US$ Million)
- 10.5.10.3. Colombia Market Size and Forecast, By Operation, 2018 - 2030 (US$ Million)
- 10.5.10.4. Colombia Market Size and Forecast, By Type, 2018 - 2030 (US$ Million)
- 10.5.10.5. Colombia Market Size and Forecast, By Application, 2018 - 2030 (US$ Million)
- 10.5.11. Rest of LATAM
- 10.5.11.1. Overview
- 10.5.11.2. Market Analysis, Forecast, and Y-O-Y Growth Rate, 2018 - 2030, (US$ Million)
- 10.5.11.3. Rest of LATAM Market Size and Forecast, By Operation, 2018 - 2030 (US$ Million)
- 10.5.11.4. Rest of LATAM Market Size and Forecast, By Type, 2018 - 2030 (US$ Million)
- 10.5.11.5. Rest of LATAM Market Size and Forecast, By Application, 2018 - 2030 (US$ Million)
- 10.6. Middle East and Africa
- 10.6.1. Overview
- 10.6.2. Test & Burn-In Socket Key Manufacturers in Middle East and Africa
- 10.6.3. Middle East and Africa Market Size and Forecast, By Country, 2018 - 2030 (US$ Million)
- 10.6.4. Middle East and Africa Market Size and Forecast, By Operation, 2018 - 2030 (US$ Million)
- 10.6.5. Middle East and Africa Market Size and Forecast, By Type, 2018 - 2030 (US$ Million)
- 10.6.6. Middle East and Africa Market Size and Forecast, By Application, 2018 - 2030 (US$ Million)
- 10.6.7. Saudi Arabia
- 10.6.7.1. Overview
- 10.6.7.2. Market Analysis, Forecast, and Y-O-Y Growth Rate, 2018 - 2030, (US$ Million)
- 10.6.7.3. Saudi Arabia Market Size and Forecast, By Operation, 2018 - 2030 (US$ Million)
- 10.6.7.4. Saudi Arabia Market Size and Forecast, By Type, 2018 - 2030 (US$ Million)
- 10.6.7.5. Saudi Arabia Market Size and Forecast, By Application, 2018 - 2030 (US$ Million)
- 10.6.8. United Arab Emirates
- 10.6.8.1. Overview
- 10.6.8.2. Market Analysis, Forecast, and Y-O-Y Growth Rate, 2018 - 2030, (US$ Million)
- 10.6.8.3. United Arab Emirates Market Size and Forecast, By Operation, 2018 - 2030 (US$ Million)
- 10.6.8.4. United Arab Emirates Market Size and Forecast, By Type, 2018 - 2030 (US$ Million)
- 10.6.8.5. United Arab Emirates Market Size and Forecast, By Application, 2018 - 2030 (US$ Million)
- 10.6.9. Israel
- 10.6.9.1. Overview
- 10.6.9.2. Market Analysis, Forecast, and Y-O-Y Growth Rate, 2018 - 2030, (US$ Million)
- 10.6.9.3. Israel Market Size and Forecast, By Operation, 2018 - 2030 (US$ Million)
- 10.6.9.4. Israel Market Size and Forecast, By Type, 2018 - 2030 (US$ Million)
- 10.6.9.5. Israel Market Size and Forecast, By Application, 2018 - 2030 (US$ Million)
- 10.6.10. Turkey
- 10.6.10.1. Overview
- 10.6.10.2. Market Analysis, Forecast, and Y-O-Y Growth Rate, 2018 - 2030, (US$ Million)
- 10.6.10.3. Turkey Market Size and Forecast, By Operation, 2018 - 2030 (US$ Million)
- 10.6.10.4. Turkey Market Size and Forecast, By Type, 2018 - 2030 (US$ Million)
- 10.6.10.5. Turkey Market Size and Forecast, By Application, 2018 - 2030 (US$ Million)
- 10.6.11. Algeria
- 10.6.11.1. Overview
- 10.6.11.2. Market Analysis, Forecast, and Y-O-Y Growth Rate, 2018 - 2030, (US$ Million)
- 10.6.11.3. Algeria Market Size and Forecast, By Operation, 2018 - 2030 (US$ Million)
- 10.6.11.4. Algeria Market Size and Forecast, By Type, 2018 - 2030 (US$ Million)
- 10.6.11.5. Algeria Market Size and Forecast, By Application, 2018 - 2030 (US$ Million)
- 10.6.12. Egypt
- 10.6.12.1. Overview
- 10.6.12.2. Market Analysis, Forecast, and Y-O-Y Growth Rate, 2018 - 2030, (US$ Million)
- 10.6.12.3. Egypt Market Size and Forecast, By Operation, 2018 - 2030 (US$ Million)
- 10.6.12.4. Egypt Market Size and Forecast, By Type, 2018 - 2030 (US$ Million)
- 10.6.12.5. Egypt Market Size and Forecast, By Application, 2018 - 2030 (US$ Million)
- 10.6.13. Rest of MEA
- 10.6.13.1. Overview
- 10.6.13.2. Market Analysis, Forecast, and Y-O-Y Growth Rate, 2018 - 2030, (US$ Million)
- 10.6.13.3. Rest of MEA Market Size and Forecast, By Operation, 2018 - 2030 (US$ Million)
- 10.6.13.4. Rest of MEA Market Size and Forecast, By Type, 2018 - 2030 (US$ Million)
- 10.6.13.5. Rest of MEA Market Size and Forecast, By Application, 2018 - 2030 (US$ Million)
11. Key Vendor Analysis- Test & Burn-In Socket Industry
- 11.1. Competitive Dashboard
- 11.2. Company Profiles
- 11.2.1. Cohu, Inc.
- 11.2.2. E-Tec Interconnect AG
- 11.2.3. Contech Solutions
- 11.2.4. Aries Electronics, Inc.
- 11.2.5. 3M Company
- 11.2.6. Advanced Interconnections Corp.
- 11.2.7. Loranger International Corporation
- 11.2.8. Megatone Electronics Corp.
- 11.2.9. JC CHERRY
- 11.2.10. INNO GLOABAL
- 11.2.11. Micronics Japan
- 11.2.12. Mill-Max Mfg. Corporation
- 11.2.13. Johnstech International
- 11.2.14. FoundPac
- 11.2.15. C.C.P. Contact Probes Co., Ltd.
12. 360 Degree Analyst View
13. Appendix
- 13.1. Research Methodology
- 13.2. References
- 13.3. Abbreviations
- 13.4. Disclaimer
- 13.5. Contact Us
