|
|
市場調査レポート
商品コード
1335304
神経バイオマーカー市場:タイプ別、用途別、最終用途別、国別、地域別- 産業分析、市場規模、市場シェア、2023-2030年予測Neurological Biomarkers Market with COVID-19 Impact Analysis, By Type, By Application, By End-use, By Country, and By Region - Industry Analysis, Market Size, Market Share & Forecast from 2023-2030 |
||||||
|
|
|||||||
カスタマイズ可能
|
|||||||


| 神経バイオマーカー市場:タイプ別、用途別、最終用途別、国別、地域別- 産業分析、市場規模、市場シェア、2023-2030年予測 |
|
出版日: 2023年08月01日
発行: AnalystView Market Insights
ページ情報: 英文 318 Pages
納期: 2~3営業日
|

- 全表示
- 概要
- 図表
- 目次
レポートハイライト
神経学バイオマーカー市場規模は2022年に56億790万米ドルとなり、2023年から2030年にかけてCAGR 15.8%で拡大
神経学バイオマーカー市場-市場力学:
- 技術的進歩の増大と精密医療の発展。
- バイオマーカーシグネチャーを含むバイオマーカーの進歩により、神経疾患はより治療しやすくなっています。その結果、より迅速な医薬品開発、早期診断、非侵襲的検査が可能になります。さらに、デジタルバイオマーカーは様々な製薬会社に臨床試験の決定を下すための補足情報を提供します。このような要因が神経バイオマーカー市場の成長を後押ししています。さらに、個別化医療では、神経変性疾患におけるバイオマーカー研究が大きく進展しています。様々な分子が様々な神経変性疾患と関連し、評価されています。このように、バイオ医薬品業界は精密医療の進化に影響を受けています。バイオ医薬品会社から診断薬会社まで、商業活動から研究開発までを含むいくつかの機能を持つさまざまなプレーヤーが、大きな変化を観察すると思われます。これは市場成長にプラスの影響を与えるものと考えられます。しかし、バイオマーカー開発サイクルの長期化と立ち上げコストの高さが市場成長を抑制すると予想されます。さらに、研究の多くの段階で資金を提供する組織が広く存在することは、市場拡大の大きなチャンスになると予想されます。アルツハイマー病や脳の老化における健康格差に関連する調査を支援するため、米国国立衛生研究所(NIH)は追加資金を提供しています。
神経学バイオマーカー市場-セグメンテーション分析:
- 世界の神経バイオマーカー市場は、タイプ、用途、最終用途、地域に基づいてセグメント化されます。
- タイプ別では、イメージング、プロテオミック、ゲノム、メタボローム、その他の4つに分類されます。予測期間中、ゲノム分野が優位を維持すると思われます。同分野は、個人の疾病素因や特定の遺伝子変異に基づく個別化医薬品や診断の開発にさまざまな機会を提供します。さらに、疾患に関連するDNA配列変異を検出するためのゲノムバイオマーカーを同定または研究するために使用される方法には、一塩基多型(SNP)を用いた全ゲノム関連研究、アレイ比較ゲノムハイブリダイゼーション(CGH)、全ゲノムリシーケンス、遺伝子発現プロファイリングなどがあります。
- 市場はアプリケーションに基づいて、多発性硬化症、アルツハイマー病、自閉症スペクトラム障害、パーキンソン病、その他の4つのカテゴリーに分けられます。アルツハイマー病分野が市場を独占すると予想されています。この成長の背景には、疾病負担の増大と、診断用のイメージングバイオマーカー-アミロイドPETトレーサーを含む臨床用製品の入手可能性があります。さらに、非営利団体や政府機関が多くの研究機会を提供しており、市場成長を後押しする可能性があります。
- 市場は最終用途に基づき、研究機関、病院・院内検査室、独立系臨床診断センター、その他の3つに分類されます。病院・ホスピタリティ分野は、入院患者数の増加により、予測期間中も優位性を維持すると思われます。さらに、ホスピタリティは、ヘルスケアインフラの継続的な開発によって強化されています。血液ベースのバイオマーカーアッセイの多くは病院が所有し、大量に利用されています。さらに、バイオマーカーの採用が増加している外来手術センター(ASCs)や創薬開発のための製薬会社により、研究機関が最も急速に成長すると見られています。
神経バイオマーカー市場-地理的洞察:
地理的には、北米、ラテンアメリカ、欧州、アジア太平洋、中東アフリカの各地域に広がっています。これらの地域は、ビジネスをもたらす国によってさらに分けられます。
神経バイオマーカー市場-競合情勢:
認知症、脳腫瘍、片頭痛、てんかん、アルツハイマー病などの神経疾患の有病率の上昇が市場の成長に寄与しています。また、神経疾患では、早期診断の必要性や技術の進歩などの要因が市場成長に寄与しています。さらに、革新的な製品の開発やサプライチェーンの強化につながる活用を可能にする市場プレーヤーが採用した戦略。これに基づく戦略には、市場での足掛かりを得るための様々な製品の発売、提携、合意、買収、技術的進歩などが含まれます。例えば、2020年8月、Enigma Biomedical Groupは、ヤンセンから新規神経イメージングバイオマーカーをライセンシングする契約を締結したと発表しました。さらに、これらのバイオマーカーは、アルツハイマー病やその他の認知症を含む神経変性疾患の理解を深める上で不可欠な新しいツールを提供することが期待されています。
目次
第1章 神経バイオマーカー市場概要
- 調査範囲
- 市場推定年数
第2章 エグゼクティブサマリー
- 市場内訳
- 競合考察
第3章 神経バイオマーカーの主要な市場動向
- 市場促進要因
- 市場抑制要因
- 市場機会
- 今後の市場動向
第4章 神経バイオマーカー産業調査
- PEST分析
- ポーターのファイブフォース分析
- 成長見通しのマッピング
- 規制枠組みの分析
第5章 神経バイオマーカー市場:COVID-19症の影響分析
- 新型コロナウイルス感染症以前の影響分析
- 新型コロナウイルス感染症後の影響分析
第6章 神経バイオマーカー市場情勢
- 神経バイオマーカー市場シェア分析、2022年
- 主要メーカー別の内訳データ
- 既存企業の分析
- 新興企業の分析
第7章 神経バイオマーカー市場- タイプ別
- 概要
- タイプ別セグメントシェア分析
- イメージング
- プロテオミクス
- ゲノム
- メタボロミクス
- その他
第8章 神経バイオマーカー市場- アプリケーション別
- 概要
- アプリケーション別のセグメントシェア分析
- 多発性硬化症
- アルツハイマー病
- 自閉症スペクトラム障害
- パーキンソン病
- その他
第9章 神経バイオマーカー市場- 最終用途別
- 概要
- 最終用途別のセグメントシェア分析
- 調査機関
- 病院および病院検査室
- 独立した臨床診断センター
- その他
第10章 神経バイオマーカー市場-地域別
- イントロダクション
- 北米
- 概要
- 北米の主要メーカー
- 米国
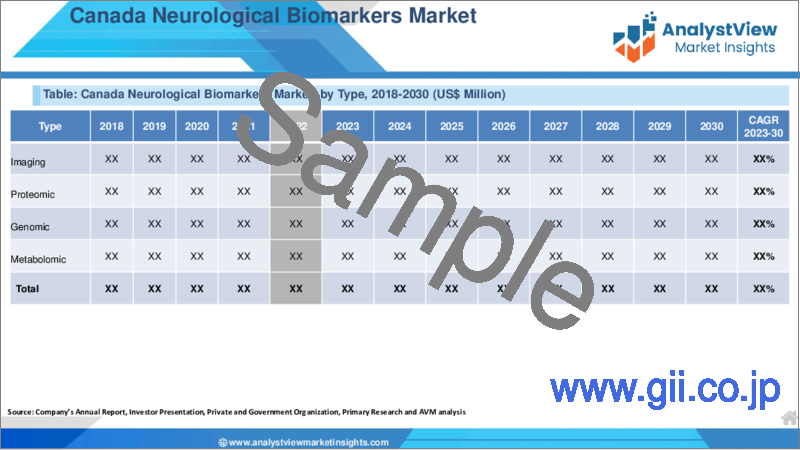
- カナダ
- 欧州
- 概要
- 欧州の主要メーカー
- ドイツ
- イタリア
- 英国
- フランス
- ロシア
- オランダ
- スウェーデン
- ポーランド
- その他
- アジア太平洋(APAC)
- 概要
- アジア太平洋地域の主要メーカー
- インド
- 中国
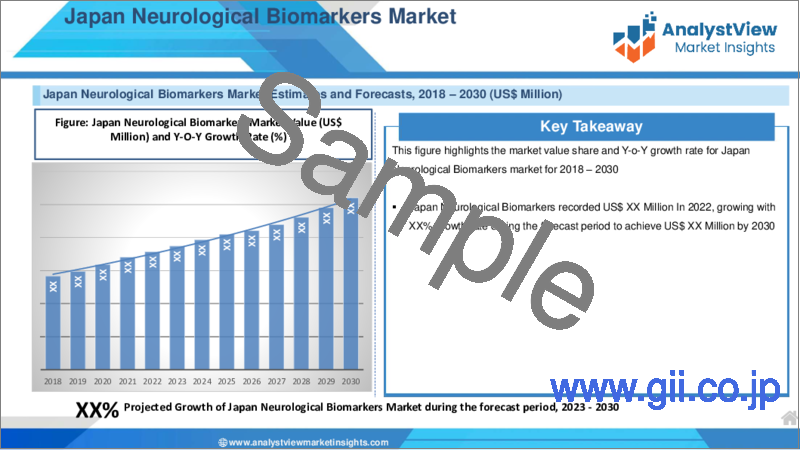
- 日本
- 韓国
- オーストラリア
- タイ
- インドネシア
- フィリピン
- その他
- ラテンアメリカ
- 概要
- ラテンアメリカの主要メーカー
- ブラジル
- メキシコ
- アルゼンチン
- コロンビア
- その他
- 中東とアフリカ
- 概要
- 中東およびアフリカの主要メーカー
- サウジアラビア
- アラブ首長国連邦
- イスラエル
- トルコ
- アルジェリア
- エジプト
- その他
第11章 主要ベンダー分析- 神経系バイオマーカー業界
- 競合ダッシュボード
- 企業プロファイル
- PERKINELMER INC.
- Abbott Laboratories
- Quanterix
- Thermo Fisher Scientific, Inc.
- Neurobio
- Banyan Biomarkers, Inc.
- Bio-Rad Laboratories, Inc.
- F. HOFFMANN-LA ROCHE LTD.
- Merck &Co., Inc.
- DiaGenic ASA
- Johnson &Johnson Services, Inc.
- Myriad Genetics, Inc.
第12章 アナリストの全方位展望
List of Tables
- TABLE List of data sources
- TABLE Market drivers; Impact Analysis
- TABLE Market restraints; Impact Analysis
- TABLE Neurological Biomarkers Market: Type Snapshot (2022)
- TABLE Segment Dashboard; Definition and Scope, by Type
- TABLE Global Neurological Biomarkers Market, by Type2018-2030 (USD Million)
- TABLE Neurological Biomarkers Market: ApplicationSnapshot (2022)
- TABLE Segment Dashboard; Definition and Scope, by Application
- TABLE Global Neurological Biomarkers Market, by Application2018-2030 (USD Million)
- TABLE Neurological Biomarkers Market: End-use Snapshot (2022)
- TABLE Segment Dashboard; Definition and Scope, by End-use
- TABLE Global Neurological Biomarkers Market, by End-use 2018-2030 (USD Million)
- TABLE Neurological Biomarkers Market: Regional snapshot (2022)
- TABLE Segment Dashboard; Definition and Scope, by Region
- TABLE Global Neurological Biomarkers Market, by Region 2018-2030 (USD Million)
- TABLE North America Neurological Biomarkers Market, by Country, 2018-2030 (USD Million)
- TABLE North America Neurological Biomarkers Market, by Type, 2018-2030 (USD Million)
- TABLE North America Neurological Biomarkers Market, by Application, 2018-2030 (USD Million)
- TABLE North America Neurological Biomarkers Market, by End-use, 2018-2030 (USD Million)
- TABLE Europe Neurological Biomarkers Market, by Country, 2018-2030 (USD Million)
- TABLE Europe Neurological Biomarkers Market, by Type, 2018-2030 (USD Million)
- TABLE EuropeNeurological Biomarkers Market, by Application, 2018-2030 (USD Million)
- TABLE Europe Neurological Biomarkers Market, by End-use, 2018-2030 (USD Million)
- TABLE Asia Pacific Neurological Biomarkers Market, by Country, 2018-2030 (USD Million)
- TABLE Asia Pacific Neurological Biomarkers Market, by Type, 2018-2030 (USD Million)
- TABLE Asia Pacific Neurological Biomarkers Market, by Application, 2018-2030 (USD Million)
- TABLE Asia Pacific Neurological Biomarkers Market, by End-use, 2018-2030 (USD Million)
- TABLE Latin America Neurological Biomarkers Market, by Country, 2018-2030 (USD Million)
- TABLE Latin America Neurological Biomarkers Market, by Type, 2018-2030 (USD Million)
- TABLE Latin America Neurological Biomarkers Market, by Application, 2018-2030 (USD Million)
- TABLE Latin America Neurological Biomarkers Market, by End-use, 2018-2030 (USD Million)
- TABLE Middle East and Africa Neurological Biomarkers Market, by Country, 2018-2030 (USD Million)
- TABLE Middle East and Africa Neurological Biomarkers Market, by Type, 2018-2030 (USD Million)
- TABLE Middle East and Africa Neurological Biomarkers Market, by Application, 2018-2030 (USD Million)
- TABLE Middle East and Africa Neurological Biomarkers Market, by End-use, 2018-2030 (USD Million)
REPORT HIGHLIGHT
Neurological biomarkers market size was valued at USD 5,607.9 Million in 2022, expanding at a CAGR of 15.8% from 2023 to 2030.
Neurological biomarkers are the biomarkers used for calculating and evaluating a symptom or method for obtaining a pharmacological response to a particular treatment. Additionally, they are extensively used for the identification of various diseases, such as autism, Parkinson's disease, and depression. Moreover, the general types of neurological biomarkers are metabolomics imaging, genomics, and proteomics.
Neurological Biomarkers Market- Market Dynamics:
- Increasing Technological Advancements and Increasing Development of Precision Medicine.
- Increasing advancements in biomarkers, including biomarker signatures, make neurological diseases more treatable. As a result, in faster drug development, early diagnosis, and noninvasive testing. In addition, digital biomarkers provide various pharmaceutical companies as well as supplemental information to conclude the decisions for clinical trials. This, in turn, such factors fuel the market growth of neurological biomarkers. Moreover, in personalized medicine, biomarker research in neurodegenerative disease is a large advancing area. Various molecules have been associated and assessed with varied neurodegenerative disorders. Thus, the biopharmaceutical industry is impacted by the evolution of precision medicine. From biopharma to diagnostics companies' different players with several functions, including commercial operations to research and development will observe a huge change. This is attributed to positively impacting the market growth. However, protracted biomarker development cycles and high startup costs are expected to restrain market growth. Furthermore, the wide presence of organizations offering funds at numerous stages of research is expected to provide a great opportunity for market expansion. To support research associated with health disparities in Alzheimer's and brain aging, the National Institutes of Health (NIH) is providing additional funds, therefore this factor may fuel the market growth.
Neurological Biomarkers Market- Key Insights:
- As per the analysis shared by our research analyst, the global neurological biomarkers market is estimated to grow annually at a CAGR of around 15.8% over the forecast period (2023-2030)
- The neurological biomarkers industry is projected to grow at a significant rate due to the increasing advancements in biomarkers
- Based on type segmentation, genomic was predicted to show maximum market share in the year 2022
- Based on application segmentation, Alzheimer's disease was the leading type in 2022
- On the basis of region, North America was the leading revenue generator in 2022
Neurological Biomarkers Market- Segmentation Analysis:
- The global neurological biomarkers market is segmented on the basis of type, application, end-use, and region.
- The market is divided into four categories based on type: imaging, proteomic, genomic, metabolomic, and others. The genomic segment is likely to maintain its dominance during the forecast period. The segment provides various opportunities for the development of personalized medicines and diagnostics based on an individual's predisposition to the disease & specific genetic variations. Additionally, methods used for the identification of the presence or studying genomic biomarkers for detecting disease-associated DNA sequence variants include whole-genome association studies using Single Nucleotide Polymorphisms (SNPs), array Comparative Genomic Hybridization (CGH), whole-genome resequencing, and gene expression profiling.
- The market is divided into four categories based on application: multiple sclerosis, Alzheimer's disease, autism spectrum disorder, Parkinson's disease, and others. The Alzheimer's disease segment is expected to dominate the market. The growth is attributed to the increasing disease burden and product availability for clinical use, including imaging biomarkers-amyloid PET tracers for diagnosis. Moreover, non-profit and government organizations are offering a plethora of research opportunities that may boost market growth.
- The market is divided into three categories based on end-use: research organizations, hospital & hospital laboratories, independent clinical diagnostic centers, and others. The hospital & hospital laboratories segment is likely to maintain its dominance over the forecast period due to a rise in hospitalization. Additionally, hospital facilities are enhanced by the ongoing development of healthcare infrastructure. Many blood-based biomarker assays are owned by hospitals and utilized in significant volumes. Moreover, research organizations are accounted to the grow at the fastest owing to the rising adoption of biomarkers ambulatory Surgery Centers (ASCs) and pharmaceutical companies for drug discovery & development
Neurological Biomarkers Market- Geographical Insights:
Geographically, this market is widespread into the regions of North America, Latin America, Europe, Asia Pacific, and the Middle East and Africa. These regions are further divided as per the nations bringing business.
Neurological Biomarkers Market- Competitive Landscape:
The rise in the prevalence of neurological diseases like dementia, brain tumors, migraines, epilepsy, and Alzheimer's disease is attributed to the growth of the market. Additionally, in neurological disorders, the factors such as the requirement for early diagnosis and technological advancements are contributing to market growth. Moreover, strategies adopted by market players that allow them to utilize led to the development of innovative products and enhance their supply chain. Based on this, the strategies include the launch of various products, collaboration, agreement, acquisition, and technological advancements to gain a foothold in the market. For instance, in August 2020, Enigma Biomedical Group announced signing an agreement to License Novel Neuro Imaging Biomarkers from Janssen. Additionally, these biomarkers hold great promise to offer essential new tools in the advancement of our understanding of a range of neurodegenerative diseases, including Alzheimer 's disease and other dementias.
Recent Developments:
For instance, in April 2021, Quanterix Corp. introduced a webinar with top industry professionals to discuss neurological advancements related to the ultra-sensitive measurement of pTau181, pTau217, pTau231, and other neurological biomarkers.
Key features of the study:
- This proposed research study on neurological biomarkers market provides market size (US$ million), compound annual growth rate (CAGR %) and forecast estimation (2023-2030), considering 2022 as the base year.
- The report provides the client the latest up-to-date and trending insights about the neurological biomarkers market.
- The research report elucidates potential growth opportunities across different segments/countries and explains attractive investment proposition matrix for neurological biomarkers market.
- The overall report identifies new investment opportunities, challenges faced by established players, and growth factors to sustain in the neurological biomarkers market.
- Impact of COVID-19 on neurological biomarkers market size, forecast, CAGR, and market dynamics are discussed in detail under the research scope. Detailed insight on neurological biomarkers market post-COVID will also be covered.
- In order to give the users of this report a comprehensive view on the neurological biomarkers market, we have also included competitive landscape and key innovator analysis for the neurological biomarkers market.
- The study encompasses a growth prospect mapping analysis, wherein all the industry segments are benchmarked based on their market size, growth rate and attractiveness.
- The report offers detailed company profiling featuring major market participants who will help users to understand their financial information and strategic initiatives of players operating in the neurological biomarkers market.
- In addition, the report also unveil the important acquisitions & mergers, collaborations & joint ventures, new launch, research & development, regional expansion of major participants involved in the market on global as well as regional level.
- The global neurological biomarkers market report primarily caters to various stakeholders in this industry including suppliers, investors, new entrants, distributors, and financial analysts.
SCOPE OF THE REPORT
The scope of this report covers the market by its major segments, which include as follows:
GLOBAL NEUROLOGICAL BIOMARKERS MARKET KEY PLAYERS
- PERKINELMER INC.
- Abbott Laboratories
- Quanterix
- Thermo Fisher Scientific, Inc.
- Neurobio
- Banyan Biomarkers, Inc.
- Bio-Rad Laboratories, Inc.
- F. HOFFMANN-LA ROCHE LTD.
- Merck & Co., Inc.
- DiaGenic ASA
- Johnson & Johnson Services, Inc.
- Myriad Genetics, Inc.
GLOBALNEUROLOGICAL BIOMARKERS MARKET, BY TYPE
- Imaging
- Proteomic
- Genomic
- Metabolomic
- Others
GLOBAL NEUROLOGICAL BIOMARKERS MARKET, BY APPLICATION
- Multiple Sclerosis
- Alzheimer's Disease
- Autism Spectrum Disorder
- Parkinson's Disease
- Others
GLOBAL NEUROLOGICAL BIOMARKERS MARKET, BY END-USE
- Research Organizations
- Hospital & Hospital Laboratories
- Independent Clinical Diagnostic Centers
- Others
GLOBAL NEUROLOGICAL BIOMARKERS MARKET, BY REGION
- North America
- The U.S.
- Canada
- Europe
- Germany
- France
- Italy
- Spain
- United Kingdom
- Russia
- Netherlands
- Sweden
- Poland
- Rest of Europe
- Asia Pacific
- India
- China
- South Korea
- Japan
- Australia
- Thailand
- Indonesia
- Philippines
- Rest of APAC
- Latin America
- Brazil
- Mexico
- Argentina
- Colombia
- Rest of LATAM
- The Middle East and Africa
- Saudi Arabia
- United Arab Emirates
- Israel
- Turkey
- Algeria
- Egypt
- Rest of MEA
Table of Contents
1. Neurological Biomarkers Market Overview
- 1.1. Study Scope
- 1.2. Market Estimation Years
2. Executive Summary
- 2.1. Market Snippet
- 2.1.1. Neurological Biomarkers Market Snippet by Type
- 2.1.2. Neurological Biomarkers Market Snippet by Application
- 2.1.3. Neurological Biomarkers Market Snippet by End-use
- 2.1.4. Neurological Biomarkers Market Snippet by Country
- 2.1.5. Neurological Biomarkers Market Snippet by Region
- 2.2. Competitive Insights
3. Neurological Biomarkers Key Market Trends
- 3.1. Neurological Biomarkers Market Drivers
- 3.1.1. Impact Analysis of Market Drivers
- 3.2. Neurological Biomarkers Market Restraints
- 3.2.1. Impact Analysis of Market Restraints
- 3.3. Neurological Biomarkers Market Opportunities
- 3.4. Neurological Biomarkers Market Future Trends
4. Neurological Biomarkers Industry Study
- 4.1. PEST Analysis
- 4.2. Porter's Five Forces Analysis
- 4.3. Growth Prospect Mapping
- 4.4. Regulatory Framework Analysis
5. Neurological Biomarkers Market: COVID-19 Impact Analysis
- 5.1. Pre-COVID-19 Impact Analysis
- 5.2. Post-COVID-19 Impact Analysis
- 5.2.1. Top Performing Segments
- 5.2.2. Marginal Growth Segments
- 5.2.3. Top Looser Segments
- 5.2.4. Marginal Loss Segments
6. Neurological Biomarkers Market Landscape
- 6.1. Neurological Biomarkers Market Share Analysis, 2022
- 6.2. Breakdown Data, by Key Manufacturer
- 6.2.1. Established Players' Analysis
- 6.2.2. Emerging Players' Analysis
7. Neurological Biomarkers Market - By Type
- 7.1. Overview
- 7.1.1. Segment Share Analysis, By Type, 2022&2030 (%)
- 7.1.2. Imaging
- 7.1.3. Proteomic
- 7.1.4. Genomic
- 7.1.5. Metabolomic
- 7.1.6. Others
8. Neurological Biomarkers Market - By Application
- 8.1. Overview
- 8.1.1. Segment Share Analysis, By Application, 2022&2030 (%)
- 8.1.2. Multiple Sclerosis
- 8.1.3. Alzheimer's Disease
- 8.1.4. Autism Spectrum Disorder
- 8.1.5. Parkinson's Disease
- 8.1.6. Others
9. Neurological Biomarkers Market - By End-use
- 9.1. Overview
- 9.1.1. Segment Share Analysis, By End-use, 2022&2030 (%)
- 9.1.2. Research Organizations
- 9.1.3. Hospital & Hospital Laboratories
- 9.1.4. Independent Clinical Diagnostic Centers
- 9.1.5. Others
10. Neurological Biomarkers Market- By Geography
- 10.1. Introduction
- 10.1.1. Segment Share Analysis, By Geography, 2022&2030 (%)
- 10.2. North America
- 10.2.1. Overview
- 10.2.2. Neurological Biomarkers Key Manufacturers in North America
- 10.2.3. North America Market Size and Forecast, By Country, 2018 - 2030 (US$ Million)
- 10.2.4. North America Market Size and Forecast, By Type, 2018 - 2030 (US$ Million)
- 10.2.5. North America Market Size and Forecast, By Application, 2018 - 2030 (US$ Million)
- 10.2.6. North America Market Size and Forecast, By End-use, 2018 - 2030 (US$ Million)
- 10.2.7. U.S.
- 10.2.7.1. Overview
- 10.2.7.2. Market Analysis, Forecast, and Y-O-Y Growth Rate, 2018 - 2030, (US$ Million)
- 10.2.7.3. U.S. Market Size and Forecast, By Type, 2018 - 2030 (US$ Million)
- 10.2.7.4. U.S. Market Size and Forecast, By Application, 2018 - 2030 (US$ Million)
- 10.2.7.5. U.S. Market Size and Forecast, By End-use, 2018 - 2030 (US$ Million)
- 10.2.8. Canada
- 10.2.8.1. Overview
- 10.2.8.2. Market Analysis, Forecast, and Y-O-Y Growth Rate, 2018 - 2030, (US$ Million)
- 10.2.8.3. Canada Market Size and Forecast, By Type, 2018 - 2030 (US$ Million)
- 10.2.8.4. Canada Market Size and Forecast, By Application, 2018 - 2030 (US$ Million)
- 10.2.8.5. Canada Market Size and Forecast, By End-use, 2018 - 2030 (US$ Million)
- 10.3. Europe
- 10.3.1. Overview
- 10.3.2. Neurological Biomarkers Key Manufacturers in Europe
- 10.3.3. Europe Market Size and Forecast, By Country, 2018 - 2030 (US$ Million)
- 10.3.4. Europe Market Size and Forecast, By Type, 2018 - 2030 (US$ Million)
- 10.3.5. Europe Market Size and Forecast, By Application, 2018 - 2030 (US$ Million)
- 10.3.6. Europe Market Size and Forecast, By End-use, 2018 - 2030 (US$ Million)
- 10.3.7. Germany
- 10.3.7.1. Overview
- 10.3.7.2. Market Analysis, Forecast, and Y-O-Y Growth Rate, 2018 - 2030, (US$ Million)
- 10.3.7.3. Germany Market Size and Forecast, By Type, 2018 - 2030 (US$ Million)
- 10.3.7.4. Germany Market Size and Forecast, By Application, 2018 - 2030 (US$ Million)
- 10.3.7.5. Germany Market Size and Forecast, By End-use, 2018 - 2030 (US$ Million)
- 10.3.8. Italy
- 10.3.8.1. Overview
- 10.3.8.2. Market Analysis, Forecast, and Y-O-Y Growth Rate, 2018 - 2030, (US$ Million)
- 10.3.8.3. Italy Market Size and Forecast, By Type, 2018 - 2030 (US$ Million)
- 10.3.8.4. Italy Market Size and Forecast, By Application, 2018 - 2030 (US$ Million)
- 10.3.8.5. Italy Market Size and Forecast, By End-use, 2018 - 2030 (US$ Million)
- 10.3.9. United Kingdom
- 10.3.9.1. Overview
- 10.3.9.2. Market Analysis, Forecast, and Y-O-Y Growth Rate, 2018 - 2030, (US$ Million)
- 10.3.9.3. United Kingdom Market Size and Forecast, By Type, 2018 - 2030 (US$ Million)
- 10.3.9.4. United Kingdom Market Size and Forecast, By Application, 2018 - 2030 (US$ Million)
- 10.3.9.5. United Kingdom Market Size and Forecast, By End-use, 2018 - 2030 (US$ Million)
- 10.3.10. France
- 10.3.10.1. Overview
- 10.3.10.2. Market Analysis, Forecast, and Y-O-Y Growth Rate, 2018 - 2030, (US$ Million)
- 10.3.10.3. France Market Size and Forecast, By Type, 2018 - 2030 (US$ Million)
- 10.3.10.4. France Market Size and Forecast, By Application, 2018 - 2030 (US$ Million)
- 10.3.10.5. France Market Size and Forecast, By End-use, 2018 - 2030 (US$ Million)
- 10.3.11. Russia
- 10.3.11.1. Market Analysis, Forecast, and Y-O-Y Growth Rate, 2018 - 2030, (US$ Million)
- 10.3.11.2. Russia Market Size and Forecast, By Type, 2018 - 2030 (US$ Million)
- 10.3.11.3. Russia Market Size and Forecast, By Application, 2018 - 2030 (US$ Million)
- 10.3.11.4. Russia Market Size and Forecast, By End-use, 2018 - 2030 (US$ Million)
- 10.3.12. Netherlands
- 10.3.12.1. Market Analysis, Forecast, and Y-O-Y Growth Rate, 2018 - 2030, (US$ Million)
- 10.3.12.2. Netherlands Market Size and Forecast, By Type, 2018 - 2030 (US$ Million)
- 10.3.12.3. Netherlands Market Size and Forecast, By Application, 2018 - 2030 (US$ Million)
- 10.3.12.4. Netherlands Market Size and Forecast, By End-use, 2018 - 2030 (US$ Million)
- 10.3.13. Sweden
- 10.3.13.1. Market Analysis, Forecast, and Y-O-Y Growth Rate, 2018 - 2030, (US$ Million)
- 10.3.13.2. Sweden Market Size and Forecast, By Type, 2018 - 2030 (US$ Million)
- 10.3.13.3. Sweden Market Size and Forecast, By Application, 2018 - 2030 (US$ Million)
- 10.3.13.4. Sweden Market Size and Forecast, By End-use, 2018 - 2030 (US$ Million)
- 10.3.14. Poland
- 10.3.14.1. Market Analysis, Forecast, and Y-O-Y Growth Rate, 2018 - 2030, (US$ Million)
- 10.3.14.2. Poland Market Size and Forecast, By Type, 2018 - 2030 (US$ Million)
- 10.3.14.3. Poland Market Size and Forecast, By Application, 2018 - 2030 (US$ Million)
- 10.3.14.4. Poland Market Size and Forecast, By End-use, 2018 - 2030 (US$ Million)
- 10.3.15. Rest of Europe
- 10.3.15.1. Overview
- 10.3.15.2. Market Analysis, Forecast, and Y-O-Y Growth Rate, 2018 - 2030, (US$ Million)
- 10.3.15.3. Rest of the Europe Market Size and Forecast, By Type, 2018 - 2030 (US$ Million)
- 10.3.15.4. Rest of the Europe Market Size and Forecast, By Application, 2018 - 2030 (US$ Million)
- 10.3.15.5. Rest of the Europe Market Size and Forecast, By End-use, 2018 - 2030 (US$ Million)
- 10.4. Asia Pacific (APAC)
- 10.4.1. Overview
- 10.4.2. Neurological Biomarkers Key Manufacturers in Asia Pacific
- 10.4.3. Asia Pacific Market Size and Forecast, By Country, 2018 - 2030 (US$ Million)
- 10.4.4. Asia Pacific Market Size and Forecast, By Type, 2018 - 2030 (US$ Million)
- 10.4.5. Asia Pacific Market Size and Forecast, By Application, 2018 - 2030 (US$ Million)
- 10.4.6. Asia Pacific Market Size and Forecast, By End-use, 2018 - 2030 (US$ Million)
- 10.4.7. India
- 10.4.7.1. Overview
- 10.4.7.2. Market Analysis, Forecast, and Y-O-Y Growth Rate, 2018 - 2030, (US$ Million)
- 10.4.7.3. India Market Size and Forecast, By Type, 2018 - 2030 (US$ Million)
- 10.4.7.4. India Market Size and Forecast, By Application, 2018 - 2030 (US$ Million)
- 10.4.7.5. India Market Size and Forecast, By End-use, 2018 - 2030 (US$ Million)
- 10.4.8. China
- 10.4.8.1. Overview
- 10.4.8.2. Market Analysis, Forecast, and Y-O-Y Growth Rate, 2018 - 2030, (US$ Million)
- 10.4.8.3. China Market Size and Forecast, By Type, 2018 - 2030 (US$ Million)
- 10.4.8.4. China Market Size and Forecast, By Application, 2018 - 2030 (US$ Million)
- 10.4.8.5. China Market Size and Forecast, By End-use, 2018 - 2030 (US$ Million)
- 10.4.9. Japan
- 10.4.9.1. Overview
- 10.4.9.2. Market Analysis, Forecast, and Y-O-Y Growth Rate, 2018 - 2030, (US$ Million)
- 10.4.9.3. Japan Market Size and Forecast, By Type, 2018 - 2030 (US$ Million)
- 10.4.9.4. Japan Market Size and Forecast, By Application, 2018 - 2030 (US$ Million)
- 10.4.9.5. Japan Market Size and Forecast, By End-use, 2018 - 2030 (US$ Million)
- 10.4.10. South Korea
- 10.4.10.1. Overview
- 10.4.10.2. Market Analysis, Forecast, and Y-O-Y Growth Rate, 2018 - 2030, (US$ Million)
- 10.4.10.3. South Korea Market Size and Forecast, By Type, 2018 - 2030 (US$ Million)
- 10.4.10.4. South Korea Market Size and Forecast, By Application, 2018 - 2030 (US$ Million)
- 10.4.10.5. South Korea Market Size and Forecast, By End-use, 2018 - 2030 (US$ Million)
- 10.4.11. Australia
- 10.4.11.1. Overview
- 10.4.11.2. Market Analysis, Forecast, and Y-O-Y Growth Rate, 2018 - 2030, (US$ Million)
- 10.4.11.3. Australia Market Size and Forecast, By Type, 2018 - 2030 (US$ Million)
- 10.4.11.4. Australia Market Size and Forecast, By Application, 2018 - 2030 (US$ Million)
- 10.4.11.5. Australia Market Size and Forecast, By End-use, 2018 - 2030 (US$ Million)
- 10.4.12. Thailand
- 10.4.12.1. Overview
- 10.4.12.2. Market Analysis, Forecast, and Y-O-Y Growth Rate, 2018 - 2030, (US$ Million)
- 10.4.12.3. Thailand Market Size and Forecast, By Type, 2018 - 2030 (US$ Million)
- 10.4.12.4. Thailand Market Size and Forecast, By Application, 2018 - 2030 (US$ Million)
- 10.4.12.5. Thailand Market Size and Forecast, By End-use, 2018 - 2030 (US$ Million)
- 10.4.13. Indonesia
- 10.4.13.1. Overview
- 10.4.13.2. Market Analysis, Forecast, and Y-O-Y Growth Rate, 2018 - 2030, (US$ Million)
- 10.4.13.3. Indonesia Market Size and Forecast, By Type, 2018 - 2030 (US$ Million)
- 10.4.13.4. Indonesia Market Size and Forecast, By Application, 2018 - 2030 (US$ Million)
- 10.4.13.5. Indonesia Market Size and Forecast, By End-use, 2018 - 2030 (US$ Million)
- 10.4.14. Philippines
- 10.4.14.1. Overview
- 10.4.14.2. Market Analysis, Forecast, and Y-O-Y Growth Rate, 2018 - 2030, (US$ Million)
- 10.4.14.3. Philippines Market Size and Forecast, By Type, 2018 - 2030 (US$ Million)
- 10.4.14.4. Philippines Market Size and Forecast, By Application, 2018 - 2030 (US$ Million)
- 10.4.14.5. Philippines Market Size and Forecast, By End-use, 2018 - 2030 (US$ Million)
- 10.4.15. Rest of APAC
- 10.4.15.1. Overview
- 10.4.15.2. Market Analysis, Forecast, and Y-O-Y Growth Rate, 2018 - 2030, (US$ Million)
- 10.4.15.3. Rest of APAC Market Size and Forecast, By Type, 2018 - 2030 (US$ Million)
- 10.4.15.4. Rest of APAC Market Size and Forecast, By Application, 2018 - 2030 (US$ Million)
- 10.4.15.5. Rest of APAC Market Size and Forecast, By End-use, 2018 - 2030 (US$ Million)
- 10.5. Latin America
- 10.5.1. Overview
- 10.5.2. Neurological Biomarkers Key Manufacturers in Latin America
- 10.5.3. Latin America Market Size and Forecast, By Country, 2018 - 2030 (US$ Million)
- 10.5.4. Latin America Market Size and Forecast, By Type, 2018 - 2030 (US$ Million)
- 10.5.5. Latin America Market Size and Forecast, By Application, 2018 - 2030 (US$ Million)
- 10.5.6. Latin America Market Size and Forecast, By End-use, 2018 - 2030 (US$ Million)
- 10.5.7. Brazil
- 10.5.7.1. Overview
- 10.5.7.2. Market Analysis, Forecast, and Y-O-Y Growth Rate, 2018 - 2030, (US$ Million)
- 10.5.7.3. Brazil Market Size and Forecast, By Type, 2018 - 2030 (US$ Million)
- 10.5.7.4. Brazil Market Size and Forecast, By Application, 2018 - 2030 (US$ Million)
- 10.5.7.5. Brazil Market Size and Forecast, By End-use, 2018 - 2030 (US$ Million)
- 10.5.8. Mexico
- 10.5.8.1. Overview
- 10.5.8.2. Market Analysis, Forecast, and Y-O-Y Growth Rate, 2018 - 2030, (US$ Million)
- 10.5.8.3. Mexico Market Size and Forecast, By Type, 2018 - 2030 (US$ Million)
- 10.5.8.4. Mexico Market Size and Forecast, By Application, 2018 - 2030 (US$ Million)
- 10.5.8.5. Mexico Market Size and Forecast, By End-use, 2018 - 2030 (US$ Million)
- 10.5.9. Argentina
- 10.5.9.1. Overview
- 10.5.9.2. Market Analysis, Forecast, and Y-O-Y Growth Rate, 2018 - 2030, (US$ Million)
- 10.5.9.3. Argentina Market Size and Forecast, By Type, 2018 - 2030 (US$ Million)
- 10.5.9.4. Argentina Market Size and Forecast, By Application, 2018 - 2030 (US$ Million)
- 10.5.9.5. Argentina Market Size and Forecast, By End-use, 2018 - 2030 (US$ Million)
- 10.5.10. Colombia
- 10.5.10.1. Overview
- 10.5.10.2. Market Analysis, Forecast, and Y-O-Y Growth Rate, 2018 - 2030, (US$ Million)
- 10.5.10.3. Colombia Market Size and Forecast, By Type, 2018 - 2030 (US$ Million)
- 10.5.10.4. Colombia Market Size and Forecast, By Application, 2018 - 2030 (US$ Million)
- 10.5.10.5. Colombia Market Size and Forecast, By End-use, 2018 - 2030 (US$ Million)
- 10.5.11. Rest of LATAM
- 10.5.11.1. Overview
- 10.5.11.2. Market Analysis, Forecast, and Y-O-Y Growth Rate, 2018 - 2030, (US$ Million)
- 10.5.11.3. Rest of LATAM Market Size and Forecast, By Type, 2018 - 2030 (US$ Million)
- 10.5.11.4. Rest of LATAM Market Size and Forecast, By Application, 2018 - 2030 (US$ Million)
- 10.5.11.5. Rest of LATAM Market Size and Forecast, By End-use, 2018 - 2030 (US$ Million)
- 10.6. Middle East and Africa
- 10.6.1. Overview
- 10.6.2. Neurological Biomarkers Key Manufacturers in Middle East and Africa
- 10.6.3. Middle East and Africa Market Size and Forecast, By Country, 2018 - 2030 (US$ Million)
- 10.6.4. Middle East and Africa Market Size and Forecast, By Type, 2018 - 2030 (US$ Million)
- 10.6.5. Middle East and Africa Market Size and Forecast, By Application, 2018 - 2030 (US$ Million)
- 10.6.6. Middle East and Africa Market Size and Forecast, By End-use, 2018 - 2030 (US$ Million)
- 10.6.7. Saudi Arabia
- 10.6.7.1. Overview
- 10.6.7.2. Market Analysis, Forecast, and Y-O-Y Growth Rate, 2018 - 2030, (US$ Million)
- 10.6.7.3. Saudi Arabia Market Size and Forecast, By Type, 2018 - 2030 (US$ Million)
- 10.6.7.4. Saudi Arabia Market Size and Forecast, By Application, 2018 - 2030 (US$ Million)
- 10.6.7.5. Saudi Arabia Market Size and Forecast, By End-use, 2018 - 2030 (US$ Million)
- 10.6.8. United Arab Emirates
- 10.6.8.1. Overview
- 10.6.8.2. Market Analysis, Forecast, and Y-O-Y Growth Rate, 2018 - 2030, (US$ Million)
- 10.6.8.3. United Arab Emirates Market Size and Forecast, By Type, 2018 - 2030 (US$ Million)
- 10.6.8.4. United Arab Emirates Market Size and Forecast, By Application, 2018 - 2030 (US$ Million)
- 10.6.8.5. United Arab Emirates Market Size and Forecast, By End-use, 2018 - 2030 (US$ Million)
- 10.6.9. Israel
- 10.6.9.1. Overview
- 10.6.9.2. Market Analysis, Forecast, and Y-O-Y Growth Rate, 2018 - 2030, (US$ Million)
- 10.6.9.3. Israel Market Size and Forecast, By Type, 2018 - 2030 (US$ Million)
- 10.6.9.4. Israel Market Size and Forecast, By Application, 2018 - 2030 (US$ Million)
- 10.6.9.5. Israel Market Size and Forecast, By End-use, 2018 - 2030 (US$ Million)
- 10.6.10. Turkey
- 10.6.10.1. Overview
- 10.6.10.2. Market Analysis, Forecast, and Y-O-Y Growth Rate, 2018 - 2030, (US$ Million)
- 10.6.10.3. Turkey Market Size and Forecast, By Type, 2018 - 2030 (US$ Million)
- 10.6.10.4. Turkey Market Size and Forecast, By Application, 2018 - 2030 (US$ Million)
- 10.6.10.5. Turkey Market Size and Forecast, By End-use, 2018 - 2030 (US$ Million)
- 10.6.11. Algeria
- 10.6.11.1. Overview
- 10.6.11.2. Market Analysis, Forecast, and Y-O-Y Growth Rate, 2018 - 2030, (US$ Million)
- 10.6.11.3. Algeria Market Size and Forecast, By Type, 2018 - 2030 (US$ Million)
- 10.6.11.4. Algeria Market Size and Forecast, By Application, 2018 - 2030 (US$ Million)
- 10.6.11.5. Algeria Market Size and Forecast, By End-use, 2018 - 2030 (US$ Million)
- 10.6.12. Egypt
- 10.6.12.1. Overview
- 10.6.12.2. Market Analysis, Forecast, and Y-O-Y Growth Rate, 2018 - 2030, (US$ Million)
- 10.6.12.3. Egypt Market Size and Forecast, By Type, 2018 - 2030 (US$ Million)
- 10.6.12.4. Egypt Market Size and Forecast, By Application, 2018 - 2030 (US$ Million)
- 10.6.12.5. Egypt Market Size and Forecast, By End-use, 2018 - 2030 (US$ Million)
- 10.6.13. Rest of MEA
- 10.6.13.1. Overview
- 10.6.13.2. Market Analysis, Forecast, and Y-O-Y Growth Rate, 2018 - 2030, (US$ Million)
- 10.6.13.3. Rest of MEA Market Size and Forecast, By Type, 2018 - 2030 (US$ Million)
- 10.6.13.4. Rest of MEA Market Size and Forecast, By Application, 2018 - 2030 (US$ Million)
- 10.6.13.5. Rest of MEA Market Size and Forecast, By End-use, 2018 - 2030 (US$ Million)
11. Key Vendor Analysis- Neurological Biomarkers Industry
- 11.1. Competitive Dashboard
- 11.2. Company Profiles
- 11.2.1. PERKINELMER INC.
- 11.2.2. Abbott Laboratories
- 11.2.3. Quanterix
- 11.2.4. Thermo Fisher Scientific, Inc.
- 11.2.5. Neurobio
- 11.2.6. Banyan Biomarkers, Inc.
- 11.2.7. Bio-Rad Laboratories, Inc.
- 11.2.8. F. HOFFMANN-LA ROCHE LTD.
- 11.2.9. Merck & Co., Inc.
- 11.2.10. DiaGenic ASA
- 11.2.11. Johnson & Johnson Services, Inc.
- 11.2.12. Myriad Genetics, Inc.
12. 360 Degree Analyst View
13. Appendix
- 13.1. Research Methodology
- 13.2. References
- 13.3. Abbreviations
- 13.4. Disclaimer
- 13.5. Contact Us