|
|
市場調査レポート
商品コード
1299737
3Dバイオプリンティング市場:コンポーネント別、技術別、材料別、用途別、国別、地域別- 産業分析、市場規模、市場シェア、2023-2030年予測3D Bioprinting Market with COVID-19 Impact Analysis, By Components, BY Technology, By Material, By Application, By Country, and By Region - Industry Analysis, Market Size, Market Share & Forecast from 2023-2030 |
||||||
|
|
|||||||
|
● お客様のご希望に応じて、既存データの加工や未掲載情報(例:国別セグメント)の追加などの対応が可能です。 詳細はお問い合わせください。 |
|||||||


| 3Dバイオプリンティング市場:コンポーネント別、技術別、材料別、用途別、国別、地域別- 産業分析、市場規模、市場シェア、2023-2030年予測 |
|
出版日: 2023年07月01日
発行: AnalystView Market Insights
ページ情報: 英文 322 Pages
納期: 2~3営業日
|
- 全表示
- 概要
- 図表
- 目次
レポートのハイライト
3Dバイオプリンティング市場規模は2022年に23億5,290万米ドルとなり、2023年から2030年にかけてCAGR 20.1%で拡大
3Dバイオプリンティング市場-市場力学:
3Dバイオプリンティングでは、技術の進歩により、肝臓モデリング、表皮層成長骨、がん治療、組織生産が可能になります。さらに、この分野の進歩により、臨床試験や薬物スクリーニングに使用される3Dバイオプリンターは、動物実験の必要性をわずかに減らしています。その結果、3Dバイオプリンティング市場の需要が拡大すると予測されています。しかし、3Dバイオプリンター業界における熟練した専門家の不足が、予測期間中の市場成長を妨げる可能性があります。
さらに、3Dバイオプリンティングは、臓器移植に適した組織や臓器の要件に対処するのに役立つ材料、再生医療、生体適合細胞の製造に応用されています。これは市場成長を促進すると予想されます。COVID-19パンデミックは、世界の3Dバイオプリンティング市場に影響を与えました。この市場は、様々な製薬会社やバイオ製薬会社が、医師、研究者、医療専門家をあらゆる方法でサポートするために乗り出しているため、巨大な需要が発生しています。
3Dバイオプリンティング市場-セグメンテーション分析:
世界の3Dバイオプリンティング市場は、コンポーネント、技術、材料、用途、地域に基づいてセグメント化されます。
市場はコンポーネントに基づいて2つのカテゴリーに分けられる:3Dバイオプリンターとバイオインクです。3Dバイオプリンター分野は優位性を維持する可能性が高いです。商業レベルでの3Dバイオプリンティングには、スケールアップ手順と迅速な製造手順が必要です。
市場は技術によって磁気浮上式、インクジェット式、シリンジ式、レーザー式、その他の4つのカテゴリーに分けられます。インクジェットベースの分野が最大の市場シェアを占めると予想されます。ヘルスケア分野でインクジェットベースの印刷が世界的に求められていることが、同分野の成長を後押しする大きな要因となっています。
同市場は、材料に基づいて研究用途と臨床用途の2つに分類されます。市場を独占すると予想されるのは臨床用途分野です。慢性疾患の治療に医療用錠剤が大量に使用されていることが、同分野の成長を促しています。
市場は用途によって、研究機関・ホスピタリティ、バイオ製薬会社、病院の3つに分類されます。バイオ製薬会社セクターが市場を占有する可能性が高いです。バイオ医薬品に対する需要の増加と、この技術でバイオ医薬品を効率的に使用することが、この分野の市場需要を牽引する可能性が高いです。
3Dバイオプリンティング市場-競合情勢:
老年人口の増加と歯科疾患の発生率の上昇が、3Dプリンティング市場の需要を急増させる要因となっています。さらに、主要企業は研究開発投資を増加させており、急速な技術進歩、消費者の意識の高まりが3Dプリンターの販売に現れています。市場プレーヤーはまた、世界の市場での足掛かりを得るために、コラボレーション、新製品の発売、M&A、パートナーシップに注力しています。例えば、2022年3月、CELLINK, A BICO Company社は、3D細胞培養を自動化する初のバイオディスペンシングプラットフォームであるBIO CELLXを発売しました。
研究の主な特徴
この調査レポートは、3Dバイオプリンティング市場の市場規模、年間平均成長率(CAGR %)、2022年を基準年とした推定・予測(2023-2030年)を提供しています。
調査レポートは、さまざまなセグメント/国にわたる潜在的な成長機会を解明し、3Dバイオプリンティング市場の魅力的な投資提案マトリクスを解説しています。
全体的なレポートでは、新たな投資機会、既存企業が直面する課題、3Dバイオプリンティング市場で持続するための成長要因を特定しています。
3Dバイオプリンティング市場規模、予測、CAGR、市場力学に対するCOVID-19の影響は、調査範囲の下で詳細に議論されています。COVID後の3Dバイオプリンティング市場に関する詳細な洞察もカバーします。
本レポートのユーザーに3Dバイオプリンティング市場の包括的な見解を提供するために、3Dバイオプリンティング市場の競合情勢と主要イノベーター分析も含めています。
本レポートでは、市場規模、成長率、魅力度に基づいてすべての業界セグメントをベンチマークした成長展望マッピング分析を掲載しています。
主要市場参入企業の詳細な企業プロファイルを掲載しており、3Dバイオプリンティング市場で事業を展開する企業の財務情報や戦略的イニシアチブを理解するのに役立ちます。
さらに、同レポートは、世界レベルだけでなく地域レベルでも、市場に関わる主要参入企業の重要な買収&合併、提携&ジョイントベンチャー、新発売、研究開発、地域展開も明らかにしています。
世界の3Dバイオプリンティング市場レポートは主に、サプライヤー、投資家、新規参入者、流通業者、金融アナリストなど、この業界のさまざまな利害関係者に対応しています。
目次
第1章 3Dバイオプリンティング市場概要
- 調査範囲
第2章 エグゼクティブサマリー
- 市場内訳
- 競合考察
第3章 3Dバイオプリンティングの主要な市場動向
- 3Dバイオプリンティング市場促進要因
- 3Dバイオプリンティング市場抑制要因
- 3Dバイオプリンティング市場機会
- 3Dバイオプリンティング市場の今後の動向
第4章 3Dバイオプリンティング産業の調査
- PEST分析
- ポーターのファイブフォース分析
- 成長見通しのマッピング
- 規制枠組みの分析
第5章 3Dバイオプリンティング市場:COVID-19の影響分析
- 新型コロナウイルス感染症以前の影響分析
- 新型コロナウイルス感染症後の影響分析
第6章 3Dバイオプリンティング市場情勢
- 3Dバイオプリンティング市場シェア分析、2022年
- 主要メーカー別の内訳データ
- 確立された企業の分析
- 新興企業の分析
第7章 3Dバイオプリンティング市場- コンポーネント別
- 概要
- コンポーネント別のセグメントシェア分析
- 3Dバイオプリンター
- バイオインク
第8章 3Dバイオプリンティング市場- 技術別
- 概要
- 技術別セグメントシェア分析
- 磁気浮上
- インクジェットベース
- シリンジベース
- レーザーベース
- その他
第9章 3Dバイオプリンティング市場- 材料別
- 概要
- 材料別のセグメントシェア分析
- 調査用途
- 臨床応用
第10章 3Dバイオプリンティング市場- 用途別
- 概要
- 用途別のセグメントシェア分析
- 調査機関および学術機関
- バイオ医薬品企業
- 病院
第11章 3Dバイオプリンティング市場-地域別
- イントロダクション
- 北米
- 概要
- 北米の3Dバイオプリンティングの主要メーカー
- 米国
- カナダ
- 欧州
- 概要
- 欧州の3Dバイオプリンティングの主要メーカー
- ドイツ
- イタリア
- 英国
- フランス
- ロシア
- オランダ
- スウェーデン
- ポーランド
- その他
- アジア太平洋(APAC)
- 概要
- アジア太平洋地域の3Dバイオプリンティングの主要メーカー
- インド
- 中国
- 日本
- 韓国
- オーストラリア
- タイ
- インドネシア
- フィリピン
- その他
- ラテンアメリカ
- 概要
- ラテンアメリカの3Dバイオプリンティングの主要メーカー
- ブラジル
- メキシコ
- アルゼンチン
- コロンビア
- その他
- 中東とアフリカ
- 概要
- 中東およびアフリカの3Dバイオプリンティングの主要メーカー
- サウジアラビア
- アラブ首長国連邦
- イスラエル
- トルコ
- アルジェリア
- エジプト
- その他
第12章 主要ベンダー分析-3Dバイオプリンティング業界
- 競合ダッシュボード
- 企業プロファイル
- Electro Optical Systems
- EnvisionTEC, Inc.
- Rokit Healthcare, inc.
- Formlabs, Inc.
- GE Healthcare
- Inventia Life Science PTY LTD
- Optomec Inc.
- Organovo Holdings Inc
- Pandorum Technologies pvt. ltd.
- Regenovo Biotechnology Co. Ltd.
- Poietis
- Cyfuse Biomedical KK
- Precise Bio
- Foldink Life Science Technologies
- Renishaw plc.
- Revotek co., ltd.
- Stratasys Ltd.Vivax Bio, LLC
第13章 アナリストの全方位的展望
List of Tables
- TABLE List of data sources
- TABLE Market drivers; Impact Analysis
- TABLE Market restraints; Impact Analysis
- TABLE 3D Bioprinting Market: Components Snapshot (2022)
- TABLE Segment Dashboard; Definition and Scope, by Components
- TABLE Global 3D Bioprinting Market, by Components2018-2030 (USD Million)
- TABLE 3D Bioprinting Market: TechnologySnapshot (2022)
- TABLE Segment Dashboard; Definition and Scope, by Technology
- TABLE Global 3D Bioprinting Market, by Technology2018-2030 (USD Million)
- TABLE 3D Bioprinting Market: Regional snapshot (2022)
- TABLE 3D Bioprinting Market: Material Snapshot (2022)
- TABLE Segment Dashboard; Definition and Scope, by Material
- TABLE Global 3D Bioprinting Market, by Material 2018-2030 (USD Million)
- TABLE 3D Bioprinting Market: Application Snapshot (2022)
- TABLE Segment Dashboard; Definition and Scope, by Application
- TABLE Global 3D Bioprinting Market, by Application2018-2030 (USD Million)
- TABLE Segment Dashboard; Definition and Scope, by Region
- TABLE Global 3D Bioprinting Market, by Region 2018-2030 (USD Million)
- TABLE North America 3D Bioprinting Market, by Country, 2018-2030 (USD Million)
- TABLE North America 3D Bioprinting Market, by Components, 2018-2030 (USD Million)
- TABLE North America 3D Bioprinting Market, by Technology, 2018-2030 (USD Million)
- TABLE North America 3D Bioprinting Market, by Material, 2018-2030 (USD Million)
- TABLE North America 3D Bioprinting Market, by Application, 2018-2030 (USD Million)
- TABLE Europe 3D Bioprinting Market, by Country, 2018-2030 (USD Million)
- TABLE Europe 3D Bioprinting Market, by Components, 2018-2030 (USD Million)
- TABLE Europe3D Bioprinting Market, by Technology, 2018-2030 (USD Million)
- TABLE Europe 3D Bioprinting Market, by Material, 2018-2030 (USD Million)
- TABLE Europe 3D Bioprinting Market, by Application, 2018-2030 (USD Million)
- TABLE Asia Pacific 3D Bioprinting Market, by Country, 2018-2030 (USD Million)
- TABLE Asia Pacific 3D Bioprinting Market, by Components, 2018-2030 (USD Million)
- TABLE Asia Pacific 3D Bioprinting Market, by Technology, 2018-2030 (USD Million)
- TABLE Asia Pacific 3D Bioprinting Market, by Material, 2018-2030 (USD Million)
- TABLE Asia Pacific 3D Bioprinting Market, by Application, 2018-2030 (USD Million)
- TABLE Latin America 3D Bioprinting Market, by Country, 2018-2030 (USD Million)
- TABLE Latin America 3D Bioprinting Market, by Components, 2018-2030 (USD Million)
- TABLE Latin America 3D Bioprinting Market, by Technology, 2018-2030 (USD Million)
- TABLE Latin America 3D Bioprinting Market, by Material, 2018-2030 (USD Million)
- TABLE Latin America 3D Bioprinting Market, by Application, 2018-2030 (USD Million)
- TABLE Middle East and Africa 3D Bioprinting Market, by Country, 2018-2030 (USD Million)
- TABLE Middle East and Africa 3D Bioprinting Market, by Components, 2018-2030 (USD Million)
- TABLE Middle East and Africa 3D Bioprinting Market, by Technology, 2018-2030 (USD Million)
- TABLE Middle East and Africa 3D Bioprinting Market, by Material, 2018-2030 (USD Million)
- TABLE Middle East and Africa 3D Bioprinting Market, by Application, 2018-2030 (USD Million)
List of Figures
- FIGURE 3D Bioprinting Market Segmentation
- FIGURE Market research methodology
- FIGURE Value chain analysis
- FIGURE Porter's Five Forces Analysis
- FIGURE Market Attractiveness Analysis
- FIGURE COVID-19 Impact Analysis
- FIGURE Pre & Post COVID-19 Impact Comparision Study
- FIGURE Competitive Landscape; Key company market share analysis, 2022
- FIGURE Components segment market share analysis, 2022&2030
- FIGURE Components segment market size forecast and trend analysis, 2018 to 2030 (USD Million)
- FIGURE Technology segment market share analysis, 2022&2030
- FIGURE Technology segment market size forecast and trend analysis, 2018 to 2030 (USD Million)
- FIGURE Material segment market share analysis, 2022&2030
- FIGURE Material segment market size forecast and trend analysis, 2018 to 2030 (USD Million)
- FIGURE Application segment market share analysis, 2022&2030
- FIGURE Application segment market size forecast and trend analysis, 2018 to 2030 (USD Million)
- FIGURE Regional segment market share analysis, 2022&2030
- FIGURE Regional segment market size forecast and trend analysis, 2018 to 2030 (USD Million)
- FIGURE North America 3D Bioprinting Market share and leading players, 2022
- FIGURE Europe 3D Bioprinting Market share and leading players, 2022
- FIGURE Asia Pacific 3D Bioprinting Market share and leading players, 2022
- FIGURE Latin America 3D Bioprinting Market share and leading players, 2022
- FIGURE Middle East and Africa 3D Bioprinting Market share and leading players, 2022
- FIGURE North America market share analysis by country, 2022
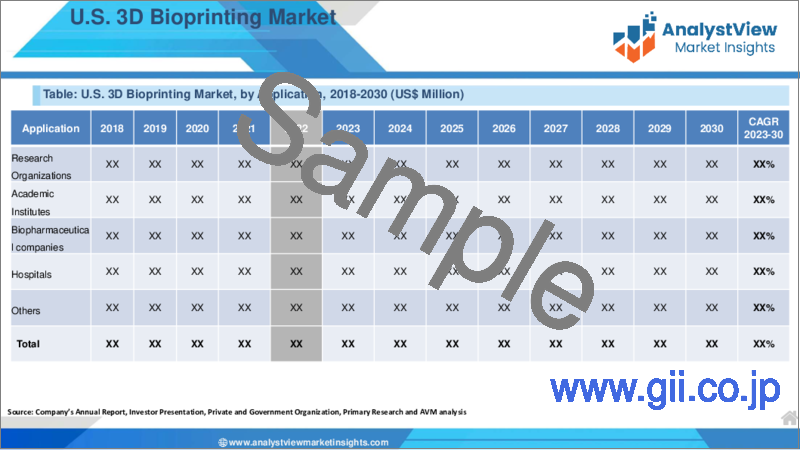
- FIGURE U.S. 3D Bioprinting Market size, forecast and trend analysis, 2018 to 2030 (USD Million)
- FIGURE Canada 3D Bioprinting Market size, forecast and trend analysis, 2018 to 2030 (USD Million)
- FIGURE Europe 3D Bioprinting Market share analysis by country, 2022
- FIGURE Germany 3D Bioprinting Market size, forecast and trend analysis, 2018 to 2030 (USD Million)
- FIGURE Spain 3D Bioprinting Market size, forecast and trend analysis, 2018 to 2030 (USD Million)
- FIGURE Italy 3D Bioprinting Market size, forecast and trend analysis, 2018 to 2030 (USD Million)
- FIGURE France 3D Bioprinting Market size, forecast and trend analysis, 2018 to 2030 (USD Million)
- FIGURE UK 3D Bioprinting Market size, forecast and trend analysis, 2018 to 2030 (USD Million)
- FIGURE Russia 3D Bioprinting Market size, forecast and trend analysis, 2018 to 2030 (USD Million)
- FIGURE Netherlands3D Bioprinting Market size, forecast and trend analysis, 2018 to 2030 (USD Million)
- FIGURE Sweden3D Bioprinting Market size, forecast and trend analysis, 2018 to 2030 (USD Million)
- FIGURE Poland3D Bioprinting Market size, forecast and trend analysis, 2018 to 2030 (USD Million)
- FIGURE Rest of the Europe 3D Bioprinting Market size, forecast and trend analysis, 2018 to 2030 (USD Million)
- FIGURE Asia Pacific 3D Bioprinting Market share analysis by country, 2022
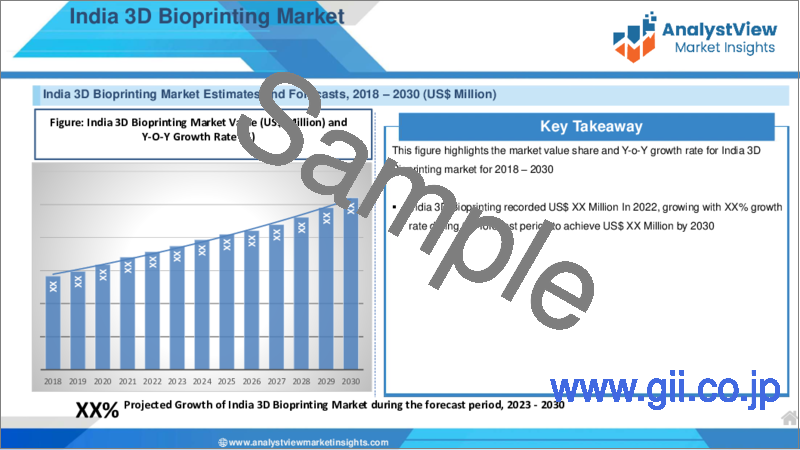
- FIGURE India 3D Bioprinting Market size, forecast and trend analysis, 2018 to 2030 (USD Million)
- FIGURE China 3D Bioprinting Market size, forecast and trend analysis, 2018 to 2030 (USD Million)
- FIGURE Japan 3D Bioprinting Market size, forecast and trend analysis, 2018 to 2030 (USD Million)
- FIGURE South Korea 3D Bioprinting Market size, forecast and trend analysis, 2018 to 2030 (USD Million)
- FIGURE Australia 3D Bioprinting Market size, forecast and trend analysis, 2018 to 2030 (USD Million)
- FIGURE Thailand 3D Bioprinting Market size, forecast and trend analysis, 2018 to 2030 (USD Million)
- FIGURE Indonesia 3D Bioprinting Market size, forecast and trend analysis, 2018 to 2030 (USD Million)
- FIGURE Phillipines 3D Bioprinting Market size, forecast and trend analysis, 2018 to 2030 (USD Million)
- FIGURE Rest of APAC 3D Bioprinting Market size, forecast and trend analysis, 2018 to 2030 (USD Million)
- FIGURE Latin America 3D Bioprinting Market size, forecast and trend analysis, 2018 to 2030 (USD Million)
- FIGURE Latin America 3D Bioprinting Market share analysis by country, 2022
- FIGURE Brazil 3D Bioprinting Market size, forecast and trend analysis, 2018 to 2030 (USD Million)
- FIGURE Mexico 3D Bioprinting Market size, forecast and trend analysis, 2018 to 2030 (USD Million)
- FIGURE Argentina 3D Bioprinting Market size, forecast and trend analysis, 2018 to 2030 (USD Million)
- FIGURE Colombia3D Bioprinting Market size, forecast and trend analysis, 2018 to 2030 (USD Million)
- FIGURE Rest of LATAM 3D Bioprinting Market size, forecast and trend analysis, 2018 to 2030 (USD Million)
- FIGURE Middle East and Africa 3D Bioprinting Market size, forecast and trend analysis, 2018 to 2030 (USD Million)
- FIGURE Middle East and Africa 3D Bioprinting Market share analysis by country, 2022
- FIGURE Saudi Arabia 3D Bioprinting Market size, forecast and trend analysis, 2018 to 2030 (USD Million)
- FIGURE United Arab Emirates 3D Bioprinting Market size, forecast and trend analysis, 2018 to 2030 (USD Million)
- FIGURE Israel 3D Bioprinting Market size, forecast and trend analysis, 2018 to 2030 (USD Million)
- FIGURE Turkey 3D Bioprinting Market size, forecast and trend analysis, 2018 to 2030 (USD Million)
- FIGURE Algeria 3D Bioprinting Market size, forecast and trend analysis, 2018 to 2030 (USD Million)
- FIGURE Egypt 3D Bioprinting Market size, forecast and trend analysis, 2018 to 2030 (USD Million)
- FIGURE Rest of MEA 3D Bioprinting Market size, forecast and trend analysis, 2018 to 2030 (USD Million)
REPORT HIGHLIGHT
3D bioprinting market size was valued at USD 2,352.9 Million in 2022, expanding at a CAGR of 20.1% from 2023 to 2030.
A 3D bioprinting used biomaterials technology and its laser printer U-FAB to create a pulmonary epithelial model. Moreover, the respiratory system is lined up with tissue known as the respiratory epithelial. In addition, this epithelial helps as a defense against various diseases. Furthermore, the primary application of 3D bioprinting is regenerative medicine includes methods to regrow, replace, and repair damaged & diseased organs, tissues, and cells.
3D Bioprinting Market- Market Dynamics:
In 3D bioprinting, technological advancements enable the production of liver modeling, epidermal layer growth bones, cancer treatments, and tissue production. Additionally, with the field advancement, 3D bioprinters used for clinical testing and drug screening slightly reduce the need for animal testing. This in turn projected to drive the market demand for the 3D bioprinting market. However, a lack of skilled professionals in the 3D bioprinters industry may hamper the market growth over the forecast period.
Moreover, 3d bioprinting has applications in the manufacturing of materials, regenerative medicine, and biocompatible cells which assist to address the requirement for tissues and organs suitable for organ transplantation. This is anticipated to propel the market growth. The COVID-19 pandemic affected the global 3D bioprinting market globally. The market is experiencing huge demand owing to various pharmaceutical and biopharmaceutical companies stepping up to support doctors, researchers, and medical professionals in every manner.
3D Bioprinting Market- Segmentation Analysis:
The global 3d bioprinting market is segmented on the basis of components, technology, material, application, and region.
The market is divided into two categories based on components: 3D bioprinters and bioinks. The 3D bioprinters sector is likely to maintain its dominance. A scale-up procedure and quicker manufacturing procedure are required for 3D bioprinting on a commercial level.
The market is divided into four categories based on technology: magnetic levitation, inkjet-based, syringe-based, laser-based, and others. The inkjet-based sector is expected to hold the largest market share. The global requirement for inkjet-based printing in the healthcare sector is a major factor that propels the segment's growth.
The market is divided into two categories based on material: research applications and clinical applications. The clinical applications sector is expected to dominate the market. The massive use of medical pills to treat chronic disease is stimulating segment growth.
The market is divided into three categories based on application: research organizations & academic institutes, biopharmaceutical companies, and hospitals. The biopharmaceutical companies sector is likely to possess the market. The increasing demand for biopharmaceuticals and the use of bio-drugs efficiently in this technology will likely drive the market demand for this segment.
3D Bioprinting Market-Competitive Landscape:
The increasing geriatric population and rising incidence of dental conditions are such factors surging the demand for the 3D printing market. Additionally, key players are increasing R&D investment, rapid technological advancements, and growing consumer awareness are witnessed in the sales of 3D printers. Market players are also focusing on collaboration, new product launches, mergers & acquisitions, and partnerships to gain a foothold in the market globally. For instance, in March 2022, CELLINK, A BICO Company launched the BIO CELLX, a first of its kind biodispensing platform to automate 3D Cell Culture.
Key features of the study:
This proposed research study on 3D bioprinting market provides market size (US$ million), compound annual growth rate (CAGR %) and forecast estimation (2023-2030), considering 2022 as the base year.
The research report elucidates potential growth opportunities across different segments/countries and explains attractive investment proposition matrix for 3D bioprinting market.
The overall report identifies new investment opportunities, challenges faced by established players, and growth factors to sustain in the 3D bioprinting market.
Impact of COVID-19 on 3D bioprinting market size, forecast, CAGR, and market dynamics are discussed in detail under the research scope. Detailed insight on 3D bioprinting market post-COVID will also be covered.
In order to give the users of this report a comprehensive view on the 3D bioprinting market, we have also included competitive landscape and key innovator analysis for the 3D bioprinting market.
The study encompasses a growth prospect mapping analysis, wherein all the industry segments are benchmarked based on their market size, growth rate and attractiveness.
The report offers detailed company profiling featuring major market participants which will help users to understand their financial information and strategic initiatives of players operating in the 3D bioprinting market.
In addition, the report also unveil the important acquisitions & mergers, collaborations & joint ventures, new launch, research & development, regional expansion of major participants involved in the market on global as well as regional level.
The global 3D bioprinting market report primarily caters to various stakeholders in this industry including suppliers, investors, new entrants, distributors, and financial analysts.
SCOPE OF THE REPORT
The scope of this report covers the market by its major segments, which include as follows:
GLOBAL 3D BIOPRINTING MARKET KEY PLAYERS
- Electro Optical Systems
- EnvisionTEC, Inc.
- Rokit Healthcare, inc.
- Formlabs, Inc.
- GE Healthcare
- Inventia Life Science PTY LTD
- Optomec Inc.
- Organovo Holdings Inc
- Pandorum Technologies pvt. ltd.
- Regenovo Biotechnology Co. Ltd.
- Poietis
- Cyfuse Biomedical K.K.
- Precise Bio
- Foldink Life Science Technologies
- Renishaw plc.
- Revotek co., ltd.
- Stratasys Ltd.Vivax Bio, LLC
GLOBAL3D BIOPRINTING MARKET, BY COMPONENTS
- 3D Bioprinters
- Bioinks
GLOBAL3D BIOPRINTING MARKET, BY TECHNOLOGY
- Magnetic Levitation
- Inkjet-based
- Syringe-based
- Laser-based
- Others
GLOBAL 3D BIOPRINTING MARKET, BY MATERIAL
- Research Applications
- Clinical Applications
GLOBAL 3D BIOPRINTING MARKET, BY APPLICATION
- Research Organizations and Academic Institutes
- Biopharmaceutical companies
- Hospitals
GLOBAL 3D BIOPRINTING MARKET, BY REGION
- North America
- The U.S.
- Canada
- Europe
- Germany
- France
- Italy
- Spain
- United Kingdom
- Russia
- Netherlands
- Sweden
- Poland
- Rest of Europe
- Asia Pacific
- India
- China
- South Korea
- Japan
- Australia
- Thailand
- Indonesia
- Philippines
- Rest of APAC
- Latin America
- Brazil
- Mexico
- Argentina
- Colombia
- Rest of LATAM
- The Middle East and Africa
- Saudi Arabia
- United Arab Emirates
- Israel
- Turkey
- Algeria
- Egypt
- Rest of MEA
Table of Contents
1. 3D Bioprinting Market Overview
- 1.1. Study Scope
2. Executive Summary
- 2.1. Market Snippet
- 2.1.1. 3D Bioprinting Market Snippet by Components
- 2.1.2. 3D Bioprinting Market Snippet by Technology
- 2.1.3. 3D Bioprinting Market Snippet by Material
- 2.1.4. 3D Bioprinting Market Snippet by Application
- 2.1.5. 3D Bioprinting Market Snippet by Country
- 2.1.6. 3D Bioprinting Market Snippet by Region
- 2.2. Competitive Insights
3. 3D Bioprinting Key Market Trends
- 3.1. 3D Bioprinting Market Drivers
- 3.1.1. Impact Analysis of Market Drivers
- 3.2. 3D Bioprinting Market Restraints
- 3.2.1. Impact Analysis of Market Restraints
- 3.3. 3D Bioprinting Market Opportunities
- 3.4. 3D Bioprinting Market Future Trends
4. 3D Bioprinting Industry Study
- 4.1. PEST Analysis
- 4.2. Porter's Five Forces Analysis
- 4.3. Growth Prospect Mapping
- 4.4. Regulatory Framework Analysis
5. 3D Bioprinting Market: COVID-19 Impact Analysis
- 5.1. Pre-COVID-19 Impact Analysis
- 5.2. Post-COVID-19 Impact Analysis
- 5.2.1. Top Performing Segments
- 5.2.2. Marginal Growth Segments
- 5.2.3. Top Looser Segments
- 5.2.4. Marginal Loss Segments
6. 3D Bioprinting Market Landscape
- 6.1. 3D Bioprinting Market Share Analysis, 2022
- 6.2. Breakdown Data, by Key Manufacturer
- 6.2.1. Established Players' Analysis
- 6.2.2. Emerging Players' Analysis
7. 3D Bioprinting Market - By Components
- 7.1. Overview
- 7.1.1. Segment Share Analysis, By Components, 2022&2030 (%)
- 7.1.2. 3D Bioprinters
- 7.1.3. Bioinks
8. 3D Bioprinting Market - By Technology
- 8.1. Overview
- 8.1.1. Segment Share Analysis, By Technology, 2022&2030 (%)
- 8.1.2. Magnetic Levitation
- 8.1.3. Inkjet-based
- 8.1.4. Syringe-based
- 8.1.5. Laser-based
- 8.1.6. Others
9. 3D Bioprinting Market - By Material
- 9.1. Overview
- 9.1.1. Segment Share Analysis, By Application, 2022&2030 (%)
- 9.1.2. Research Applications
- 9.1.3. Clinical Applications
10. 3D Bioprinting Market - By Application
- 10.1. Overview
- 10.1.1. Segment Share Analysis, By End-Use, 2022&2030 (%)
- 10.1.2. Research Organizations and Academic Institutes
- 10.1.3. Biopharmaceutical companies
- 10.1.4. Hospitals
11. 3D Bioprinting Market- By Geography
- 11.1. Introduction
- 11.1.1. Segment Share Analysis, By Geography, 2022&2030 (%)
- 11.2. North America
- 11.2.1. Overview
- 11.2.2. 3D Bioprinting Key Manufacturers in North America
- 11.2.3. North America Market Size and Forecast, By Country, 2018 - 2030 (US$ Million)
- 11.2.4. North America Market Size and Forecast, By Components, 2018 - 2030 (US$ Million)
- 11.2.5. North America Market Size and Forecast, By Technology, 2018 - 2030 (US$ Million)
- 11.2.6. North America Market Size and Forecast, By Material, 2018 - 2030 (US$ Million)
- 11.2.7. North America Market Size and Forecast, By Application, 2018 - 2030 (US$ Million)
- 11.2.8. U.S.
- 11.2.8.1. Overview
- 11.2.8.2. Market Analysis, Forecast, and Y-O-Y Growth Rate, 2018 - 2030, (US$ Million)
- 11.2.8.3. U.S. Market Size and Forecast, By Components, 2018 - 2030 (US$ Million)
- 11.2.8.4. U.S. Market Size and Forecast, By Technology, 2018 - 2030 (US$ Million)
- 11.2.8.5. U.S. Market Size and Forecast, By Material, 2018 - 2030 (US$ Million)
- 11.2.8.6. U.S. Market Size and Forecast, By Application, 2018 - 2030 (US$ Million)
- 11.2.9. Canada
- 11.2.9.1. Overview
- 11.2.9.2. Market Analysis, Forecast, and Y-O-Y Growth Rate, 2018 - 2030, (US$ Million)
- 11.2.9.3. Canada Market Size and Forecast, By Components, 2018 - 2030 (US$ Million)
- 11.2.9.4. Canada Market Size and Forecast, By Technology, 2018 - 2030 (US$ Million)
- 11.2.9.5. Canada Market Size and Forecast, By Material, 2018 - 2030 (US$ Million)
- 11.2.9.6. Canada Market Size and Forecast, By Application, 2018 - 2030 (US$ Million)
- 11.3. Europe
- 11.3.1. Overview
- 11.3.2. 3D Bioprinting Key Manufacturers in Europe
- 11.3.3. Europe Market Size and Forecast, By Country, 2018 - 2030 (US$ Million)
- 11.3.4. Europe Market Size and Forecast, By Components, 2018 - 2030 (US$ Million)
- 11.3.5. Europe Market Size and Forecast, By Technology, 2018 - 2030 (US$ Million)
- 11.3.6. Europe Market Size and Forecast, By Material, 2018 - 2030 (US$ Million)
- 11.3.7. Europe Market Size and Forecast, By Application, 2018 - 2030 (US$ Million)
- 11.3.8. Germany
- 11.3.8.1. Overview
- 11.3.8.2. Market Analysis, Forecast, and Y-O-Y Growth Rate, 2018 - 2030, (US$ Million)
- 11.3.8.3. Germany Market Size and Forecast, By Components, 2018 - 2030 (US$ Million)
- 11.3.8.4. Germany Market Size and Forecast, By Technology, 2018 - 2030 (US$ Million)
- 11.3.8.5. Germany Market Size and Forecast, By Material, 2018 - 2030 (US$ Million)
- 11.3.8.6. Germany Market Size and Forecast, By Application, 2018 - 2030 (US$ Million)
- 11.3.9. Italy
- 11.3.9.1. Overview
- 11.3.9.2. Market Analysis, Forecast, and Y-O-Y Growth Rate, 2018 - 2030, (US$ Million)
- 11.3.9.3. Italy Market Size and Forecast, By Components, 2018 - 2030 (US$ Million)
- 11.3.9.4. Italy Market Size and Forecast, By Technology, 2018 - 2030 (US$ Million)
- 11.3.9.5. Italy Market Size and Forecast, By Material, 2018 - 2030 (US$ Million)
- 11.3.9.6. Italy Market Size and Forecast, By Application, 2018 - 2030 (US$ Million)
- 11.3.10. United Kingdom
- 11.3.10.1. Overview
- 11.3.10.2. Market Analysis, Forecast, and Y-O-Y Growth Rate, 2018 - 2030, (US$ Million)
- 11.3.10.3. United Kingdom Market Size and Forecast, By Components, 2018 - 2030 (US$ Million)
- 11.3.10.4. United Kingdom Market Size and Forecast, By Technology, 2018 - 2030 (US$ Million)
- 11.3.10.5. United Kingdom Market Size and Forecast, By Material, 2018 - 2030 (US$ Million)
- 11.3.10.6. United Kingdom Market Size and Forecast, By Application, 2018 - 2030 (US$ Million)
- 11.3.11. France
- 11.3.11.1. Overview
- 11.3.11.2. Market Analysis, Forecast, and Y-O-Y Growth Rate, 2018 - 2030, (US$ Million)
- 11.3.11.3. France Market Size and Forecast, By Components, 2018 - 2030 (US$ Million)
- 11.3.11.4. France Market Size and Forecast, By Technology, 2018 - 2030 (US$ Million)
- 11.3.11.5. France Market Size and Forecast, By Material, 2018 - 2030 (US$ Million)
- 11.3.11.6. France Market Size and Forecast, By Application, 2018 - 2030 (US$ Million)
- 11.3.12. Russia
- 11.3.12.1. Market Analysis, Forecast, and Y-O-Y Growth Rate, 2018 - 2030, (US$ Million)
- 11.3.12.2. Russia Market Size and Forecast, By Components, 2018 - 2030 (US$ Million)
- 11.3.12.3. Russia Market Size and Forecast, By Technology, 2018 - 2030 (US$ Million)
- 11.3.12.4. Russia Market Size and Forecast, By Material, 2018 - 2030 (US$ Million)
- 11.3.12.5. Russia Market Size and Forecast, By Application, 2018 - 2030 (US$ Million)
- 11.3.13. Netherlands
- 11.3.13.1. Market Analysis, Forecast, and Y-O-Y Growth Rate, 2018 - 2030, (US$ Million)
- 11.3.13.2. Netherlands Market Size and Forecast, By Components, 2018 - 2030 (US$ Million)
- 11.3.13.3. Netherlands Market Size and Forecast, By Technology, 2018 - 2030 (US$ Million)
- 11.3.13.4. Netherlands Market Size and Forecast, By Material, 2018 - 2030 (US$ Million)
- 11.3.13.5. Netherlands Market Size and Forecast, By Application, 2018 - 2030 (US$ Million)
- 11.3.14. Sweden
- 11.3.14.1. Market Analysis, Forecast, and Y-O-Y Growth Rate, 2018 - 2030, (US$ Million)
- 11.3.14.2. Sweden Market Size and Forecast, By Components, 2018 - 2030 (US$ Million)
- 11.3.14.3. Sweden Market Size and Forecast, By Technology, 2018 - 2030 (US$ Million)
- 11.3.14.4. Sweden Market Size and Forecast, By Material, 2018 - 2030 (US$ Million)
- 11.3.14.5. Sweden Market Size and Forecast, By Application, 2018 - 2030 (US$ Million)
- 11.3.15. Poland
- 11.3.15.1. Market Analysis, Forecast, and Y-O-Y Growth Rate, 2018 - 2030, (US$ Million)
- 11.3.15.2. Poland Market Size and Forecast, By Components, 2018 - 2030 (US$ Million)
- 11.3.15.3. Poland Market Size and Forecast, By Technology, 2018 - 2030 (US$ Million)
- 11.3.15.4. Poland Market Size and Forecast, By Material, 2018 - 2030 (US$ Million)
- 11.3.15.5. Poland Market Size and Forecast, By Application, 2018 - 2030 (US$ Million)
- 11.3.16. Rest of Europe
- 11.3.16.1. Overview
- 11.3.16.2. Market Analysis, Forecast, and Y-O-Y Growth Rate, 2018 - 2030, (US$ Million)
- 11.3.16.3. Rest of the Europe Market Size and Forecast, By Components, 2018 - 2030 (US$ Million)
- 11.3.16.4. Rest of the Europe Market Size and Forecast, By Technology, 2018 - 2030 (US$ Million)
- 11.3.16.5. Rest of the Europe Market Size and Forecast, By Material, 2018 - 2030 (US$ Million)
- 11.3.16.6. Rest of the Europe Market Size and Forecast, By Application, 2018 - 2030 (US$ Million)
- 11.4. Asia Pacific (APAC)
- 11.4.1. Overview
- 11.4.2. 3D Bioprinting Key Manufacturers in Asia Pacific
- 11.4.3. Asia Pacific Market Size and Forecast, By Country, 2018 - 2030 (US$ Million)
- 11.4.4. Asia Pacific Market Size and Forecast, By Components, 2018 - 2030 (US$ Million)
- 11.4.5. Asia Pacific Market Size and Forecast, By Technology, 2018 - 2030 (US$ Million)
- 11.4.6. Asia Pacific Market Size and Forecast, By Material, 2018 - 2030 (US$ Million)
- 11.4.7. Asia Pacific Market Size and Forecast, By Application, 2018 - 2030 (US$ Million)
- 11.4.8. India
- 11.4.8.1. Overview
- 11.4.8.2. Market Analysis, Forecast, and Y-O-Y Growth Rate, 2018 - 2030, (US$ Million)
- 11.4.8.3. India Market Size and Forecast, By Components, 2018 - 2030 (US$ Million)
- 11.4.8.4. India Market Size and Forecast, By Technology, 2018 - 2030 (US$ Million)
- 11.4.8.5. India Market Size and Forecast, By Material, 2018 - 2030 (US$ Million)
- 11.4.8.6. India Market Size and Forecast, By Application, 2018 - 2030 (US$ Million)
- 11.4.9. China
- 11.4.9.1. Overview
- 11.4.9.2. Market Analysis, Forecast, and Y-O-Y Growth Rate, 2018 - 2030, (US$ Million)
- 11.4.9.3. China Market Size and Forecast, By Components, 2018 - 2030 (US$ Million)
- 11.4.9.4. China Market Size and Forecast, By Technology, 2018 - 2030 (US$ Million)
- 11.4.9.5. China Market Size and Forecast, By Material, 2018 - 2030 (US$ Million)
- 11.4.9.6. China Market Size and Forecast, By Application, 2018 - 2030 (US$ Million)
- 11.4.10. Japan
- 11.4.10.1. Overview
- 11.4.10.2. Market Analysis, Forecast, and Y-O-Y Growth Rate, 2018 - 2030, (US$ Million)
- 11.4.10.3. Japan Market Size and Forecast, By Components, 2018 - 2030 (US$ Million)
- 11.4.10.4. Japan Market Size and Forecast, By Technology, 2018 - 2030 (US$ Million)
- 11.4.10.5. Japan Market Size and Forecast, By Material, 2018 - 2030 (US$ Million)
- 11.4.10.6. Japan Market Size and Forecast, By Application, 2018 - 2030 (US$ Million)
- 11.4.11. South Korea
- 11.4.11.1. Overview
- 11.4.11.2. Market Analysis, Forecast, and Y-O-Y Growth Rate, 2018 - 2030, (US$ Million)
- 11.4.11.3. South Korea Market Size and Forecast, By Components, 2018 - 2030 (US$ Million)
- 11.4.11.4. South Korea Market Size and Forecast, By Technology, 2018 - 2030 (US$ Million)
- 11.4.11.5. South Korea Market Size and Forecast, By Material, 2018 - 2030 (US$ Million)
- 11.4.11.6. South Korea Market Size and Forecast, By Application, 2018 - 2030 (US$ Million)
- 11.4.12. Australia
- 11.4.12.1. Overview
- 11.4.12.2. Market Analysis, Forecast, and Y-O-Y Growth Rate, 2018 - 2030, (US$ Million)
- 11.4.12.3. Australia Market Size and Forecast, By Components, 2018 - 2030 (US$ Million)
- 11.4.12.4. Australia Market Size and Forecast, By Technology, 2018 - 2030 (US$ Million)
- 11.4.12.5. Australia Market Size and Forecast, By Material, 2018 - 2030 (US$ Million)
- 11.4.12.6. Australia Market Size and Forecast, By Application, 2018 - 2030 (US$ Million)
- 11.4.13. Thailand
- 11.4.13.1. Overview
- 11.4.13.2. Market Analysis, Forecast, and Y-O-Y Growth Rate, 2018 - 2030, (US$ Million)
- 11.4.13.3. Thailand Market Size and Forecast, By Components, 2018 - 2030 (US$ Million)
- 11.4.13.4. Thailand Market Size and Forecast, By Technology, 2018 - 2030 (US$ Million)
- 11.4.13.5. Thailand Market Size and Forecast, By Material, 2018 - 2030 (US$ Million)
- 11.4.13.6. Thailand Market Size and Forecast, By Application, 2018 - 2030 (US$ Million)
- 11.4.14. Indonesia
- 11.4.14.1. Overview
- 11.4.14.2. Market Analysis, Forecast, and Y-O-Y Growth Rate, 2018 - 2030, (US$ Million)
- 11.4.14.3. Indonesia Market Size and Forecast, By Components, 2018 - 2030 (US$ Million)
- 11.4.14.4. Indonesia Market Size and Forecast, By Technology, 2018 - 2030 (US$ Million)
- 11.4.14.5. Indonesia Market Size and Forecast, By Material, 2018 - 2030 (US$ Million)
- 11.4.14.6. Indonesia Market Size and Forecast, By Application, 2018 - 2030 (US$ Million)
- 11.4.15. Philippines
- 11.4.15.1. Overview
- 11.4.15.2. Market Analysis, Forecast, and Y-O-Y Growth Rate, 2018 - 2030, (US$ Million)
- 11.4.15.3. Philippines Market Size and Forecast, By Components, 2018 - 2030 (US$ Million)
- 11.4.15.4. Philippines Market Size and Forecast, By Technology, 2018 - 2030 (US$ Million)
- 11.4.15.5. Philippines Market Size and Forecast, By Material, 2018 - 2030 (US$ Million)
- 11.4.15.6. Philippines Market Size and Forecast, By Application, 2018 - 2030 (US$ Million)
- 11.4.16. Rest of APAC
- 11.4.16.1. Overview
- 11.4.16.2. Market Analysis, Forecast, and Y-O-Y Growth Rate, 2018 - 2030, (US$ Million)
- 11.4.16.3. Rest of APAC Market Size and Forecast, By Components, 2018 - 2030 (US$ Million)
- 11.4.16.4. Rest of APAC Market Size and Forecast, By Technology, 2018 - 2030 (US$ Million)
- 11.4.16.5. Rest of APAC Market Size and Forecast, By Material, 2018 - 2030 (US$ Million)
- 11.4.16.6. Rest of APAC Market Size and Forecast, By Application, 2018 - 2030 (US$ Million)
- 11.5. Latin America
- 11.5.1. Overview
- 11.5.2. 3D Bioprinting Key Manufacturers in Latin America
- 11.5.3. Latin America Market Size and Forecast, By Country, 2018 - 2030 (US$ Million)
- 11.5.4. Latin America Market Size and Forecast, By Components, 2018 - 2030 (US$ Million)
- 11.5.5. Latin America Market Size and Forecast, By Technology, 2018 - 2030 (US$ Million)
- 11.5.6. Latin America Market Size and Forecast, By Material, 2018 - 2030 (US$ Million)
- 11.5.7. Latin America Market Size and Forecast, By Application, 2018 - 2030 (US$ Million)
- 11.5.8. Brazil
- 11.5.8.1. Overview
- 11.5.8.2. Market Analysis, Forecast, and Y-O-Y Growth Rate, 2018 - 2030, (US$ Million)
- 11.5.8.3. Brazil Market Size and Forecast, By Components, 2018 - 2030 (US$ Million)
- 11.5.8.4. Brazil Market Size and Forecast, By Technology, 2018 - 2030 (US$ Million)
- 11.5.8.5. Brazil Market Size and Forecast, By Material, 2018 - 2030 (US$ Million)
- 11.5.8.6. Brazil Market Size and Forecast, By Application, 2018 - 2030 (US$ Million)
- 11.5.9. Mexico
- 11.5.9.1. Overview
- 11.5.9.2. Market Analysis, Forecast, and Y-O-Y Growth Rate, 2018 - 2030, (US$ Million)
- 11.5.9.3. Mexico Market Size and Forecast, By Components, 2018 - 2030 (US$ Million)
- 11.5.9.4. Mexico Market Size and Forecast, By Technology, 2018 - 2030 (US$ Million)
- 11.5.9.5. Mexico Market Size and Forecast, By Material, 2018 - 2030 (US$ Million)
- 11.5.9.6. Mexico Market Size and Forecast, By Application, 2018 - 2030 (US$ Million)
- 11.5.10. Argentina
- 11.5.10.1. Overview
- 11.5.10.2. Market Analysis, Forecast, and Y-O-Y Growth Rate, 2018 - 2030, (US$ Million)
- 11.5.10.3. Argentina Market Size and Forecast, By Components, 2018 - 2030 (US$ Million)
- 11.5.10.4. Argentina Market Size and Forecast, By Technology, 2018 - 2030 (US$ Million)
- 11.5.10.5. Argentina Market Size and Forecast, By Material, 2018 - 2030 (US$ Million)
- 11.5.10.6. Argentina Market Size and Forecast, By Application, 2018 - 2030 (US$ Million)
- 11.5.11. Colombia
- 11.5.11.1. Overview
- 11.5.11.2. Market Analysis, Forecast, and Y-O-Y Growth Rate, 2018 - 2030, (US$ Million)
- 11.5.11.3. Colombia Market Size and Forecast, By Components, 2018 - 2030 (US$ Million)
- 11.5.11.4. Colombia Market Size and Forecast, By Technology, 2018 - 2030 (US$ Million)
- 11.5.11.5. Colombia Market Size and Forecast, By Material, 2018 - 2030 (US$ Million)
- 11.5.11.6. Colombia Market Size and Forecast, By Application, 2018 - 2030 (US$ Million)
- 11.5.12. Rest of LATAM
- 11.5.12.1. Overview
- 11.5.12.2. Market Analysis, Forecast, and Y-O-Y Growth Rate, 2018 - 2030, (US$ Million)
- 11.5.12.3. Rest of LATAM Market Size and Forecast, By Components, 2018 - 2030 (US$ Million)
- 11.5.12.4. Rest of LATAM Market Size and Forecast, By Technology, 2018 - 2030 (US$ Million)
- 11.5.12.5. Rest of LATAM Market Size and Forecast, By Material, 2018 - 2030 (US$ Million)
- 11.5.12.6. Rest of LATAM Market Size and Forecast, By Application, 2018 - 2030 (US$ Million)
- 11.6. Middle East and Africa
- 11.6.1. Overview
- 11.6.2. 3D Bioprinting Key Manufacturers in Middle East and Africa
- 11.6.3. Middle East and Africa Market Size and Forecast, By Country, 2018 - 2030 (US$ Million)
- 11.6.4. Middle East and Africa Market Size and Forecast, By Components, 2018 - 2030 (US$ Million)
- 11.6.5. Middle East and Africa Market Size and Forecast, By Technology, 2018 - 2030 (US$ Million)
- 11.6.6. Middle East and Africa Market Size and Forecast, By Material, 2018 - 2030 (US$ Million)
- 11.6.7. Middle East and Africa Market Size and Forecast, By Application, 2018 - 2030 (US$ Million)
- 11.6.8. Saudi Arabia
- 11.6.8.1. Overview
- 11.6.8.2. Market Analysis, Forecast, and Y-O-Y Growth Rate, 2018 - 2030, (US$ Million)
- 11.6.8.3. Saudi Arabia Market Size and Forecast, By Components, 2018 - 2030 (US$ Million)
- 11.6.8.4. Saudi Arabia Market Size and Forecast, By Technology, 2018 - 2030 (US$ Million)
- 11.6.8.5. Saudi Arabia Market Size and Forecast, By Material, 2018 - 2030 (US$ Million)
- 11.6.8.6. Saudi Arabia Market Size and Forecast, By Application, 2018 - 2030 (US$ Million)
- 11.6.9. United Arab Emirates
- 11.6.9.1. Overview
- 11.6.9.2. Market Analysis, Forecast, and Y-O-Y Growth Rate, 2018 - 2030, (US$ Million)
- 11.6.9.3. United Arab Emirates Market Size and Forecast, By Components, 2018 - 2030 (US$ Million)
- 11.6.9.4. United Arab Emirates Market Size and Forecast, By Technology, 2018 - 2030 (US$ Million)
- 11.6.9.5. United Arab Emirates Market Size and Forecast, By Material, 2018 - 2030 (US$ Million)
- 11.6.9.6. United Arab Emirates Market Size and Forecast, By Application, 2018 - 2030 (US$ Million)
- 11.6.10. Israel
- 11.6.10.1. Overview
- 11.6.10.2. Market Analysis, Forecast, and Y-O-Y Growth Rate, 2018 - 2030, (US$ Million)
- 11.6.10.3. Israel Market Size and Forecast, By Components, 2018 - 2030 (US$ Million)
- 11.6.10.4. Israel Market Size and Forecast, By Technology, 2018 - 2030 (US$ Million)
- 11.6.10.5. Israel Market Size and Forecast, By Material, 2018 - 2030 (US$ Million)
- 11.6.10.6. Israel Market Size and Forecast, By Application, 2018 - 2030 (US$ Million)
- 11.6.11. Turkey
- 11.6.11.1. Overview
- 11.6.11.2. Market Analysis, Forecast, and Y-O-Y Growth Rate, 2018 - 2030, (US$ Million)
- 11.6.11.3. Turkey Market Size and Forecast, By Components, 2018 - 2030 (US$ Million)
- 11.6.11.4. Turkey Market Size and Forecast, By Technology, 2018 - 2030 (US$ Million)
- 11.6.11.5. Turkey Market Size and Forecast, By Material, 2018 - 2030 (US$ Million)
- 11.6.11.6. Turkey Market Size and Forecast, By Application, 2018 - 2030 (US$ Million)
- 11.6.12. Algeria
- 11.6.12.1. Overview
- 11.6.12.2. Market Analysis, Forecast, and Y-O-Y Growth Rate, 2018 - 2030, (US$ Million)
- 11.6.12.3. Algeria Market Size and Forecast, By Components, 2018 - 2030 (US$ Million)
- 11.6.12.4. Algeria Market Size and Forecast, By Technology, 2018 - 2030 (US$ Million)
- 11.6.12.5. Algeria Market Size and Forecast, By Material, 2018 - 2030 (US$ Million)
- 11.6.12.6. Algeria Market Size and Forecast, By Application, 2018 - 2030 (US$ Million)
- 11.6.13. Egypt
- 11.6.13.1. Overview
- 11.6.13.2. Market Analysis, Forecast, and Y-O-Y Growth Rate, 2018 - 2030, (US$ Million)
- 11.6.13.3. Egypt Market Size and Forecast, By Components, 2018 - 2030 (US$ Million)
- 11.6.13.4. Egypt Market Size and Forecast, By Technology, 2018 - 2030 (US$ Million)
- 11.6.13.5. Egypt Market Size and Forecast, By Material, 2018 - 2030 (US$ Million)
- 11.6.13.6. Egypt Market Size and Forecast, By Application, 2018 - 2030 (US$ Million)
- 11.6.14. Rest of MEA
- 11.6.14.1. Overview
- 11.6.14.2. Market Analysis, Forecast, and Y-O-Y Growth Rate, 2018 - 2030, (US$ Million)
- 11.6.14.3. Rest of MEA Market Size and Forecast, By Components, 2018 - 2030 (US$ Million)
- 11.6.14.4. Rest of MEA Market Size and Forecast, By Technology, 2018 - 2030 (US$ Million)
- 11.6.14.5. Rest of MEA Market Size and Forecast, By Material, 2018 - 2030 (US$ Million)
- 11.6.14.6. Rest of MEA Market Size and Forecast, By Application, 2018 - 2030 (US$ Million)
12. Key Vendor Analysis- 3D Bioprinting Industry
- 12.1. Competitive Dashboard
- 12.2. Company Profiles
- 12.2.1. Electro Optical Systems
- 12.2.2. EnvisionTEC, Inc.
- 12.2.3. Rokit Healthcare, inc.
- 12.2.4. Formlabs, Inc.
- 12.2.5. GE Healthcare
- 12.2.6. Inventia Life Science PTY LTD
- 12.2.7. Optomec Inc.
- 12.2.8. Organovo Holdings Inc
- 12.2.9. Pandorum Technologies pvt. ltd.
- 12.2.10. Regenovo Biotechnology Co. Ltd.
- 12.2.11. Poietis
- 12.2.12. Cyfuse Biomedical K.K.
- 12.2.13. Precise Bio
- 12.2.14. Foldink Life Science Technologies
- 12.2.15. Renishaw plc.
- 12.2.16. Revotek co., ltd.
- 12.2.17. Stratasys Ltd.Vivax Bio, LLC
13. 360 Degree AnalystView
14. Appendix
- 14.1. Research Methodology
- 14.2. References
- 14.3. Abbreviations
- 14.4. Disclaimer
- 14.5. Contact Us