|
|
市場調査レポート
商品コード
1270351
皮膚T細胞リンパ腫(CTCL)治療薬の世界市場、COVID-19の影響の分析:薬剤クラス別、疾患タイプ別、流通チャネル別、国別、地域別 - 業界分析、市場規模、市場シェア、予測(2023年~2030年)Cutaneous T-cell Lymphoma (CTCL) Therapeutics Market with COVID-19 Impact Analysis, By Drug Class, By Disease Type, By Distribution Channel, By Country, and By Region - Industry Analysis, Market Size, Market Share & Forecast from 2023-2030 |
||||||
|
|
|||||||
|
● お客様のご希望に応じて、既存データの加工や未掲載情報(例:国別セグメント)の追加などの対応が可能です。 詳細はお問い合わせください。 |
|||||||


| 皮膚T細胞リンパ腫(CTCL)治療薬の世界市場、COVID-19の影響の分析:薬剤クラス別、疾患タイプ別、流通チャネル別、国別、地域別 - 業界分析、市場規模、市場シェア、予測(2023年~2030年) |
|
出版日: 2023年04月01日
発行: AnalystView Market Insights
ページ情報: 英文 355 Pages
納期: 2~3営業日
|
- 全表示
- 概要
- 図表
- 目次
世界の皮膚T細胞リンパ腫(CTCL)治療薬の市場規模は、2022年に20億810万米ドルとなり、2023年~2030年にCAGRで2.9%の成長が予測されています。
当レポートでは、世界の皮膚T細胞リンパ腫(CTCL)治療薬市場について調査分析し、市場動向、地域とセグメントの分析、企業プロファイルなどを提供しています。
目次
第1章 皮膚T細胞リンパ腫(CTCL)治療薬の概要
第2章 エグゼクティブサマリー
第3章 皮膚T細胞リンパ腫(CTCL)治療薬の主な市場動向
- 皮膚T細胞リンパ腫(CTCL)治療薬の促進要因
- 市場促進要因の影響の分析
- 皮膚T細胞リンパ腫(CTCL)治療薬の抑制要因
- 市場抑制要因の影響の分析
- 皮膚T細胞リンパ腫(CTCL)治療薬の機会
- 皮膚T細胞リンパ腫(CTCL)治療薬の将来の動向
第4章 皮膚T細胞リンパ腫(CTCL)治療薬業界の調査
- PEST分析
- ポーターのファイブフォース分析
- 成長の見通しのマッピング
- 規制枠組みの分析
第5章 皮膚T細胞リンパ腫(CTCL)治療薬市場:COVID-19の影響の分析
- COVID-19前の影響の分析
- COVID-19後の影響の分析
第6章 皮膚T細胞リンパ腫(CTCL)治療薬の情勢
- 皮膚T細胞リンパ腫(CTCL)治療薬シェア分析(2022年)
- 内訳データ:主要メーカー別
- 既存企業の分析
- 新興企業の分析
第7章 皮膚T細胞リンパ腫(CTCL)治療薬 - 薬剤クラス別
- 概要
- セグメントシェア分析:薬剤クラス別(2022年・2030年)
- 抗悪性腫瘍剤
- ヒストン脱アセチル化酵素(HDAC)阻害剤
- モノクローナル抗体
- その他(ソラレンなど)
第8章 皮膚T細胞リンパ腫(CTCL)治療薬 - 疾患タイプ別
- 概要
- セグメントシェア分析:疾患タイプ別(2022年・2030年)
- 菌状息肉症(MF)
- セザリー症候群(SS)
- その他
第9章 皮膚T細胞リンパ腫(CTCL)治療薬 - 流通チャネル別
- 概要
- セグメントシェア分析:販売チャネル別(2022年・2030年)
- 病院薬局
- 小売薬局・ドラッグストア
- オンライン薬局
第10章 皮膚T細胞リンパ腫(CTCL)治療薬市場 - 地域別
- イントロダクション
- セグメントシェア分析:地域別(2022年・2030年)
- 北米
- 概要
- 北米の皮膚T細胞リンパ腫(CTCL)治療薬の主要メーカー
- 北米の市場規模と予測:国別(2018年~2030年)
- 北米の市場規模と予測:薬剤クラス別(2018年~2030年)
- 北米の市場規模と予測:疾患タイプ別(2018年~2030年)
- 北米の市場規模と予測:流通チャネル別(2018年~2030年)
- 米国
- カナダ
- 欧州
- 概要
- 欧州の皮膚T細胞リンパ腫(CTCL)治療薬の主要メーカー
- 欧州の市場規模と予測:国別(2018年~2030年)
- 欧州の市場規模と予測:薬剤クラス別(2018年~2030年)
- 欧州の市場規模と予測:疾患タイプ別(2018年~2030年)
- 欧州の市場規模と予測:流通チャネル別(2018年~2030年)
- ドイツ
- イタリア
- 英国
- フランス
- ロシア
- オランダ
- スウェーデン
- ポーランド
- その他の欧州
- アジア太平洋
- 概要
- アジア太平洋の皮膚T細胞リンパ腫(CTCL)治療薬の主要メーカー
- アジア太平洋の市場規模と予測:国別(2018年~2030年)
- アジア太平洋の市場規模と予測:薬剤クラス別(2018年~2030年)
- アジア太平洋の市場規模と予測:疾患タイプ別(2018年~2030年)
- アジア太平洋の市場規模と予測:流通チャネル別(2018年~2030年)
- インド
- 中国
- 日本
- 韓国
- オーストラリア
- タイ
- インドネシア
- フィリピン
- その他のアジア太平洋
- ラテンアメリカ
- 概要
- ラテンアメリカの皮膚T細胞リンパ腫(CTCL)治療薬の主要メーカー
- ラテンアメリカの市場規模と予測:国別(2018年~2030年)
- ラテンアメリカの市場規模と予測:薬剤クラス別(2018年~2030年)
- ラテンアメリカの市場規模と予測:疾患タイプ別(2018年~2030年)
- ラテンアメリカの市場規模と予測:流通チャネル別(2018年~2030年)
- ブラジル
- メキシコ
- アルゼンチン
- コロンビア
- その他のラテンアメリカ
- 中東・アフリカ
- 概要
- 中東・アフリカの皮膚T細胞リンパ腫(CTCL)治療薬の主要メーカー
- 中東・アフリカの市場規模と予測:国別(2018年~2030年)
- 中東・アフリカの市場規模と予測:薬剤クラス別(2018年~2030年)
- 中東・アフリカの市場規模と予測:疾患タイプ別(2018年~2030年)
- 中東・アフリカの市場規模と予測:流通チャネル別(2018年~2030年)
- サウジアラビア
- アラブ首長国連邦
- イスラエル
- トルコ
- アルジェリア
- エジプト
- その他の中東・アフリカ
第11章 主なベンダーの分析 - 皮膚T細胞リンパ腫(CTCL)治療薬業界
- 競合ダッシュボード
- 企業プロファイル
第12章 アナリストの見解
第13章 付録
List of Tables
- TABLE List of data sources
- TABLE Market drivers; Impact Analysis
- TABLE Market restraints; Impact Analysis
- TABLE Immersion Cooling Market: Drug Class Snapshot (2022)
- TABLE Segment Dashboard; Definition and Scope, by Drug Class
- TABLE Global Immersion Cooling Market, by Drug Class 2018-2030 (USD Million)
- TABLE Immersion Cooling Market: Disease Type Snapshot (2022)
- TABLE Segment Dashboard; Definition and Scope, by Disease Type
- TABLE Global Immersion Cooling Market, by Disease Type 2018-2030 (USD Million)
- TABLE Immersion Cooling Market: Regional snapshot (2022)
- TABLE Immersion Cooling Market: Distribution Channel Snapshot (2022)
- TABLE Segment Dashboard; Definition and Scope, by Distribution Channel
- TABLE Global Immersion Cooling Market, by Distribution Channel 2018-2030 (USD Million)
- TABLE Segment Dashboard; Definition and Scope, by Region
- TABLE Global Immersion Cooling Market, by Region 2018-2030 (USD Million)
- TABLE North America Immersion Cooling Market, by Country, 2018-2030 (USD Million)
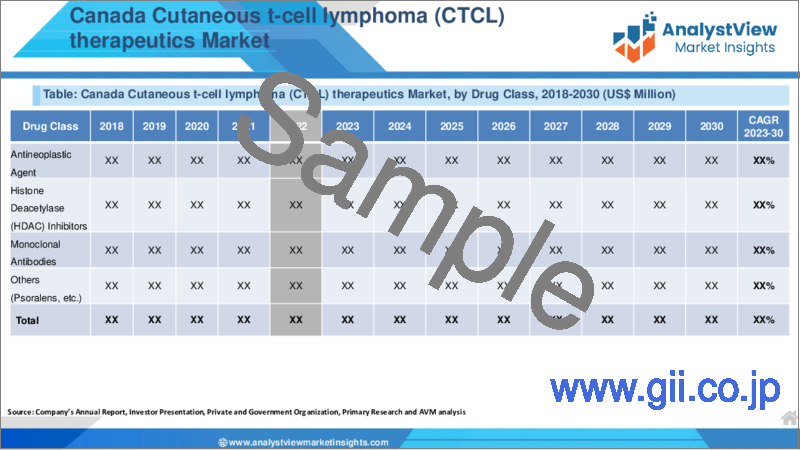
- TABLE North America Immersion Cooling Market, by Drug Class, 2018-2030 (USD Million)
- TABLE North America Immersion Cooling Market, by Disease Type, 2018-2030 (USD Million)
- TABLE North America Immersion Cooling Market, by Distribution Channel, 2018-2030 (USD Million)
- TABLE Europe Immersion Cooling Market, by Country, 2018-2030 (USD Million)
- TABLE Europe Immersion Cooling Market, by Drug Class, 2018-2030 (USD Million)
- TABLE Europe Immersion Cooling Market, by Disease Type, 2018-2030 (USD Million)
- TABLE Europe Immersion Cooling Market, by Distribution Channel, 2018-2030 (USD Million)
- TABLE Asia Pacific Immersion Cooling Market, by Country, 2018-2030 (USD Million)
- TABLE Asia Pacific Immersion Cooling Market, by Drug Class, 2018-2030 (USD Million)
- TABLE Asia Pacific Immersion Cooling Market, by Disease Type, 2018-2030 (USD Million)
- TABLE Asia Pacific Immersion Cooling Market, by Distribution Channel, 2018-2030 (USD Million)
- TABLE Latin America Immersion Cooling Market, by Country, 2018-2030 (USD Million)
- TABLE Latin America Immersion Cooling Market, by Drug Class, 2018-2030 (USD Million)
- TABLE Latin America Immersion Cooling Market, by Disease Type, 2018-2030 (USD Million)
- TABLE Latin America Immersion Cooling Market, by Distribution Channel, 2018-2030 (USD Million)
- TABLE Middle East and Africa Immersion Cooling Market, by Country, 2018-2030 (USD Million)
- TABLE Middle East and Africa Immersion Cooling Market, by Drug Class, 2018-2030 (USD Million)
- TABLE Middle East and Africa Immersion Cooling Market, by Disease Type, 2018-2030 (USD Million)
- TABLE Middle East and Africa Immersion Cooling Market, by Distribution Channel, 2018-2030 (USD Million)
List of Figures
- FIGURE Cutaneous T-cell Lymphoma (CTCL) Therapeutics Segmentation
- FIGURE Market research methodology
- FIGURE Value chain analysis
- FIGURE Porter's Five Forces Analysis
- FIGURE Market Attractiveness Analysis
- FIGURE COVID-19 Impact Analysis
- FIGURE Pre & Post COVID-19 Impact Comparision Study
- FIGURE Competitive Landscape; Key company market share analysis, 2022
- FIGURE Drug Class segment market share analysis, 2022 & 2030
- FIGURE Drug Class segment market size forecast and trend analysis, 2018 to 2030 (USD Million)
- FIGURE Disease Type segment market share analysis, 2022 & 2030
- FIGURE Disease Type segment market size forecast and trend analysis, 2018 to 2030 (USD Million)
- FIGURE Distribution Channel segment market share analysis, 2022 & 2030
- FIGURE Distribution Channel segment market size forecast and trend analysis, 2018 to 2030 (USD Million)
- FIGURE Regional segment market share analysis, 2022 & 2030
- FIGURE Regional segment market size forecast and trend analysis, 2018 to 2030 (USD Million)
- FIGURE North America Cutaneous T-cell Lymphoma (CTCL) Therapeutics share and leading players, 2022
- FIGURE Europe Cutaneous T-cell Lymphoma (CTCL) Therapeutics share and leading players, 2022
- FIGURE Asia Pacific Cutaneous T-cell Lymphoma (CTCL) Therapeutics share and leading players, 2022
- FIGURE Latin America Cutaneous T-cell Lymphoma (CTCL) Therapeutics share and leading players, 2022
- FIGURE Middle East and Africa Cutaneous T-cell Lymphoma (CTCL) Therapeutics share and leading players, 2022
- FIGURE North America market share analysis by country, 2022
- FIGURE U.S. Cutaneous T-cell Lymphoma (CTCL) Therapeutics size, forecast and trend analysis, 2018 to 2030 (USD Million)
- FIGURE Canada Cutaneous T-cell Lymphoma (CTCL) Therapeutics size, forecast and trend analysis, 2018 to 2030 (USD Million)
- FIGURE Europe Cutaneous T-cell Lymphoma (CTCL) Therapeutics share analysis by country, 2022
- FIGURE Germany Cutaneous T-cell Lymphoma (CTCL) Therapeutics size, forecast and trend analysis, 2018 to 2030 (USD Million)
- FIGURE Spain Cutaneous T-cell Lymphoma (CTCL) Therapeutics size, forecast and trend analysis, 2018 to 2030 (USD Million)
- FIGURE Italy Cutaneous T-cell Lymphoma (CTCL) Therapeutics size, forecast and trend analysis, 2018 to 2030 (USD Million)
- FIGURE France Cutaneous T-cell Lymphoma (CTCL) Therapeutics size, forecast and trend analysis, 2018 to 2030 (USD Million)
- FIGURE UK Cutaneous T-cell Lymphoma (CTCL) Therapeutics size, forecast and trend analysis, 2018 to 2030 (USD Million)
- FIGURE Russia Cutaneous T-cell Lymphoma (CTCL) Therapeutics size, forecast and trend analysis, 2018 to 2030 (USD Million)
- FIGURE Netherlands Cutaneous T-cell Lymphoma (CTCL) Therapeutics size, forecast and trend analysis, 2018 to 2030 (USD Million)
- FIGURE Sweden Cutaneous T-cell Lymphoma (CTCL) Therapeutics size, forecast and trend analysis, 2018 to 2030 (USD Million)
- FIGURE Poland Cutaneous T-cell Lymphoma (CTCL) Therapeutics size, forecast and trend analysis, 2018 to 2030 (USD Million)
- FIGURE Rest of the Europe Cutaneous T-cell Lymphoma (CTCL) Therapeutics size, forecast and trend analysis, 2018 to 2030 (USD Million)
- FIGURE Asia Pacific Cutaneous T-cell Lymphoma (CTCL) Therapeutics share analysis by country, 2022
- FIGURE India Cutaneous T-cell Lymphoma (CTCL) Therapeutics size, forecast and trend analysis, 2018 to 2030 (USD Million)
- FIGURE China Cutaneous T-cell Lymphoma (CTCL) Therapeutics size, forecast and trend analysis, 2018 to 2030 (USD Million)
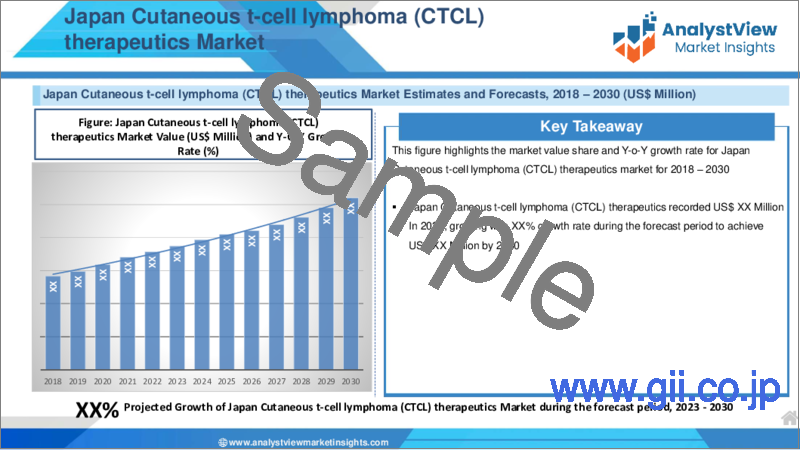
- FIGURE Japan Cutaneous T-cell Lymphoma (CTCL) Therapeutics size, forecast and trend analysis, 2018 to 2030 (USD Million)
- FIGURE South Korea Cutaneous T-cell Lymphoma (CTCL) Therapeutics size, forecast and trend analysis, 2018 to 2030 (USD Million)
- FIGURE Australia Cutaneous T-cell Lymphoma (CTCL) Therapeutics size, forecast and trend analysis, 2018 to 2030 (USD Million)
- FIGURE Thailand Cutaneous T-cell Lymphoma (CTCL) Therapeutics size, forecast and trend analysis, 2018 to 2030 (USD Million)
- FIGURE Indonesia Cutaneous T-cell Lymphoma (CTCL) Therapeutics size, forecast and trend analysis, 2018 to 2030 (USD Million)
- FIGURE Phillipines Cutaneous T-cell Lymphoma (CTCL) Therapeutics size, forecast and trend analysis, 2018 to 2030 (USD Million)
- FIGURE Rest of APAC Cutaneous T-cell Lymphoma (CTCL) Therapeutics size, forecast and trend analysis, 2018 to 2030 (USD Million)
- FIGURE Latin America Cutaneous T-cell Lymphoma (CTCL) Therapeutics size, forecast and trend analysis, 2018 to 2030 (USD Million)
- FIGURE Latin America Cutaneous T-cell Lymphoma (CTCL) Therapeutics share analysis by country, 2022
- FIGURE Brazil Cutaneous T-cell Lymphoma (CTCL) Therapeutics size, forecast and trend analysis, 2018 to 2030 (USD Million)
- FIGURE Mexico Cutaneous T-cell Lymphoma (CTCL) Therapeutics size, forecast and trend analysis, 2018 to 2030 (USD Million)
- FIGURE Argentina Cutaneous T-cell Lymphoma (CTCL) Therapeutics size, forecast and trend analysis, 2018 to 2030 (USD Million)
- FIGURE Colombia Cutaneous T-cell Lymphoma (CTCL) Therapeutics size, forecast and trend analysis, 2018 to 2030 (USD Million)
- FIGURE Rest of LATAM Cutaneous T-cell Lymphoma (CTCL) Therapeutics size, forecast and trend analysis, 2018 to 2030 (USD Million)
- FIGURE Middle East and Africa Cutaneous T-cell Lymphoma (CTCL) Therapeutics size, forecast and trend analysis, 2018 to 2030 (USD Million)
- FIGURE Middle East and Africa Cutaneous T-cell Lymphoma (CTCL) Therapeutics share analysis by country, 2022
- FIGURE Saudi Arabia Cutaneous T-cell Lymphoma (CTCL) Therapeutics size, forecast and trend analysis, 2018 to 2030 (USD Million)
- FIGURE United Arab Emirates Cutaneous T-cell Lymphoma (CTCL) Therapeutics size, forecast and trend analysis, 2018 to 2030 (USD Million)
- FIGURE Israel Cutaneous T-cell Lymphoma (CTCL) Therapeutics size, forecast and trend analysis, 2018 to 2030 (USD Million)
- FIGURE Turkey Cutaneous T-cell Lymphoma (CTCL) Therapeutics size, forecast and trend analysis, 2018 to 2030 (USD Million)
- FIGURE Algeria Cutaneous T-cell Lymphoma (CTCL) Therapeutics size, forecast and trend analysis, 2018 to 2030 (USD Million)
- FIGURE Egypt Cutaneous T-cell Lymphoma (CTCL) Therapeutics size, forecast and trend analysis, 2018 to 2030 (USD Million)
- FIGURE Rest of MEA Cutaneous T-cell Lymphoma (CTCL) Therapeutics size, forecast and trend analysis, 2018 to 2030 (USD Million)
REPORT HIGHLIGHT
Cutaneous t-cell lymphoma (CTCL) therapeutics Market size was valued at USD 2,008.1 Million in 2022, expanding at a CAGR of 2.9% from 2023 to 2030.
Medicines used to treat cutaneous T-cell lymphoma include immune system suppressants such interferon and steroid medications. Chemotherapy drugs target cancer cells and other rapidly proliferating cells. The unique vulnerabilities of cancer cells are the target of drugs used in targeted therapy.
Cutaneous t-cell lymphoma (CTCL) therapeutics Market- Market Dynamics
The cutaneous T-cell lymphoma market will benefit from an active pipeline because numerous pharmaceutical companies are working to create an efficient and economical treatment for CTCL. Also, the absence of a curative therapy offers businesses a fantastic opportunity to create treatments that will dominate the cutaneous T-cell lymphoma industry. Furthermore, rising disease prevalence and increased awareness are significant drivers of the cutaneous T-cell lymphoma market.
The cutaneous T-cell lymphoma market, however, faces significant challenges in its expansion. The key drivers of the cutaneous T-cell lymphoma market growth continue to be the undiagnosed, unreported cases and public ignorance of the disease. The cutaneous T-cell lymphoma market may also be hampered by the disease's progression and the possibility of deadly consequences.
Furthermore, a number of competitors are actively working on other therapeutic classes in the drug development industry. As a result, for therapy to have an influence on the cutaneous T-cell lymphoma market, it must be exceptional in terms of price, effectiveness, and other important factors.
Cutaneous t-cell lymphoma (CTCL) therapeutics Market- Segmentation Analysis:
The Global Cutaneous t-cell lymphoma (CTCL) therapeutics Market is segmented into drug class, disease type, distribution channel and Region.
Based on drug class, the market is segmented into histone deacetylase (HDAC) inhibitors, monoclonal antibody, antineoplastic agent, and others
The Histone Deacetylase (HDAC) Inhibitors segment dominated the global industry in 2022 and accounted for the highest CGAR in the forecast period. The Histone deacetylase (HDAC), one of the best-known epigenetic modulators, has been the subject of numerous studies. Epigenetic modification has been recognized for more than ten years as an effective treatment approach to cancer. HDAC plays a crucial part in cell growth by regulating angiogenesis and cell proliferation. Many cancer forms have been shown to contain up-regulated HDACs, and overregulated HDACs have been silenced using synthetic or natural HDAC inhibitors. Cellular apoptosis, angiogenesis decrease, and cell growth arrest may result from the inhibition of HDACs. For Instance, current research suggests that HDAC inhibitors may have therapeutic benefits for a number of malignancies, including B-cell lymphoma, leukaemia, multiple myeloma, and several cancers linked to viruses.
By disease type, the market is divided into sezary syndrome (SS), mycosis fungoides (MF), and others. On the basis of distribution channel, the market is classified into retail pharmacies & drug stores, hospital pharmacies, and online pharmacies.The online pharmacies dominated the global industry in 2022 and is expected to continue the same pattern over the forecast period. The growth in the segment is attributed owing to the growing invetmentment in these sector. For instance more than 32,500 online pharmacies worldwide offer services within the bounds of the law to safeguard the public health everywhere.
Cutaneous t-cell lymphoma (CTCL) therapeutics Market- Geographical Insights
Regionally, North America is market accounted for the largest market share in 2022 and is expected to dominate during the forecast period. The region's expansion is also driven by the already established medical infrastructure in the United States and Canada, which offers cutting-edge medical facilities, medical reimbursements, and the presence of numerous insurance providers, enabling patients to receive high-quality care.
It is projected that the booming research and development industry will encourage the development of surface medications. The US government spent more than USD 607.5 billion on research activities, according to a 2022 report by the National Science Board.
Recent Development:
In January 2021, For the purpose of supplying and disseminating SGX301 companion light devices intended for the treatment of CTCL, Soligenix and Daavlin partnered.
In November 2021, Soligenix, In, a leading biopharmaceutical firm specializing in the development and commercialization of products used in the treatment of rare diseases, announced that the company made great financial advancements in the 3rd quarter of 2021 with exhaustive activities across public health solution and the Specialized Bio Therapeutics segments. The business was aiming to create Hybrid, which can be applied to the CTCL treatment procedure.
Key features of the study:
This proposed research study on Cutaneous t-cell lymphoma (CTCL) therapeutics market provides market size (US$ million), compound annual growth rate (CAGR %) and forecast estimation (2023-2030), considering 2022 as the base year
The research report elucidates potential growth opportunities across different segments/countries and explains attractive investment proposition matrix for Cutaneous t-cell lymphoma (CTCL) therapeutics market
The overall report identifies new investment opportunities, challenges faced by established players, and growth factors to sustain in the Cutaneous t-cell lymphoma (CTCL) therapeutics market
Impact of COVID-19 on cutaneous t-cell lymphoma (CTCL) therapeutics market size, forecast, CAGR, and market dynamics are discussed in detail under the research scope. Detailed insight on cutaneous t-cell lymphoma (CTCL) therapeutics market post-COVID will also be covered.
In order to give the users of this report a comprehensive view on the Cutaneous t-cell lymphoma (CTCL) therapeutics market, we have also included competitive landscape and key innovator analysis for the Cutaneous t-cell lymphoma (CTCL) therapeutics market.
The study encompasses a growth prospect mapping analysis, wherein all the industry segments are benchmarked based on their market size, growth rate and attractiveness.
The report offers detailed company profiling featuring major market participants which will help users to understand their financial information and strategic initiatives of players operating in the cutaneous t-cell lymphoma (CTCL) therapeutics market.
In addition, the report also unveil the important acquisitions & mergers, collaborations & joint ventures, new launch, research & development, regional expansion of major participants involved in the market on global as well as regional level.
The global Cutaneous t-cell lymphoma (CTCL) therapeutics market report primarily caters to various stakeholders in this industry including suppliers, investors, new entrants, distributors, and financial analysts
SCOPE OF THE REPORT
The scope of this report covers the market by its major segments, which include as follows:
GLOBAL CUTANEOUS T-CELL LYMPHOMA (CTCL) THERAPEUTICS MARKET KEY PLAYERS
Sorrento Therapeutics Inc.,
Mallinckrodt plc (Staines-Upon-Thames, U.K.)
Bausch Health (Ortho Dermatologics) (Quebec, Canada)
Helsinn Healthcare SA. (Lugano, Switzerland)
GlaxoSmithKline plc (Stiefel Dermatology) (London, U.K.)
Actelion Pharmaceuticals
Spectrum Pharmaceuticals
Bristol-Myers Squibb
Celgene Corporation
Seattle Genetics
Kyowa Kirin Co., Ltd. (Tokyo, Japan)
Pfizer Inc. (New York, U.S.)
Amgen Inc
Shenzen ChipScreen Biosciences Ltd.
Genmab A/S
Medivir AB
Eisai Inc.
F. Hoffman La-Roche
Merck & Co., Inc. (Kenilworth, U.S.)
GLOBAL CUTANEOUS T-CELL LYMPHOMA (CTCL) THERAPEUTICS MARKET, BY DRUG CLASS
Antineoplastic Agent
Histone Deacetylase (HDAC) Inhibitors
Monoclonal Antibodies
Others (Psoralens, etc.)
GLOBAL CUTANEOUS T-CELL LYMPHOMA (CTCL) THERAPEUTICS MARKET, DISEASE TYPE
Mycosis Fungoides (MF)
Sezary Syndrome (SS)
Others
GLOBAL CUTANEOUS T-CELL LYMPHOMA (CTCL) THERAPEUTICS MARKET, DISTRIBUTION CHANNEL
Hospitals Pharmacies
Retail Pharmacies & Drug Stores
Online Pharmacies
GLOBAL CUTANEOUS T-CELL LYMPHOMA (CTCL) THERAPEUTICS MARKET, BY REGION
North America
The U.S.
Canada
Europe
Germany
France
Italy
Spain
United Kingdom
Russia
Netherlands
Sweden
Poland
Rest of Europe
Asia Pacific
India
China
South Korea
Japan
Australia
Thailand
Indonesia
Philippines
Rest of APAC
Latin America
Brazil
Mexico
Argentina
Colombia
Rest of LATAM
The Middle East and Africa
Saudi Arabia
United Arab Emirates
Israel
Turkey
Algeria
Egypt
Rest of MEA
TABLE OF CONTENT
1. Cutaneous T-cell Lymphoma (CTCL) Therapeutics Overview
- 1.1. Study Scope
2. Executive Summary
- 2.1. Market Snippet
- 2.1.1. Cutaneous T-cell Lymphoma (CTCL) Therapeutics Snippet by Drug Class
- 2.1.2. Cutaneous T-cell Lymphoma (CTCL) Therapeutics Snippet by Disease Type
- 2.1.3. Cutaneous T-cell Lymphoma (CTCL) Therapeutics Snippet by Distribution Channel
- 2.1.4. Cutaneous T-cell Lymphoma (CTCL) Therapeutics Snippet by Country
- 2.1.5. Cutaneous T-cell Lymphoma (CTCL) Therapeutics Snippet by Region
- 2.2. Competitive Insights
3. Immersion Cooling Key Market Trends
- 3.1. Cutaneous T-cell Lymphoma (CTCL) Therapeutics Drivers
- 3.1.1. Impact Analysis of Market Drivers
- 3.2. Cutaneous T-cell Lymphoma (CTCL) Therapeutics Restraints
- 3.2.1. Impact Analysis of Market Restraints
- 3.3. Cutaneous T-cell Lymphoma (CTCL) Therapeutics Opportunities
- 3.4. Cutaneous T-cell Lymphoma (CTCL) Therapeutics Future Trends
4. Immersion Cooling Industry Study
- 4.1. PEST Analysis
- 4.2. Porter's Five Forces Analysis
- 4.3. Growth Prospect Mapping
- 4.4. Regulatory Framework Analysis
5. Immersion Cooling Market: COVID-19 Impact Analysis
- 5.1. Pre-COVID-19 Impact Analysis
- 5.2. Post-COVID-19 Impact Analysis
- 5.2.1. Top Performing Segments
- 5.2.2. Marginal Growth Segments
- 5.2.3. Top Looser Segments
- 5.2.4. Marginal Loss Segments
6. Cutaneous T-cell Lymphoma (CTCL) Therapeutics Landscape
- 6.1. Cutaneous T-cell Lymphoma (CTCL) Therapeutics Share Analysis, 2022
- 6.2. Breakdown Data, by Key Manufacturer
- 6.2.1. Established Players' Analysis
- 6.2.2. Emerging Players' Analysis
7. Cutaneous T-cell Lymphoma (CTCL) Therapeutics - By Drug Class
- 7.1. Overview
- 7.1.1. Segment Share Analysis, By Drug Class, 2022 & 2030 (%)
- 7.1.2. Antineoplastic Agent
- 7.1.3. Histone Deacetylase (HDAC) Inhibitors
- 7.1.4. Monoclonal Antibodies
- 7.1.5. Others (Psoralens, etc.)
8. Cutaneous T-cell Lymphoma (CTCL) Therapeutics - By Disease Type
- 8.1. Overview
- 8.1.1. Segment Share Analysis, By Disease Type, 2022 & 2030 (%)
- 8.1.2. Mycosis Fungoides (MF)
- 8.1.3. Sezary Syndrome (SS)
- 8.1.4. Others
9. Cutaneous T-cell Lymphoma (CTCL) Therapeutics - By Distribution Channel
- 9.1. Overview
- 9.1.1. Segment Share Analysis, By Distribution Channel, 2022 & 2030 (%)
- 9.1.2. Hospitals Pharmacies
- 9.1.3. Retail Pharmacies & Drug Stores
- 9.1.4. Online Pharmacies
Immersion Cooling Market- By Geography
- 9.2. Introduction
- 9.2.1. Segment Share Analysis, By Geography, 2022 & 2030 (%)
- 9.3. North America
- 9.3.1. Overview
- 9.3.2. Immersion Cooling Key Manufacturers in North America
- 9.3.3. North America Market Size and Forecast, By Country, 2018 - 2030 (US$ Million)
- 9.3.4. North America Market Size and Forecast, By Drug Class, 2018 - 2030 (US$ Million)
- 9.3.5. North America Market Size and Forecast, By Disease Type, 2018 - 2030 (US$ Million)
- 9.3.6. North America Market Size and Forecast, By Distribution Channel, 2018 - 2030 (US$ Million)
- 9.3.7. U.S.
- 9.3.7.1. Overview
- 9.3.7.2. Market Analysis, Forecast, and Y-O-Y Growth Rate, 2018 - 2030, (US$ Million)
- 9.3.7.3. U.S. Market Size and Forecast, By Drug Class, 2018 - 2030 (US$ Million)
- 9.3.7.4. U.S. Market Size and Forecast, By Disease Type, 2018 - 2030 (US$ Million)
- 9.3.7.5. U.S. Market Size and Forecast, By Distribution Channel, 2018 - 2030 (US$ Million)
- 9.3.8. Canada
- 9.3.8.1. Overview
- 9.3.8.2. Market Analysis, Forecast, and Y-O-Y Growth Rate, 2018 - 2030, (US$ Million)
- 9.3.8.3. Canada Market Size and Forecast, By Drug Class, 2018 - 2030 (US$ Million)
- 9.3.8.4. Canada Market Size and Forecast, By Disease Type, 2018 - 2030 (US$ Million)
- 9.3.8.5. Canada Market Size and Forecast, By Distribution Channel, 2018 - 2030 (US$ Million)
- 9.4. Europe
- 9.4.1. Overview
- 9.4.2. Immersion Cooling Key Manufacturers in Europe
- 9.4.3. Europe Market Size and Forecast, By Country, 2018 - 2030 (US$ Million)
- 9.4.4. Europe Market Size and Forecast, By Drug Class, 2018 - 2030 (US$ Million)
- 9.4.5. Europe Market Size and Forecast, By Disease Type, 2018 - 2030 (US$ Million)
- 9.4.6. Europe Market Size and Forecast, By Distribution Channel, 2018 - 2030 (US$ Million)
- 9.4.7. Germany
- 9.4.7.1. Overview
- 9.4.7.2. Market Analysis, Forecast, and Y-O-Y Growth Rate, 2018 - 2030, (US$ Million)
- 9.4.7.3. Germany Market Size and Forecast, By Drug Class, 2018 - 2030 (US$ Million)
- 9.4.7.4. Germany Market Size and Forecast, By Disease Type, 2018 - 2030 (US$ Million)
- 9.4.7.5. Germany Market Size and Forecast, By Distribution Channel, 2018 - 2030 (US$ Million)
- 9.4.8. Italy
- 9.4.8.1. Overview
- 9.4.8.2. Market Analysis, Forecast, and Y-O-Y Growth Rate, 2018 - 2030, (US$ Million)
- 9.4.8.3. Italy Market Size and Forecast, By Drug Class, 2018 - 2030 (US$ Million)
- 9.4.8.4. Italy Market Size and Forecast, By Disease Type, 2018 - 2030 (US$ Million)
- 9.4.8.5. Italy Market Size and Forecast, By Distribution Channel, 2018 - 2030 (US$ Million)
- 9.4.9. United Kingdom
- 9.4.9.1. Overview
- 9.4.9.2. Market Analysis, Forecast, and Y-O-Y Growth Rate, 2018 - 2030, (US$ Million)
- 9.4.9.3. United Kingdom Market Size and Forecast, By Drug Class, 2018 - 2030 (US$ Million)
- 9.4.9.4. United Kingdom Market Size and Forecast, By Disease Type, 2018 - 2030 (US$ Million)
- 9.4.9.5. United Kingdom Market Size and Forecast, By Distribution Channel, 2018 - 2030 (US$ Million)
- 9.4.10. France
- 9.4.10.1. Overview
- 9.4.10.2. Market Analysis, Forecast, and Y-O-Y Growth Rate, 2018 - 2030, (US$ Million)
- 9.4.10.3. France Market Size and Forecast, By Drug Class, 2018 - 2030 (US$ Million)
- 9.4.10.4. France Market Size and Forecast, By Disease Type, 2018 - 2030 (US$ Million)
- 9.4.10.5. France Market Size and Forecast, By Distribution Channel, 2018 - 2030 (US$ Million)
- 9.4.11. Russia
- 9.4.11.1. Market Analysis, Forecast, and Y-O-Y Growth Rate, 2018 - 2030, (US$ Million)
- 9.4.11.2. Russia Market Size and Forecast, By Drug Class, 2018 - 2030 (US$ Million)
- 9.4.11.3. Russia Market Size and Forecast, By Disease Type, 2018 - 2030 (US$ Million)
- 9.4.11.4. Russia Market Size and Forecast, By Distribution Channel, 2018 - 2030 (US$ Million)
- 9.4.12. Netherlands
- 9.4.12.1. Market Analysis, Forecast, and Y-O-Y Growth Rate, 2018 - 2030, (US$ Million)
- 9.4.12.2. Netherlands Market Size and Forecast, By Drug Class, 2018 - 2030 (US$ Million)
- 9.4.12.3. Netherlands Market Size and Forecast, By Disease Type, 2018 - 2030 (US$ Million)
- 9.4.12.4. Netherlands Market Size and Forecast, By Distribution Channel, 2018 - 2030 (US$ Million)
- 9.4.13. Sweden
- 9.4.13.1. Market Analysis, Forecast, and Y-O-Y Growth Rate, 2018 - 2030, (US$ Million)
- 9.4.13.2. Sweden Market Size and Forecast, By Drug Class, 2018 - 2030 (US$ Million)
- 9.4.13.3. Sweden Market Size and Forecast, By Disease Type, 2018 - 2030 (US$ Million)
- 9.4.13.4. Sweden Market Size and Forecast, By Distribution Channel, 2018 - 2030 (US$ Million)
- 9.4.14. Poland
- 9.4.14.1. Market Analysis, Forecast, and Y-O-Y Growth Rate, 2018 - 2030, (US$ Million)
- 9.4.14.2. Poland Market Size and Forecast, By Drug Class, 2018 - 2030 (US$ Million)
- 9.4.14.3. Poland Market Size and Forecast, By Disease Type, 2018 - 2030 (US$ Million)
- 9.4.14.4. Poland Market Size and Forecast, By Distribution Channel, 2018 - 2030 (US$ Million)
- 9.4.15. Rest of Europe
- 9.4.15.1. Overview
- 9.4.15.2. Market Analysis, Forecast, and Y-O-Y Growth Rate, 2018 - 2030, (US$ Million)
- 9.4.15.3. Rest of the Europe Market Size and Forecast, By Drug Class, 2018 - 2030 (US$ Million)
- 9.4.15.4. Rest of the Europe Market Size and Forecast, By Disease Type, 2018 - 2030 (US$ Million)
- 9.4.15.5. Rest of the Europe Market Size and Forecast, By Distribution Channel, 2018 - 2030 (US$ Million)
- 9.5. Asia Pacific (APAC)
- 9.5.1. Overview
- 9.5.2. Immersion Cooling Key Manufacturers in Asia Pacific
- 9.5.3. Asia Pacific Market Size and Forecast, By Country, 2018 - 2030 (US$ Million)
- 9.5.4. Asia Pacific Market Size and Forecast, By Drug Class, 2018 - 2030 (US$ Million)
- 9.5.5. Asia Pacific Market Size and Forecast, By Disease Type, 2018 - 2030 (US$ Million)
- 9.5.6. Asia Pacific Market Size and Forecast, By Distribution Channel, 2018 - 2030 (US$ Million)
- 9.5.7. India
- 9.5.7.1. Overview
- 9.5.7.2. Market Analysis, Forecast, and Y-O-Y Growth Rate, 2018 - 2030, (US$ Million)
- 9.5.7.3. India Market Size and Forecast, By Drug Class, 2018 - 2030 (US$ Million)
- 9.5.7.4. India Market Size and Forecast, By Disease Type, 2018 - 2030 (US$ Million)
- 9.5.7.5. India Market Size and Forecast, By Distribution Channel, 2018 - 2030 (US$ Million)
- 9.5.8. China
- 9.5.8.1. Overview
- 9.5.8.2. Market Analysis, Forecast, and Y-O-Y Growth Rate, 2018 - 2030, (US$ Million)
- 9.5.8.3. China Market Size and Forecast, By Drug Class, 2018 - 2030 (US$ Million)
- 9.5.8.4. China Market Size and Forecast, By Disease Type, 2018 - 2030 (US$ Million)
- 9.5.8.5. China Market Size and Forecast, By Distribution Channel, 2018 - 2030 (US$ Million)
- 9.5.9. Japan
- 9.5.9.1. Overview
- 9.5.9.2. Market Analysis, Forecast, and Y-O-Y Growth Rate, 2018 - 2030, (US$ Million)
- 9.5.9.3. Japan Market Size and Forecast, By Drug Class, 2018 - 2030 (US$ Million)
- 9.5.9.4. Japan Market Size and Forecast, By Disease Type, 2018 - 2030 (US$ Million)
- 9.5.9.5. Japan Market Size and Forecast, By Distribution Channel, 2018 - 2030 (US$ Million)
- 9.5.10. South Korea
- 9.5.10.1. Overview
- 9.5.10.2. Market Analysis, Forecast, and Y-O-Y Growth Rate, 2018 - 2030, (US$ Million)
- 9.5.10.3. South Korea Market Size and Forecast, By Drug Class, 2018 - 2030 (US$ Million)
- 9.5.10.4. South Korea Market Size and Forecast, By Disease Type, 2018 - 2030 (US$ Million)
- 9.5.10.5. South Korea Market Size and Forecast, By Distribution Channel, 2018 - 2030 (US$ Million)
- 9.5.11. Australia
- 9.5.11.1. Overview
- 9.5.11.2. Market Analysis, Forecast, and Y-O-Y Growth Rate, 2018 - 2030, (US$ Million)
- 9.5.11.3. Australia Market Size and Forecast, By Drug Class, 2018 - 2030 (US$ Million)
- 9.5.11.4. Australia Market Size and Forecast, By Disease Type, 2018 - 2030 (US$ Million)
- 9.5.11.5. Australia Market Size and Forecast, By Distribution Channel, 2018 - 2030 (US$ Million)
- 9.5.12. Thailand
- 9.5.12.1. Overview
- 9.5.12.2. Market Analysis, Forecast, and Y-O-Y Growth Rate, 2018 - 2030, (US$ Million)
- 9.5.12.3. Thailand Market Size and Forecast, By Drug Class, 2018 - 2030 (US$ Million)
- 9.5.12.4. Thailand Market Size and Forecast, By Disease Type, 2018 - 2030 (US$ Million)
- 9.5.12.5. Thailand Market Size and Forecast, By Distribution Channel, 2018 - 2030 (US$ Million)
- 9.5.13. Indonesia
- 9.5.13.1. Overview
- 9.5.13.2. Market Analysis, Forecast, and Y-O-Y Growth Rate, 2018 - 2030, (US$ Million)
- 9.5.13.3. Indonesia Market Size and Forecast, By Drug Class, 2018 - 2030 (US$ Million)
- 9.5.13.4. Indonesia Market Size and Forecast, By Disease Type, 2018 - 2030 (US$ Million)
- 9.5.13.5. Indonesia Market Size and Forecast, By Distribution Channel, 2018 - 2030 (US$ Million)
- 9.5.14. Philippines
- 9.5.14.1. Overview
- 9.5.14.2. Market Analysis, Forecast, and Y-O-Y Growth Rate, 2018 - 2030, (US$ Million)
- 9.5.14.3. Philippines Market Size and Forecast, By Drug Class, 2018 - 2030 (US$ Million)
- 9.5.14.4. Philippines Market Size and Forecast, By Disease Type, 2018 - 2030 (US$ Million)
- 9.5.14.5. Philippines Market Size and Forecast, By Distribution Channel, 2018 - 2030 (US$ Million)
- 9.5.15. Rest of APAC
- 9.5.15.1. Overview
- 9.5.15.2. Market Analysis, Forecast, and Y-O-Y Growth Rate, 2018 - 2030, (US$ Million)
- 9.5.15.3. Rest of APAC Market Size and Forecast, By Drug Class, 2018 - 2030 (US$ Million)
- 9.5.15.4. Rest of APAC Market Size and Forecast, By Disease Type, 2018 - 2030 (US$ Million)
- 9.5.15.5. Rest of APAC Market Size and Forecast, By Distribution Channel, 2018 - 2030 (US$ Million)
- 9.6. Latin America
- 9.6.1. Overview
- 9.6.2. Immersion Cooling Key Manufacturers in Latin America
- 9.6.3. Latin America Market Size and Forecast, By Country, 2018 - 2030 (US$ Million)
- 9.6.4. Latin America Market Size and Forecast, By Drug Class, 2018 - 2030 (US$ Million)
- 9.6.5. Latin America Market Size and Forecast, By Disease Type, 2018 - 2030 (US$ Million)
- 9.6.6. Latin America Market Size and Forecast, By Distribution Channel, 2018 - 2030 (US$ Million)
- 9.6.7. Brazil
- 9.6.7.1. Overview
- 9.6.7.2. Market Analysis, Forecast, and Y-O-Y Growth Rate, 2018 - 2030, (US$ Million)
- 9.6.7.3. Brazil Market Size and Forecast, By Drug Class, 2018 - 2030 (US$ Million)
- 9.6.7.4. Brazil Market Size and Forecast, By Disease Type, 2018 - 2030 (US$ Million)
- 9.6.7.5. Brazil Market Size and Forecast, By Distribution Channel, 2018 - 2030 (US$ Million)
- 9.6.8. Mexico
- 9.6.8.1. Overview
- 9.6.8.2. Market Analysis, Forecast, and Y-O-Y Growth Rate, 2018 - 2030, (US$ Million)
- 9.6.8.3. Mexico Market Size and Forecast, By Drug Class, 2018 - 2030 (US$ Million)
- 9.6.8.4. Mexico Market Size and Forecast, By Disease Type, 2018 - 2030 (US$ Million)
- 9.6.8.5. Mexico Market Size and Forecast, By Distribution Channel, 2018 - 2030 (US$ Million)
- 9.6.9. Argentina
- 9.6.9.1. Overview
- 9.6.9.2. Market Analysis, Forecast, and Y-O-Y Growth Rate, 2018 - 2030, (US$ Million)
- 9.6.9.3. Argentina Market Size and Forecast, By Drug Class, 2018 - 2030 (US$ Million)
- 9.6.9.4. Argentina Market Size and Forecast, By Disease Type, 2018 - 2030 (US$ Million)
- 9.6.9.5. Argentina Market Size and Forecast, By Distribution Channel, 2018 - 2030 (US$ Million)
- 9.6.10. Colombia
- 9.6.10.1. Overview
- 9.6.10.2. Market Analysis, Forecast, and Y-O-Y Growth Rate, 2018 - 2030, (US$ Million)
- 9.6.10.3. Colombia Market Size and Forecast, By Drug Class, 2018 - 2030 (US$ Million)
- 9.6.10.4. Colombia Market Size and Forecast, By Disease Type, 2018 - 2030 (US$ Million)
- 9.6.10.5. Colombia Market Size and Forecast, By Distribution Channel, 2018 - 2030 (US$ Million)
- 9.6.11. Rest of LATAM
- 9.6.11.1. Overview
- 9.6.11.2. Market Analysis, Forecast, and Y-O-Y Growth Rate, 2018 - 2030, (US$ Million)
- 9.6.11.3. Rest of LATAM Market Size and Forecast, By Drug Class, 2018 - 2030 (US$ Million)
- 9.6.11.4. Rest of LATAM Market Size and Forecast, By Disease Type, 2018 - 2030 (US$ Million)
- 9.6.11.5. Rest of LATAM Market Size and Forecast, By Distribution Channel, 2018 - 2030 (US$ Million)
- 9.7. Middle East and Africa
- 9.7.1. Overview
- 9.7.2. Immersion Cooling Key Manufacturers in Middle East and Africa
- 9.7.3. Middle East and Africa Market Size and Forecast, By Country, 2018 - 2030 (US$ Million)
- 9.7.4. Middle East and Africa Market Size and Forecast, By Drug Class, 2018 - 2030 (US$ Million)
- 9.7.5. Middle East and Africa Market Size and Forecast, By Disease Type, 2018 - 2030 (US$ Million)
- 9.7.6. Middle East and Africa Market Size and Forecast, By Distribution Channel, 2018 - 2030 (US$ Million)
- 9.7.7. Saudi Arabia
- 9.7.7.1. Overview
- 9.7.7.2. Market Analysis, Forecast, and Y-O-Y Growth Rate, 2018 - 2030, (US$ Million)
- 9.7.7.3. Saudi Arabia Market Size and Forecast, By Drug Class, 2018 - 2030 (US$ Million)
- 9.7.7.4. Saudi Arabia Market Size and Forecast, By Disease Type, 2018 - 2030 (US$ Million)
- 9.7.7.5. Saudi Arabia Market Size and Forecast, By Distribution Channel, 2018 - 2030 (US$ Million)
- 9.7.8. United Arab Emirates
- 9.7.8.1. Overview
- 9.7.8.2. Market Analysis, Forecast, and Y-O-Y Growth Rate, 2018 - 2030, (US$ Million)
- 9.7.8.3. United Arab Emirates Market Size and Forecast, By Drug Class, 2018 - 2030 (US$ Million)
- 9.7.8.4. United Arab Emirates Market Size and Forecast, By Disease Type, 2018 - 2030 (US$ Million)
- 9.7.8.5. United Arab Emirates Market Size and Forecast, By Distribution Channel, 2018 - 2030 (US$ Million)
- 9.7.9. Israel
- 9.7.9.1. Overview
- 9.7.9.2. Market Analysis, Forecast, and Y-O-Y Growth Rate, 2018 - 2030, (US$ Million)
- 9.7.9.3. Israel Market Size and Forecast, By Drug Class, 2018 - 2030 (US$ Million)
- 9.7.9.4. Israel Market Size and Forecast, By Disease Type, 2018 - 2030 (US$ Million)
- 9.7.9.5. Israel Market Size and Forecast, By Distribution Channel, 2018 - 2030 (US$ Million)
- 9.7.10. Turkey
- 9.7.10.1. Overview
- 9.7.10.2. Market Analysis, Forecast, and Y-O-Y Growth Rate, 2018 - 2030, (US$ Million)
- 9.7.10.3. Turkey Market Size and Forecast, By Drug Class, 2018 - 2030 (US$ Million)
- 9.7.10.4. Turkey Market Size and Forecast, By Disease Type, 2018 - 2030 (US$ Million)
- 9.7.10.5. Turkey Market Size and Forecast, By Distribution Channel, 2018 - 2030 (US$ Million)
- 9.7.11. Algeria
- 9.7.11.1. Overview
- 9.7.11.2. Market Analysis, Forecast, and Y-O-Y Growth Rate, 2018 - 2030, (US$ Million)
- 9.7.11.3. Algeria Market Size and Forecast, By Drug Class, 2018 - 2030 (US$ Million)
- 9.7.11.4. Algeria Market Size and Forecast, By Disease Type, 2018 - 2030 (US$ Million)
- 9.7.11.5. Algeria Market Size and Forecast, By Distribution Channel, 2018 - 2030 (US$ Million)
- 9.7.12. Egypt
- 9.7.12.1. Overview
- 9.7.12.2. Market Analysis, Forecast, and Y-O-Y Growth Rate, 2018 - 2030, (US$ Million)
- 9.7.12.3. Egypt Market Size and Forecast, By Drug Class, 2018 - 2030 (US$ Million)
- 9.7.12.4. Egypt Market Size and Forecast, By Disease Type, 2018 - 2030 (US$ Million)
- 9.7.12.5. Egypt Market Size and Forecast, By Distribution Channel, 2018 - 2030 (US$ Million)
- 9.7.13. Rest of MEA
- 9.7.13.1. Overview
- 9.7.13.2. Market Analysis, Forecast, and Y-O-Y Growth Rate, 2018 - 2030, (US$ Million)
- 9.7.13.3. Rest of MEA Market Size and Forecast, By Drug Class, 2018 - 2030 (US$ Million)
- 9.7.13.4. Rest of MEA Market Size and Forecast, By Disease Type, 2018 - 2030 (US$ Million)
- 9.7.13.5. Rest of MEA Market Size and Forecast, By Distribution Channel, 2018 - 2030 (US$ Million)
10. Key Vendor Analysis- Immersion Cooling Industry
- 10.1. Competitive Dashboard
- 10.2. Company Profiles
- 10.2.1. Sorrento Therapeutics Inc.,
- 10.2.2. Mallinckrodt plc (Staines-Upon-Thames, U.K.)
- 10.2.3. Bausch Health (Ortho Dermatologics) (Quebec, Canada)
- 10.2.4. Helsinn Healthcare SA. (Lugano, Switzerland)
- 10.2.5. GlaxoSmithKline plc (Stiefel Dermatology) (London, U.K.)
- 10.2.6. Actelion Pharmaceuticals
- 10.2.7. Spectrum Pharmaceuticals
- 10.2.8. Bristol-Myers Squibb
- 10.2.9. Celgene Corporation
- 10.2.10. Seattle Genetics
- 10.2.11. Kyowa Kirin Co., Ltd. (Tokyo, Japan)
- 10.2.12. Pfizer Inc. (New York, U.S.)
- 10.2.13. Amgen Inc
- 10.2.14. Shenzen ChipScreen Biosciences Ltd.
- 10.2.15. Genmab A/S
- 10.2.16. Medivir AB
- 10.2.17. Eisai Inc.
- 10.2.18. F. Hoffman La-Roche
- 10.2.19. Merck & Co., Inc. (Kenilworth, U.S.)
11. 360 Degree Analyst View
12. Appendix
- 12.1. Research Methodology
- 12.2. References
- 12.3. Abbreviations
- 12.4. Disclaimer
- 12.5. Contact Us