
|
市場調査レポート
商品コード
1645729
疎水性相互作用クロマトグラフィーの世界市場:製品・サービス別、サンプルタイプ別、用途別、エンドユーザー別 - 機会分析と産業予測、2024年~2033年Hydrophobic Interaction Chromatography Market By Product and Service, By Sample type, By Application, By End user : Global Opportunity Analysis and Industry Forecast, 2024-2033 |
||||||
|
|||||||

| 疎水性相互作用クロマトグラフィーの世界市場:製品・サービス別、サンプルタイプ別、用途別、エンドユーザー別 - 機会分析と産業予測、2024年~2033年 |
|
出版日: 2024年12月01日
発行: Allied Market Research
ページ情報: 英文 412 Pages
納期: 2~3営業日
|

- 全表示
- 概要
- 目次
疎水性相互作用クロマトグラフィー市場
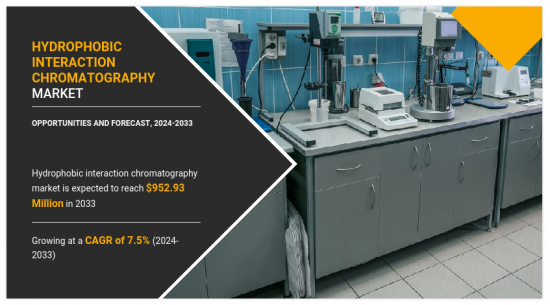
疎水性相互作用クロマトグラフィー市場は、2023年に4億6,189万米ドルとなり、2033年までには9億5,293万米ドルに達すると推定され、2024年から2033年までのCAGRは7.5%です。
疎水性相互作用クロマトグラフィー(HIC)は、タンパク質やその他の生体分子を疎水性によって区別する生体分子分離技術です。HICの動作原理は、移動相のイオン強度の影響下で、タンパク質が据置型上の疎水性基に可逆的に結合することです。この技術は、抗体の単離、タンパク質の精製、バイオテクノロジーや製薬産業における疎水性化合物の分離に応用されています。
疎水性相互作用クロマトグラフィー市場は、医薬品やワクチンの開発プロセスでHICが利用されているため、世界中でバイオ医薬品産業が拡大していることが主な要因となっています。また、政府や民間団体によるバイオテクノロジー・研究分野への投資の増加が市場の成長を後押ししています。疎水性相互作用クロマトグラフィ市場の注目すべき動向は、食品や栄養補助食品業界におけるHICの利用です。タンパク質やペプチドの分離・精製によって味や栄養価を改善するためにHICが利用されています。
しかし、この技術はスケールアップできず、広範な精製要件に対応できないことが市場開拓の妨げとなっています。さらに、HICは比較的時間のかかる技術であり、アフィニティーやイオン交換クロマトグラフィーのような代替技術との厳しい競合に直面しています。これがHICの有用性を低下させ、市場の成長を大きく抑制しています。一方、バイオベンチャー企業の増加やそれらへの投資の急増は、疎水性相互作用クロマトグラフィー市場に有利な成長機会をもたらすと予想されます。McKinseyのデータによると、ベンチャーキャピタルによるバイオ新興企業への投資は、2,016年の2,200社から、2021年には3,100社に増加しました。さらに、新興企業が2021年に世界で集めた資金は340億米ドルを超え、これは2020年の総額160億米ドルの2倍以上です。このような投資の急増により、タンパク質や分子生物学関連の研究が増加し、先進的なHIC装置への需要が高まると予想されます。
セグメントのレビュー
疎水性相互作用クロマトグラフィー市場は、製品・サービス、サンプルタイプ、用途、エンドユーザー、地域に区分されます。製品・サービス別では、市場は製品とサービスに二分されます。製品セグメントはさらに樹脂、バッファー、カラム、その他に分類されます。樹脂セグメントはさらにビーズとその他に二分されます。カラムセグメントはさらに、プレパックドカラムと空カラムに分けられます。プレパックドカラムセグメントは、さらにディスポーザブルとリユーザブルに分類されます。サンプルタイプにより、市場はモノクローナル抗体、ワクチン、細胞培養サンプル、血漿・血清サンプル、その他に分類されます。用途別では、タンパク質・抗体精製、ワクチン開発、創薬、食品・栄養補助食品開発に分類されます。タンパク質・抗体精製分野は、さらに樹脂別にビーズとその他に分類されます。エンドユーザー別では、製薬・バイオ医薬品企業、受託研究機関・受託製造機関、研究・学術機関、その他に分類されます。地域別では、市場は北米(米国、カナダ、メキシコ)、欧州(ドイツ、フランス、英国、イタリア、スペイン、その他欧州地域)、アジア太平洋(日本、中国、インド、オーストラリア、韓国、その他アジア太平洋)、ラテンアメリカ、中東・アフリカ(ブラジル、中国、インド、オーストラリア、韓国、その他ラテンアメリカ、中東・アフリカ)に分析されます。
主な調査結果
製品・サービス別では、製品セグメントが2023年の市場シェアを独占しました。
サンプルタイプ別では、モノクローナル抗体分野が高いシェアを占めました。
用途別では、タンパク質・抗体精製分野が2023年に最も高い市場シェアを占めました。
エンドユーザー別では、製薬・バイオ製薬企業が2023年に最も高いシェアを占めました。
地域別では、北米が2023年に最も高い収益を上げました。
利害関係者にとっての主なメリット
当レポートは、2023年から2033年までの疎水性相互作用クロマトグラフィー市場分析の市場セグメント、現在の動向、推定・動向分析を定量的に提供し、優勢な疎水性相互作用クロマトグラフィー市場機会を特定します。
市場促進要因、市場抑制要因、市場機会に関連する情報とともに市場調査を提供します。
ポーターのファイブフォース分析では、利害関係者が利益重視のビジネス決定を下し、サプライヤーとバイヤーのネットワークを強化できるよう、バイヤーとサプライヤーの潜在力を明らかにします。
疎水性相互作用クロマトグラフィー市場のセグメンテーションを詳細に分析することで、市場機会を見極めることができます。
各地域の主要国は、世界市場への収益貢献度に応じてマッピングされています。
市場企業のポジショニングはベンチマーキングを容易にし、市場企業の現在のポジションを明確に理解することができます。
地域別および世界の疎水性相互作用クロマトグラフィーの市場動向、主要企業、市場セグメント、応用分野、市場成長戦略の分析を含みます。
本レポートで可能なレポートカスタマイズ(追加費用とスケジュールがあります。)
- 国、地域、世界レベルでの患者/疫学データ
- 規制ガイドライン
- クライアントの関心に応じた追加企業プロファイル
- 国別または地域別の追加分析-市場規模と予測
- 企業プロファイルの拡張リスト
- 過去の市場データ
- SWOT分析
目次
第1章 イントロダクション
第2章 エグゼクティブサマリー
第3章 市場概要
- 市場の定義と範囲
- 主要な調査結果
- 主要な影響要因
- 主要な投資機会
- ポーターのファイブフォース分析
- 市場力学
- 促進要因
- バイオ医薬品の研究開発費の増加
- 生物製剤とモノクローナル抗体(mAbs)の需要増加
- バイオシミラーの採用増加
- 抑制要因
- 熟練した労働力の不足
- 高い初期投資と運営コスト
- 機会
- 新興市場における成長機会
- 疎水性相互作用クロマトグラフィー(HIC)の技術的進歩
- 促進要因
第4章 疎水性相互作用クロマトグラフィー市場:製品・サービス別
- 概要
- 製品
- 製品タイプ別疎水性相互作用クロマトグラフィー市場
- 樹脂疎水性相互作用クロマトグラフィー市場:タイプ別
- カラム疎水性相互作用クロマトグラフィー市場:タイプ別
- 充填済みカラム疎水性相互作用クロマトグラフィー市場:タイプ別
- 製品タイプ別疎水性相互作用クロマトグラフィー市場
- サービス
第5章 疎水性相互作用クロマトグラフィー市場:サンプルタイプ別
- 概要
- モノクローナル抗体
- ワクチン
- 細胞培養サンプル
- 血漿・血清サンプル
- その他
第6章 疎水性相互作用クロマトグラフィー市場:用途別
- 概要
- タンパク質・抗体精製
- タンパク質・抗体精製の疎水性相互作用クロマトグラフィー市場:樹脂別
- ワクチン開発
- 創薬
- 食品・栄養補助食品開発
第7章 疎水性相互作用クロマトグラフィー市場:エンドユーザー別
- 概要
- 製薬・バイオ医薬品企業
- 受託研究機関・受託製造機関
- 研究・学術機関
- その他
第8章 疎水性相互作用クロマトグラフィー市場:地域別
- 概要
- 北米
- 米国
- カナダ
- メキシコ
- 欧州
- ドイツ
- フランス
- 英国
- イタリア
- スペイン
- その他
- アジア太平洋
- 日本
- 中国
- インド
- オーストラリア
- 韓国
- その他
- ラテンアメリカ、中東・アフリカ
- ブラジル
- 南アフリカ
- サウジアラビア
- その他
第9章 競争情勢
- イントロダクション
- 主要成功戦略
- 主要10社の製品マッピング
- 競合ダッシュボード
- 競合ヒートマップ
- 主要企業のポジショニング、2023年
第10章 企業プロファイル
- Bio-Rad Laboratories, Inc.
- Sartorius AG
- Thermo Fisher Scientific Inc.
- Tosoh Corporation
- Geno Technology, Inc.
- Danaher Corporation
- Sepax Technologies, Inc.
- Agilent Technologies, Inc.
- Merck KGaA
- Waters Corporation
- KNAUER Wissenschaftliche Gerate GmbH
Hydrophobic Interaction Chromatography Market
The hydrophobic interaction chromatography market was valued at $461.89 million in 2023 and is estimated to reach $952.93 million by 2033, exhibiting a CAGR of 7.5% from 2024 to 2033.
Hydrophobic interaction chromatography (HIC) is a biomolecular separation technique that differentiates proteins and other biomolecules depending on their hydrophobicity. The working principle of HIC involves the reversible binding of proteins to hydrophobic groups on a stationary phase, under the influence of ionic strength of a mobile phase. The technique finds application in antibody isolation, protein purification, and separation of hydrophobic compounds in biotechnological & pharmaceutical industries.
The expanding biopharmaceutical industry across the globe is a key driver of the hydrophobic interaction chromatography market as it utilizes HIC in the development process of medicines and vaccines. In addition, rise in investments in the biotechnology & research sector by governments and private organizations has propelled the growth of the market. A notable trend acquiring traction in the hydrophobic interaction chromatography market is the use of HIC in the food and dietary supplement industries. They utilize HIC to improve taste and nutritional value by the separation & purification of proteins and peptides.
However, the inability of the technique scale-up and cater to extensive purification requirements hampers the development of the market. Furthermore, HIC is a relatively time-consuming technique and faces stringent competition from alternatives such as affinity & ion-exchange chromatography. This reduces the utility of HIC and restrains the market growth significantly. On the contrary, increase in the number of biotech start-ups and surge in investments in them is expected to present lucrative growth opportunities for the hydrophobic interaction chromatography market. McKinsey data states that investments by venture capital firms increased from 2,200 biotech start-ups globally in 2,016 to 3,100 in 2021. Moreover, the start-ups collected more than $34 billion globally in 2021, which was more than double the 2020 total of $16 billion. This upsurge in investments is anticipated to increase protein- and molecular biology-related research, fueling the requirement for advanced HIC equipment.
Segment Review
The hydrophobic interaction chromatography market is segmented into product & service, sample type, application, end user, and region. By product & service, the market is bifurcated into product and service. The product segment is further categorized into resin, buffer, column, and others. The resin segment is further bifurcated into beads and others. The column segment is further divided into pre-packed columns and empty columns. The pre-packed column segment is further categorized into disposable and reusable. Depending on sample type, the market is segregated into monoclonal antibodies, vaccines, cell culture sample, plasma & serum sample, and others. As per application, it is classified into protein & antibody purification, vaccine development, drug discovery, and food & dietary supplement development. The protein & antibody purification segment is further categorized for resins into beads and others. According to end user, the market is categorized into pharmaceutical & biopharmaceutical companies, contract research organizations & contract manufacturing organizations, research & academic institutes, and others. Region wise, the market is analyzed across North America (U.S., Canada, and Mexico), Europe (Germany, France, the UK, Italy, Spain, and rest of Europe), Asia-Pacific (Japan, China, India, Australia, South Korea, and rest of Asia-Pacific), and LAMEA (Brazil, South Africa, Saudi Arabia, and rest of LAMEA).
Key Findings
By product & service, the product segment dominated the market share in 2023.
Depending on sample type, the monoclonal antibodies segment held a high share of the market.
As per application, the protein & antibody purification segment accounted for the highest market share in 2023.
According to end user, the pharmaceutical & biopharmaceutical companies segment was the highest shareholder in 2023.
Region wise, North America was the highest revenue generator in 2023.
Competition Analysis
The major players operating in the global hydrophobic interaction chromatography market are Bio-Rad Laboratories, Inc., Sartorius AG, Thermo Fisher Scientific Inc., Tosoh Corporation, Danaher Corporation, Sepax Technologies, Inc., Agilent Technologies, Inc., Merck KGaA, Waters Corporation, and KNAUER Wissenschaftliche Gerate GmbH. These major players have adopted integration, product launch, contract, partnership, and expansion as their key strategies to expand their product portfolio.
Key Benefits for Stakeholders
This report provides a quantitative analysis of the market segments, current trends, estimations, and dynamics of the hydrophobic interaction chromatography market analysis from 2023 to 2033 to identify the prevailing hydrophobic interaction chromatography market opportunities.
The market research is offered along with information related to key drivers, restraints, and opportunities.
Porter's five forces analysis highlights the potency of buyers and suppliers to enable stakeholders make profit-oriented business decisions and strengthen their supplier-buyer network.
In-depth analysis of the hydrophobic interaction chromatography market segmentation assists to determine the prevailing market opportunities.
Major countries in each region are mapped according to their revenue contribution to the global market.
Market player positioning facilitates benchmarking and provides a clear understanding of the present position of the market players.
The report includes the analysis of the regional as well as global hydrophobic interaction chromatography market trends, key players, market segments, application areas, and market growth strategies.
Additional benefits you will get with this purchase are:
- Quarterly Update and* (only available with a corporate license, on listed price)
- 5 additional Company Profile of client Choice pre- or Post-purchase, as a free update.
- Free Upcoming Version on the Purchase of Five and Enterprise User License.
- 16 analyst hours of support* (post-purchase, if you find additional data requirements upon review of the report, you may receive support amounting to 16 analyst hours to solve questions, and post-sale queries)
- 15% Free Customization* (in case the scope or segment of the report does not match your requirements, 15% is equivalent to 3 working days of free work, applicable once)
- Free data Pack on the Five and Enterprise User License. (Excel version of the report)
- Free Updated report if the report is 6-12 months old or older.
- 24-hour priority response*
- Free Industry updates and white papers.
Possible Customization with this report (with additional cost and timeline, please talk to the sales executive to know more)
- Patient/epidemiology data at country, region, global level
- Regulatory Guidelines
- Additional company profiles with specific to client's interest
- Additional country or region analysis- market size and forecast
- Expanded list for Company Profiles
- Historic market data
- SWOT Analysis
Key Market Segments
By Product and Service
- Product
- Type
- Resin
◦ Type
- Buffer
- Column
◦ Type
- Others
- Service
By Sample type
- Monoclonal antibodies
- Vaccines
- Cell culture sample
- Plasma and serum sample
- Others
By Application
- Protein and antibody purification
- Resins
- Beads
- Others
- Vaccine development
- Drug discovery
- Food and dietary supplement development
By End user
- Research and academic institutes
- Others
- Pharmaceutical and biopharmaceutical companies
- Contract research organizations and contract manufacturing organizations
By Region
- North America
- U.S.
- Canada
- Mexico
- Europe
- Germany
- France
- UK
- Italy
- Spain
- Rest of Europe
- Asia-Pacific
- Japan
- China
- India
- Australia
- South Korea
- Rest of Asia-Pacific
- LAMEA
- Brazil
- South Africa,
- Saudi Arabia
- Rest of LAMEA
Key Market Players:
- Sepax Technologies, Inc.
- Tosoh Corporation
- Agilent Technologies, Inc.
- Thermo Fisher Scientific Inc.
- Danaher Corporation
- Merck KGaA
- Geno Technology, Inc.
- Waters Corporation
- KNAUER Wissenschaftliche Gerate GmbH
- Bio-Rad Laboratories, Inc.
- Sartorius AG
TABLE OF CONTENTS
CHAPTER 1: INTRODUCTION
- 1.1. Report description
- 1.2. Key market segments
- 1.3. Key benefits to the stakeholders
- 1.4. Research methodology
- 1.4.1. Primary research
- 1.4.2. Secondary research
- 1.4.3. Analyst tools and models
CHAPTER 2: EXECUTIVE SUMMARY
- 2.1. CXO perspective
CHAPTER 3: MARKET OVERVIEW
- 3.1. Market definition and scope
- 3.2. Key findings
- 3.2.1. Top impacting factors
- 3.2.2. Top investment pockets
- 3.3. Porter's five forces analysis
- 3.3.1. Moderate intensity of rivalry
- 3.3.2. Moderate bargaining power of buyers
- 3.3.3. Moderate threat of new entrants
- 3.3.4. Moderate bargaining power of suppliers
- 3.3.5. Moderate threat of substitutes
- 3.4. Market dynamics
- 3.4.1. Drivers
- 3.4.1.1. Increase in R&D expenditure in biopharmaceuticals
- 3.4.1.2. Rise in demand for biologics and monoclonal antibodies (mAbs)
- 3.4.1.3. Rise in adoption of biosimilars
- 3.4.2. Restraints
- 3.4.2.1. Lack of a skilled workforce
- 3.4.2.2. High initial investment and operating costs
- 3.4.3. Opportunities
- 3.4.3.1. Growth opportunities in emerging markets
- 3.4.3.2. Technological advancements in hydrophobic interaction chromatography (HIC)
- 3.4.1. Drivers
CHAPTER 4: HYDROPHOBIC INTERACTION CHROMATOGRAPHY MARKET, BY PRODUCT AND SERVICE
- 4.1. Overview
- 4.1.1. Market size and forecast
- 4.2. Product
- 4.2.1. Key market trends, growth factors and opportunities
- 4.2.2. Market size and forecast, by region
- 4.2.3. Market share analysis by country
- 4.2.4. Product Hydrophobic Interaction Chromatography Market by Type
- 4.2.4.1. Resin Hydrophobic Interaction Chromatography Market by Type
- 4.2.4.2. Column Hydrophobic Interaction Chromatography Market by Type
- 4.2.4.2.1. Pre packed Columns Hydrophobic Interaction Chromatography Market by Type
- 4.3. Service
- 4.3.1. Key market trends, growth factors and opportunities
- 4.3.2. Market size and forecast, by region
- 4.3.3. Market share analysis by country
CHAPTER 5: HYDROPHOBIC INTERACTION CHROMATOGRAPHY MARKET, BY SAMPLE TYPE
- 5.1. Overview
- 5.1.1. Market size and forecast
- 5.2. Monoclonal antibodies
- 5.2.1. Key market trends, growth factors and opportunities
- 5.2.2. Market size and forecast, by region
- 5.2.3. Market share analysis by country
- 5.3. Vaccines
- 5.3.1. Key market trends, growth factors and opportunities
- 5.3.2. Market size and forecast, by region
- 5.3.3. Market share analysis by country
- 5.4. Cell culture sample
- 5.4.1. Key market trends, growth factors and opportunities
- 5.4.2. Market size and forecast, by region
- 5.4.3. Market share analysis by country
- 5.5. Plasma and serum sample
- 5.5.1. Key market trends, growth factors and opportunities
- 5.5.2. Market size and forecast, by region
- 5.5.3. Market share analysis by country
- 5.6. Others
- 5.6.1. Key market trends, growth factors and opportunities
- 5.6.2. Market size and forecast, by region
- 5.6.3. Market share analysis by country
CHAPTER 6: HYDROPHOBIC INTERACTION CHROMATOGRAPHY MARKET, BY APPLICATION
- 6.1. Overview
- 6.1.1. Market size and forecast
- 6.2. Protein and antibody purification
- 6.2.1. Key market trends, growth factors and opportunities
- 6.2.2. Market size and forecast, by region
- 6.2.3. Market share analysis by country
- 6.2.4. Protein and antibody purification Hydrophobic Interaction Chromatography Market by Resins
- 6.3. Vaccine development
- 6.3.1. Key market trends, growth factors and opportunities
- 6.3.2. Market size and forecast, by region
- 6.3.3. Market share analysis by country
- 6.4. Drug discovery
- 6.4.1. Key market trends, growth factors and opportunities
- 6.4.2. Market size and forecast, by region
- 6.4.3. Market share analysis by country
- 6.5. Food and dietary supplement development
- 6.5.1. Key market trends, growth factors and opportunities
- 6.5.2. Market size and forecast, by region
- 6.5.3. Market share analysis by country
CHAPTER 7: HYDROPHOBIC INTERACTION CHROMATOGRAPHY MARKET, BY END USER
- 7.1. Overview
- 7.1.1. Market size and forecast
- 7.2. Pharmaceutical and biopharmaceutical companies
- 7.2.1. Key market trends, growth factors and opportunities
- 7.2.2. Market size and forecast, by region
- 7.2.3. Market share analysis by country
- 7.3. Contract research organizations and contract manufacturing organizations
- 7.3.1. Key market trends, growth factors and opportunities
- 7.3.2. Market size and forecast, by region
- 7.3.3. Market share analysis by country
- 7.4. Research and academic institutes
- 7.4.1. Key market trends, growth factors and opportunities
- 7.4.2. Market size and forecast, by region
- 7.4.3. Market share analysis by country
- 7.5. Others
- 7.5.1. Key market trends, growth factors and opportunities
- 7.5.2. Market size and forecast, by region
- 7.5.3. Market share analysis by country
CHAPTER 8: HYDROPHOBIC INTERACTION CHROMATOGRAPHY MARKET, BY REGION
- 8.1. Overview
- 8.1.1. Market size and forecast By Region
- 8.2. North America
- 8.2.1. Key market trends, growth factors and opportunities
- 8.2.2. Market size and forecast, by Product and Service
- 8.2.3. Market size and forecast, by Sample type
- 8.2.4. Market size and forecast, by Application
- 8.2.5. Market size and forecast, by End user
- 8.2.6. Market size and forecast, by country
- 8.2.6.1. U.S.
- 8.2.6.1.1. Market size and forecast, by Product and Service
- 8.2.6.1.2. Market size and forecast, by Sample type
- 8.2.6.1.3. Market size and forecast, by Application
- 8.2.6.1.4. Market size and forecast, by End user
- 8.2.6.2. Canada
- 8.2.6.2.1. Market size and forecast, by Product and Service
- 8.2.6.2.2. Market size and forecast, by Sample type
- 8.2.6.2.3. Market size and forecast, by Application
- 8.2.6.2.4. Market size and forecast, by End user
- 8.2.6.3. Mexico
- 8.2.6.3.1. Market size and forecast, by Product and Service
- 8.2.6.3.2. Market size and forecast, by Sample type
- 8.2.6.3.3. Market size and forecast, by Application
- 8.2.6.3.4. Market size and forecast, by End user
- 8.3. Europe
- 8.3.1. Key market trends, growth factors and opportunities
- 8.3.2. Market size and forecast, by Product and Service
- 8.3.3. Market size and forecast, by Sample type
- 8.3.4. Market size and forecast, by Application
- 8.3.5. Market size and forecast, by End user
- 8.3.6. Market size and forecast, by country
- 8.3.6.1. Germany
- 8.3.6.1.1. Market size and forecast, by Product and Service
- 8.3.6.1.2. Market size and forecast, by Sample type
- 8.3.6.1.3. Market size and forecast, by Application
- 8.3.6.1.4. Market size and forecast, by End user
- 8.3.6.2. France
- 8.3.6.2.1. Market size and forecast, by Product and Service
- 8.3.6.2.2. Market size and forecast, by Sample type
- 8.3.6.2.3. Market size and forecast, by Application
- 8.3.6.2.4. Market size and forecast, by End user
- 8.3.6.3. UK
- 8.3.6.3.1. Market size and forecast, by Product and Service
- 8.3.6.3.2. Market size and forecast, by Sample type
- 8.3.6.3.3. Market size and forecast, by Application
- 8.3.6.3.4. Market size and forecast, by End user
- 8.3.6.4. Italy
- 8.3.6.4.1. Market size and forecast, by Product and Service
- 8.3.6.4.2. Market size and forecast, by Sample type
- 8.3.6.4.3. Market size and forecast, by Application
- 8.3.6.4.4. Market size and forecast, by End user
- 8.3.6.5. Spain
- 8.3.6.5.1. Market size and forecast, by Product and Service
- 8.3.6.5.2. Market size and forecast, by Sample type
- 8.3.6.5.3. Market size and forecast, by Application
- 8.3.6.5.4. Market size and forecast, by End user
- 8.3.6.6. Rest of Europe
- 8.3.6.6.1. Market size and forecast, by Product and Service
- 8.3.6.6.2. Market size and forecast, by Sample type
- 8.3.6.6.3. Market size and forecast, by Application
- 8.3.6.6.4. Market size and forecast, by End user
- 8.4. Asia-Pacific
- 8.4.1. Key market trends, growth factors and opportunities
- 8.4.2. Market size and forecast, by Product and Service
- 8.4.3. Market size and forecast, by Sample type
- 8.4.4. Market size and forecast, by Application
- 8.4.5. Market size and forecast, by End user
- 8.4.6. Market size and forecast, by country
- 8.4.6.1. Japan
- 8.4.6.1.1. Market size and forecast, by Product and Service
- 8.4.6.1.2. Market size and forecast, by Sample type
- 8.4.6.1.3. Market size and forecast, by Application
- 8.4.6.1.4. Market size and forecast, by End user
- 8.4.6.2. China
- 8.4.6.2.1. Market size and forecast, by Product and Service
- 8.4.6.2.2. Market size and forecast, by Sample type
- 8.4.6.2.3. Market size and forecast, by Application
- 8.4.6.2.4. Market size and forecast, by End user
- 8.4.6.3. India
- 8.4.6.3.1. Market size and forecast, by Product and Service
- 8.4.6.3.2. Market size and forecast, by Sample type
- 8.4.6.3.3. Market size and forecast, by Application
- 8.4.6.3.4. Market size and forecast, by End user
- 8.4.6.4. Australia
- 8.4.6.4.1. Market size and forecast, by Product and Service
- 8.4.6.4.2. Market size and forecast, by Sample type
- 8.4.6.4.3. Market size and forecast, by Application
- 8.4.6.4.4. Market size and forecast, by End user
- 8.4.6.5. South Korea
- 8.4.6.5.1. Market size and forecast, by Product and Service
- 8.4.6.5.2. Market size and forecast, by Sample type
- 8.4.6.5.3. Market size and forecast, by Application
- 8.4.6.5.4. Market size and forecast, by End user
- 8.4.6.6. Rest of Asia-Pacific
- 8.4.6.6.1. Market size and forecast, by Product and Service
- 8.4.6.6.2. Market size and forecast, by Sample type
- 8.4.6.6.3. Market size and forecast, by Application
- 8.4.6.6.4. Market size and forecast, by End user
- 8.5. LAMEA
- 8.5.1. Key market trends, growth factors and opportunities
- 8.5.2. Market size and forecast, by Product and Service
- 8.5.3. Market size and forecast, by Sample type
- 8.5.4. Market size and forecast, by Application
- 8.5.5. Market size and forecast, by End user
- 8.5.6. Market size and forecast, by country
- 8.5.6.1. Brazil
- 8.5.6.1.1. Market size and forecast, by Product and Service
- 8.5.6.1.2. Market size and forecast, by Sample type
- 8.5.6.1.3. Market size and forecast, by Application
- 8.5.6.1.4. Market size and forecast, by End user
- 8.5.6.2. South Africa,
- 8.5.6.2.1. Market size and forecast, by Product and Service
- 8.5.6.2.2. Market size and forecast, by Sample type
- 8.5.6.2.3. Market size and forecast, by Application
- 8.5.6.2.4. Market size and forecast, by End user
- 8.5.6.3. Saudi Arabia
- 8.5.6.3.1. Market size and forecast, by Product and Service
- 8.5.6.3.2. Market size and forecast, by Sample type
- 8.5.6.3.3. Market size and forecast, by Application
- 8.5.6.3.4. Market size and forecast, by End user
- 8.5.6.4. Rest of LAMEA
- 8.5.6.4.1. Market size and forecast, by Product and Service
- 8.5.6.4.2. Market size and forecast, by Sample type
- 8.5.6.4.3. Market size and forecast, by Application
- 8.5.6.4.4. Market size and forecast, by End user
CHAPTER 9: COMPETITIVE LANDSCAPE
- 9.1. Introduction
- 9.2. Top winning strategies
- 9.3. Product mapping of top 10 player
- 9.4. Competitive dashboard
- 9.5. Competitive heatmap
- 9.6. Top player positioning, 2023
CHAPTER 10: COMPANY PROFILES
- 10.1. Bio-Rad Laboratories, Inc.
- 10.1.1. Company overview
- 10.1.2. Key executives
- 10.1.3. Company snapshot
- 10.1.4. Operating business segments
- 10.1.5. Product portfolio
- 10.1.6. Business performance
- 10.2. Sartorius AG
- 10.2.1. Company overview
- 10.2.2. Key executives
- 10.2.3. Company snapshot
- 10.2.4. Operating business segments
- 10.2.5. Product portfolio
- 10.2.6. Business performance
- 10.2.7. Key strategic moves and developments
- 10.3. Thermo Fisher Scientific Inc.
- 10.3.1. Company overview
- 10.3.2. Key executives
- 10.3.3. Company snapshot
- 10.3.4. Operating business segments
- 10.3.5. Product portfolio
- 10.3.6. Business performance
- 10.3.7. Key strategic moves and developments
- 10.4. Tosoh Corporation
- 10.4.1. Company overview
- 10.4.2. Key executives
- 10.4.3. Company snapshot
- 10.4.4. Operating business segments
- 10.4.5. Product portfolio
- 10.4.6. Key strategic moves and developments
- 10.5. Geno Technology, Inc.
- 10.5.1. Company overview
- 10.5.2. Key executives
- 10.5.3. Company snapshot
- 10.5.4. Operating business segments
- 10.5.5. Product portfolio
- 10.6. Danaher Corporation
- 10.6.1. Company overview
- 10.6.2. Key executives
- 10.6.3. Company snapshot
- 10.6.4. Operating business segments
- 10.6.5. Product portfolio
- 10.6.6. Business performance
- 10.6.7. Key strategic moves and developments
- 10.7. Sepax Technologies, Inc.
- 10.7.1. Company overview
- 10.7.2. Key executives
- 10.7.3. Company snapshot
- 10.7.4. Operating business segments
- 10.7.5. Product portfolio
- 10.8. Agilent Technologies, Inc.
- 10.8.1. Company overview
- 10.8.2. Key executives
- 10.8.3. Company snapshot
- 10.8.4. Operating business segments
- 10.8.5. Product portfolio
- 10.8.6. Business performance
- 10.9. Merck KGaA
- 10.9.1. Company overview
- 10.9.2. Key executives
- 10.9.3. Company snapshot
- 10.9.4. Operating business segments
- 10.9.5. Product portfolio
- 10.9.6. Business performance
- 10.9.7. Key strategic moves and developments
- 10.10. Waters Corporation
- 10.10.1. Company overview
- 10.10.2. Key executives
- 10.10.3. Company snapshot
- 10.10.4. Operating business segments
- 10.10.5. Product portfolio
- 10.10.6. Business performance
- 10.10.7. Key strategic moves and developments
- 10.11. KNAUER Wissenschaftliche Gerate GmbH
- 10.11.1. Company overview
- 10.11.2. Key executives
- 10.11.3. Company snapshot
- 10.11.4. Operating business segments
- 10.11.5. Product portfolio
