
|
市場調査レポート
商品コード
1641770
スマート廃棄物管理の世界市場:廃棄物タイプ別、方法別、ソース別、製品別 - 機会分析と産業予測、2024年~2032年Smart Waste Management Market By Waste Type, By Method, By Source, By Product : Global Opportunity Analysis and Industry Forecast, 2024-2032 |
||||||
|
|||||||

| スマート廃棄物管理の世界市場:廃棄物タイプ別、方法別、ソース別、製品別 - 機会分析と産業予測、2024年~2032年 |
|
出版日: 2024年12月01日
発行: Allied Market Research
ページ情報: 英文 300 Pages
納期: 2~3営業日
|

- 全表示
- 概要
- 目次
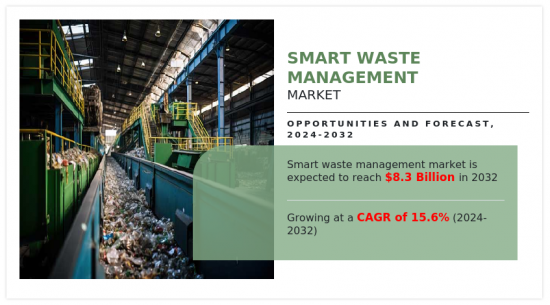
スマート廃棄物管理市場は、2023年に22億米ドルとなり、2024年から2032年までのCAGRは15.6%を示し、2032年までには83億米ドルに達すると推定されます。
スマート廃棄物管理市場は、IoTセンサー、AI主導の分析、自動化などのデジタル技術を活用して、廃棄物の収集、処理、リサイクルを強化します。これは、ルートの最適化、リアルタイムでの廃棄物レベルの監視、資源効率の改善に重点を置き、環境フットプリントの削減につながります。この市場は、よりスマートな意思決定を可能にし、廃棄物管理と資源回収に対するより効率的でデータ主導のアプローチを促進することで、持続可能な廃棄物慣行へのシフトを推進します。
スマート廃棄物管理市場は、都市部における効率的で持続可能な廃棄物管理ソリューションへのニーズの高まりによって活性化しています。都市が拡大し人口が増加するにつれ、従来の廃棄物管理手法では廃棄物量の増加に対応しきれなくなっています。このため、IoTセンサーやデータ分析などのスマート技術の採用が推進され、リアルタイムのモニタリングや最適化された廃棄物収集ルートが提供されるため、運用コストの削減と環境への影響の最小化が可能になります。
世界の建設活動の活発化と建設への投資は、スマート廃棄物管理市場の大きな促進要因となっています。例えば、欧州建設産業連盟によると、ドイツでは2023年、建設への総投資額は約3,380億米ドルで、そのうち約2,895億1,100万米ドルが住宅だけでなく非住宅も含む建築物建設に投資されました。建設プロジェクトが拡大するにつれ、がれき、梱包材、解体残材など、大量の廃棄物が発生します。こうした廃棄物を効率的に管理することは、環境の持続可能性を維持し、規制を遵守する上で極めて重要です。スマート廃棄物管理システムは、廃棄物の収集・分別プロセスを最適化することで、埋立地の使用量を削減し、リサイクルを促進することで、こうしたニーズに対応します。
IoTセンサーやデータ分析などの先進技術は、建設部門では特に価値が高いです。IoT対応のごみ箱は、リアルタイムで廃棄物レベルを監視し、建設現場でのタイムリーな回収とオーバーフローの最小化を実現します。データ分析は、廃棄物の発生パターンに関する洞察を提供し、建設会社がより良い廃棄物管理を実施し、資源効率を改善するのに役立ちます。
さらに、多くの建設プロジェクトは、持続可能性を重視する大規模な都市開発構想の一環であることが多いです。スマート廃棄物管理ソリューションの開発は、こうした持続可能性の目標に合致するため、環境目標や規制要件の達成を目指す開発企業にとって魅力的な選択肢となります。世界の建設ラッシュが続く中、効果的な廃棄物管理ソリューションに対する需要は、スマート廃棄物技術のさらなる採用を促進すると予想されます。
しかし、この市場は、特に初期投資の高さや、先進技術を既存の廃棄物管理インフラに統合することの複雑さといった課題に直面しています。小規模な自治体や開発途上地域では、必要な資金や専門知識を割り当てることが難しく、スマート廃棄物管理ソリューションの採用が遅れる可能性があります。
こうした課題にもかかわらず、この市場は、特に持続可能性と循環型経済への注目が高まる中で、大きなチャンスをもたらしています。政府と民間部門は、厳しい環境規制を満たし資源回収を強化するため、革新的な廃棄物管理技術に投資しています。これにより、スマート廃棄物管理ソリューションが長期的な環境目標を達成するための重要な要素となる道が開かれます。
廃棄物エネルギー化技術の進歩は、廃棄物管理とエネルギー回収の相乗効果を高めることで、スマート廃棄物管理市場に大きな機会を提供します。技術の進化に伴い、嫌気性消化、ガス化、熱分解など、廃棄物をエネルギーに変換する新しい方法は、より効率的で経済的に実行可能になってきています。これらの技術をスマート廃棄物管理システムと統合することで、廃棄物からエネルギーへの変換プロセスを大幅に最適化することができます。
IoTセンサーとデータ分析を備えたスマート廃棄物管理システムは、エネルギー生産のために処理される廃棄物の質と量を監視・管理することができます。廃棄物の成分と量に関するリアルタイムのデータを提供することで、これらのシステムは供給原料のより精密な制御を可能にし、エネルギー変換プロセスの効率を向上させます。このデータ駆動型アプローチは、温度や圧力などの運転パラメーターを調整してエネルギー出力を最大化し、廃棄物処理コストを削減するのに役立ちます。
さらに、スマートシステムを統合することで、廃棄物発電プロジェクトの環境面でのメリットを高めることができます。効率的な廃棄物の分別と処理は、埋立地に送られる廃棄物の量を減らし、温室効果ガスの排出を削減し、より広範な持続可能性の目標に合致します。廃棄物発電技術が進歩するにつれて、スマート廃棄物管理システムとの統合がさらなる普及を促進し、経済的価値を生み出し、より持続可能な廃棄物管理の実践に貢献することができます。
スマート廃棄物管理市場は、廃棄物タイプ、方法、ソース、製品、地域によって区分されます。廃棄物タイプ別では、スマート廃棄物管理市場は、固形廃棄物、特殊廃棄物、電子廃棄物に区分されます。方法別では、スマート廃棄物管理市場はスマート収集、スマート処理、スマート廃棄に区分されます。ソース別では、市場は住宅、商業、工業に区分されます。製品別では、市場はハードウェア、ソフトウェアに区分されます。地域別では、北米(米国、カナダ、メキシコ)、欧州(英国、ドイツ、フランス、スペイン、イタリア、オランダ、ベルギー、ポーランド、その他欧州地域)、アジア太平洋(中国、日本、インド、韓国、その他アジア太平洋)、LAMEA(ラテンアメリカ、中東・アフリカ)のスマート廃棄物管理の動向が分析されています。
利害関係者にとっての主なメリット
- 当レポートでは、2023年から2032年にかけてのスマート廃棄物管理市場分析の市場セグメント、現在の動向、推定・動向分析、ダイナミクスを定量的に分析し、スマート廃棄物管理市場の有力な機会を特定します。
- 市場促進要因、市場抑制要因、市場機会に関連する情報とともに市場調査を提供します。
- ポーターのファイブフォース分析では、利害関係者が利益重視のビジネス決定を下し、サプライヤーとバイヤーのネットワークを強化できるように、バイヤーとサプライヤーの潜在力を強調します。
- スマート廃棄物管理市場のセグメンテーションの詳細な分析は、市場機会を決定するのに役立ちます。
- 各地域の主要国は、世界市場への収益貢献度に応じてマッピングされています。
- 市場企業のポジショニングは、ベンチマーキングを容易にし、市場企業の現在のポジションの明確な理解を提供します。
- 本レポートには、地域および世界のスマート廃棄物管理市場動向、主要企業、市場セグメント、応用分野、市場成長戦略の分析が含まれています。
本レポートのカスタマイズの可能性(追加費用とスケジュールが必要です。)
- 投資機会
- サプライチェーン分析とベンダーマージン
- 地域別新規参入企業
- 市場参入戦略
- 主要企業の新製品開発/製品マトリックス
- 顧客の関心に応じた追加企業プロファイル
- 国別または地域別追加分析-市場規模と予測
- 平均販売価格分析/プライスポイント分析
- ブランドシェア分析
- クリスクロスセグメント分析-市場規模と予測
- 企業プロファイルの拡張リスト
- 過去の市場データ
- 輸出入分析/データ
- 主要企業の詳細(所在地、連絡先、サプライヤー/ベンダーネットワークなどを含む、エクセル形式)
- 顧客/消費者/原料サプライヤーのリスト-バリューチェーン分析
- 世界/地域/国別レベルでのプレーヤーの市場シェア分析
- SWOT分析
- 数量市場規模と予測
目次
第1章 イントロダクション
第2章 エグゼクティブサマリー
第3章 市場概要
- 市場の定義と範囲
- 主要な調査結果
- 主要な影響要因
- 主要な投資機会
- ポーターのファイブフォース分析
- 市場力学
- 促進要因
- 廃棄物発生量の増加
- 世界および企業の持続可能性への取り組み
- 世界の建設プロジェクトの増加
- 抑制要因
- 初期投資コストの高さ
- 機会
- 廃棄物エネルギー化技術の進歩
- 促進要因
第4章 スマート廃棄物管理市場:廃棄物タイプ別
- 概要
- 固形廃棄物
- 特殊廃棄物
- 電子廃棄物
第5章 スマート廃棄物管理市場:方法別
- 概要
- スマート収集
- スマート処理
- スマート廃棄
第6章 スマート廃棄物管理市場:ソース別
- 概要
- 住宅
- 商業
- 産業
第7章 スマート廃棄物管理市場:製品別
- 概要
- ハードウェア
- ソフトウェア
第8章 スマート廃棄物管理市場:地域別
- 概要
- 北米
- 米国
- カナダ
- メキシコ
- 欧州
- ドイツ
- フランス
- 英国
- イタリア
- オランダ
- ベルギー
- ポーランド
- その他
- アジア太平洋
- 中国
- インド
- 日本
- 韓国
- その他
- ラテンアメリカ
- ラテンアメリカ
- 中東
- アフリカ
第9章 競合情勢
- イントロダクション
- 主要成功戦略
- 主要10社の製品マッピング
- 競合ダッシュボード
- 競合ヒートマップ
- 主要企業のポジショニング、2023年
第10章 企業プロファイル
- Veolia Environnement S.A.
- Ecube Labs Co. Ltd.
- Waste Management Inc.
- SUEZ Environmental Services.
- Enevo, Inc
- Bigbelly, Inc.
- Sensoneo j. s. a.
- Rubicon Technologies, Inc.
- Bine Sp. z o.o.
- SAP SE
The smart waste management market was valued at $2.2 billion in 2023 and is estimated to reach $8.3 billion by 2032, exhibiting a CAGR of 15.6% from 2024 to 2032.
The smart waste management market involves leveraging digital technologies such as IoT sensors, AI-driven analytics, and automation to enhance waste collection, processing, and recycling. It focuses on optimizing routes, monitoring waste levels in real-time, and improving resource efficiency, leading to reduced environmental footprints. This market drives the shift toward sustainable waste practices by enabling smarter decision-making and fostering a more efficient, data-driven approach to waste management and resource recovery.
The smart waste management market is fueled by the growing need for efficient and sustainable waste management solutions in urban areas. As cities expand and populations increase, traditional waste management methods struggle to keep up with rising waste volumes. This drives the adoption of smart technologies such as IoT sensors and data analytics, which offer real-time monitoring and optimized waste collection routes, thus reducing operational costs and minimizing environmental impact.
The rising construction activities and investment in construction globally are a significant driver for the smart waste management market. For instance, according to the European Construction Industry Federation, in Germany, in 2023, the total investment in construction was around $338,000 million out of which around $289,511 million were invested in building construction, which includes householding as well as non-residential buildings. As construction projects expand, they generate substantial amounts of waste, including debris, packaging materials, and demolition remnants. Managing this waste efficiently is crucial for maintaining environmental sustainability and complying with regulations. Smart waste management systems address these needs by optimizing waste collection and sorting processes, thereby reducing landfill use and promoting recycling.
Advanced technologies such as IoT sensors and data analytics are particularly valuable in the construction sector. IoT-enabled bins can monitor waste levels in real-time, ensuring timely collection and minimizing overflows on construction sites. Data analytics can provide insights into waste generation patterns, helping construction companies implement better waste management practices and improve resource efficiency.
Furthermore, many construction projects are part of larger urban development initiatives, which often emphasize sustainability. Integrating smart waste management solutions aligns with these sustainability goals, making them an attractive option for developers aiming to meet environmental targets and regulatory requirements. As global construction continues to rise, the demand for effective waste management solutions is expected to drive further adoption of smart waste technologies.
However, the market faces challenges, particularly in the form of high initial investments and the complexity of integrating advanced technologies into existing waste management infrastructures. Smaller municipalities and developing regions may find it difficult to allocate the necessary funds and expertise, which can slow down the adoption of smart waste management solutions.
Despite these challenges, the market presents significant opportunities, especially with the increasing focus on sustainability and circular economy practices. Governments and private sectors are investing in innovative waste management technologies to meet stringent environmental regulations and enhance resource recovery. This opens avenues for smart waste management solutions to become a key element in achieving long-term environmental goals.
Advancements in waste-to-energy technologies offer substantial opportunities for the smart waste management market by enhancing the synergy between waste management and energy recovery. As technology evolves, new methods for converting waste into energy-such as anaerobic digestion, gasification, and pyrolysis-are becoming more efficient and economically viable. Integrating these technologies with smart waste management systems can significantly optimize the waste-to-energy process.
Smart waste management systems equipped with IoT sensors and data analytics can monitor and manage the quality and quantity of waste being processed for energy production. By providing real-time data on waste composition and volume, these systems enable more precise control over the feedstock, improving the efficiency of energy conversion processes. This data-driven approach helps in adjusting operational parameters, such as temperature and pressure, to maximize energy output and reduce waste treatment costs.
Moreover, the integration of smart systems can enhance the environmental benefits of waste-to-energy projects. Efficient waste sorting and processing reduces the amount of waste sent to landfills and lowers greenhouse gas emissions, aligning with broader sustainability goals. As waste-to-energy technologies advance, their integration with smart waste management systems can drive further adoption, create economic value, and contribute to more sustainable waste management practices.
The smart waste management market is segmented on the basis of waste type, method, source, product, and region. By waste type, the smart waste management market is segmented into solid waste, special waste, and e-waste. By method, the smart waste management market is segmented into smart collection, smart processing, and smart disposal. By source, the market is segmented into residential, commercial, and industrial. By product, the market is segmented into hardware, and software. Region-wise, the smart waste management trends are analyzed across North America (the U.S., Canada, and Mexico), Europe (UK, Germany, France, Spain, Italy, Netherlands, Belgium, Poland, and rest of Europe), Asia Pacific (China, Japan, India, South Korea, and Rest of Asia-Pacific), and LAMEA (Latin America, the Middle East, and Africa).
The key players profiled in the report include Ecube Labs Co. Ltd., Veolia Environnement S.A., Waste Management Inc., Bigbelly, Inc., Bine Sp. z o.o., SAP SE, SUEZ Environmental Services, Sensoneo j. s. a., Rubicon Technologies, Inc., and Enevo, Inc.
Key Benefits For Stakeholders
- This report provides a quantitative analysis of the market segments, current trends, estimations, and dynamics of the smart waste management market analysis from 2023 to 2032 to identify the prevailing smart waste management market opportunities.
- The market research is offered along with information related to key drivers, restraints, and opportunities.
- Porter's five forces analysis highlights the potency of buyers and suppliers to enable stakeholders make profit-oriented business decisions and strengthen their supplier-buyer network.
- In-depth analysis of the smart waste management market segmentation assists to determine the prevailing market opportunities.
- Major countries in each region are mapped according to their revenue contribution to the global market.
- Market player positioning facilitates benchmarking and provides a clear understanding of the present position of the market players.
- The report includes the analysis of the regional as well as global smart waste management market trends, key players, market segments, application areas, and market growth strategies.
Additional benefits you will get with this purchase are:
- Quarterly Update and* (only available with a corporate license, on listed price)
- 5 additional Company Profile of client Choice pre- or Post-purchase, as a free update.
- Free Upcoming Version on the Purchase of Five and Enterprise User License.
- 16 analyst hours of support* (post-purchase, if you find additional data requirements upon review of the report, you may receive support amounting to 16 analyst hours to solve questions, and post-sale queries)
- 15% Free Customization* (in case the scope or segment of the report does not match your requirements, 15% is equivalent to 3 working days of free work, applicable once)
- Free data Pack on the Five and Enterprise User License. (Excel version of the report)
- Free Updated report if the report is 6-12 months old or older.
- 24-hour priority response*
- Free Industry updates and white papers.
Possible Customization with this report (with additional cost and timeline, please talk to the sales executive to know more)
- Investment Opportunities
- Supply Chain Analysis & Vendor Margins
- Upcoming/New Entrant by Regions
- Go To Market Strategy
- New Product Development/ Product Matrix of Key Players
- Additional company profiles with specific to client's interest
- Additional country or region analysis- market size and forecast
- Average Selling Price Analysis / Price Point Analysis
- Brands Share Analysis
- Criss-cross segment analysis- market size and forecast
- Expanded list for Company Profiles
- Historic market data
- Import Export Analysis/Data
- Key player details (including location, contact details, supplier/vendor network etc. in excel format)
- List of customers/consumers/raw material suppliers- value chain analysis
- Market share analysis of players at global/region/country level
- SWOT Analysis
- Volume Market Size and Forecast
Key Market Segments
By Waste Type
- Solid Waste
- Special Waste
- E-Waste
By Method
- Smart Collection
- Smart Processing
- Smart Disposal
By Source
- Residential
- Commercial
- Industrial
By Product
- Hardware
- Software
By Region
- North America
- U.S.
- Canada
- Mexico
- Europe
- Germany
- France
- UK
- Italy
- Netherlands
- Belgium
- Poland
- Rest of Europe
- Asia-Pacific
- China
- India
- Japan
- South Korea
- Rest of Asia-Pacific
- LAMEA
- Latin America
- Middle East
- Africa
Key Market Players:
- Bigbelly, Inc.
- Bine Sp. z o.o.
- Ecube Labs Co. Ltd.
- Enevo, Inc
- Rubicon Technologies, Inc.
- SAP SE
- Sensoneo j. s. a.
- SUEZ Environmental Services.
- Veolia Environnement S.A.
- Waste Management Inc.
TABLE OF CONTENTS
CHAPTER 1: INTRODUCTION
- 1.1. Report description
- 1.2. Key market segments
- 1.3. Key benefits to the stakeholders
- 1.4. Research methodology
- 1.4.1. Primary research
- 1.4.2. Secondary research
- 1.4.3. Analyst tools and models
CHAPTER 2: EXECUTIVE SUMMARY
- 2.1. CXO perspective
CHAPTER 3: MARKET OVERVIEW
- 3.1. Market definition and scope
- 3.2. Key findings
- 3.2.1. Top impacting factors
- 3.2.2. Top investment pockets
- 3.3. Porter's five forces analysis
- 3.3.1. Low bargaining power of suppliers
- 3.3.2. Low threat of new entrants
- 3.3.3. Low threat of substitutes
- 3.3.4. Low intensity of rivalry
- 3.3.5. Low bargaining power of buyers
- 3.4. Market dynamics
- 3.4.1. Drivers
- 3.4.1.1. Rise in Waste Generation
- 3.4.1.2. Global and Corporate Sustainability Initiatives
- 3.4.1.3. Rise in Construction Projects Globally
- 3.4.2. Restraints
- 3.4.2.1. High Initial Investment Costs
- 3.4.3. Opportunities
- 3.4.3.1. Advancements in Waste-to-Energy Technologies
- 3.4.1. Drivers
CHAPTER 4: SMART WASTE MANAGEMENT MARKET, BY WASTE TYPE
- 4.1. Overview
- 4.1.1. Market size and forecast
- 4.2. Solid Waste
- 4.2.1. Key market trends, growth factors and opportunities
- 4.2.2. Market size and forecast, by region
- 4.2.3. Market share analysis by country
- 4.3. Special Waste
- 4.3.1. Key market trends, growth factors and opportunities
- 4.3.2. Market size and forecast, by region
- 4.3.3. Market share analysis by country
- 4.4. E-Waste
- 4.4.1. Key market trends, growth factors and opportunities
- 4.4.2. Market size and forecast, by region
- 4.4.3. Market share analysis by country
CHAPTER 5: SMART WASTE MANAGEMENT MARKET, BY METHOD
- 5.1. Overview
- 5.1.1. Market size and forecast
- 5.2. Smart Collection
- 5.2.1. Key market trends, growth factors and opportunities
- 5.2.2. Market size and forecast, by region
- 5.2.3. Market share analysis by country
- 5.3. Smart Processing
- 5.3.1. Key market trends, growth factors and opportunities
- 5.3.2. Market size and forecast, by region
- 5.3.3. Market share analysis by country
- 5.4. Smart Disposal
- 5.4.1. Key market trends, growth factors and opportunities
- 5.4.2. Market size and forecast, by region
- 5.4.3. Market share analysis by country
CHAPTER 6: SMART WASTE MANAGEMENT MARKET, BY SOURCE
- 6.1. Overview
- 6.1.1. Market size and forecast
- 6.2. Residential
- 6.2.1. Key market trends, growth factors and opportunities
- 6.2.2. Market size and forecast, by region
- 6.2.3. Market share analysis by country
- 6.3. Commercial
- 6.3.1. Key market trends, growth factors and opportunities
- 6.3.2. Market size and forecast, by region
- 6.3.3. Market share analysis by country
- 6.4. Industrial
- 6.4.1. Key market trends, growth factors and opportunities
- 6.4.2. Market size and forecast, by region
- 6.4.3. Market share analysis by country
CHAPTER 7: SMART WASTE MANAGEMENT MARKET, BY PRODUCT
- 7.1. Overview
- 7.1.1. Market size and forecast
- 7.2. Hardware
- 7.2.1. Key market trends, growth factors and opportunities
- 7.2.2. Market size and forecast, by region
- 7.2.3. Market share analysis by country
- 7.3. Software
- 7.3.1. Key market trends, growth factors and opportunities
- 7.3.2. Market size and forecast, by region
- 7.3.3. Market share analysis by country
CHAPTER 8: SMART WASTE MANAGEMENT MARKET, BY REGION
- 8.1. Overview
- 8.1.1. Market size and forecast By Region
- 8.2. North America
- 8.2.1. Key market trends, growth factors and opportunities
- 8.2.2. Market size and forecast, by Waste Type
- 8.2.3. Market size and forecast, by Method
- 8.2.4. Market size and forecast, by Source
- 8.2.5. Market size and forecast, by Product
- 8.2.6. Market size and forecast, by country
- 8.2.6.1. U.S.
- 8.2.6.1.1. Market size and forecast, by Waste Type
- 8.2.6.1.2. Market size and forecast, by Method
- 8.2.6.1.3. Market size and forecast, by Source
- 8.2.6.1.4. Market size and forecast, by Product
- 8.2.6.2. Canada
- 8.2.6.2.1. Market size and forecast, by Waste Type
- 8.2.6.2.2. Market size and forecast, by Method
- 8.2.6.2.3. Market size and forecast, by Source
- 8.2.6.2.4. Market size and forecast, by Product
- 8.2.6.3. Mexico
- 8.2.6.3.1. Market size and forecast, by Waste Type
- 8.2.6.3.2. Market size and forecast, by Method
- 8.2.6.3.3. Market size and forecast, by Source
- 8.2.6.3.4. Market size and forecast, by Product
- 8.3. Europe
- 8.3.1. Key market trends, growth factors and opportunities
- 8.3.2. Market size and forecast, by Waste Type
- 8.3.3. Market size and forecast, by Method
- 8.3.4. Market size and forecast, by Source
- 8.3.5. Market size and forecast, by Product
- 8.3.6. Market size and forecast, by country
- 8.3.6.1. Germany
- 8.3.6.1.1. Market size and forecast, by Waste Type
- 8.3.6.1.2. Market size and forecast, by Method
- 8.3.6.1.3. Market size and forecast, by Source
- 8.3.6.1.4. Market size and forecast, by Product
- 8.3.6.2. France
- 8.3.6.2.1. Market size and forecast, by Waste Type
- 8.3.6.2.2. Market size and forecast, by Method
- 8.3.6.2.3. Market size and forecast, by Source
- 8.3.6.2.4. Market size and forecast, by Product
- 8.3.6.3. UK
- 8.3.6.3.1. Market size and forecast, by Waste Type
- 8.3.6.3.2. Market size and forecast, by Method
- 8.3.6.3.3. Market size and forecast, by Source
- 8.3.6.3.4. Market size and forecast, by Product
- 8.3.6.4. Italy
- 8.3.6.4.1. Market size and forecast, by Waste Type
- 8.3.6.4.2. Market size and forecast, by Method
- 8.3.6.4.3. Market size and forecast, by Source
- 8.3.6.4.4. Market size and forecast, by Product
- 8.3.6.5. Netherlands
- 8.3.6.5.1. Market size and forecast, by Waste Type
- 8.3.6.5.2. Market size and forecast, by Method
- 8.3.6.5.3. Market size and forecast, by Source
- 8.3.6.5.4. Market size and forecast, by Product
- 8.3.6.6. Belgium
- 8.3.6.6.1. Market size and forecast, by Waste Type
- 8.3.6.6.2. Market size and forecast, by Method
- 8.3.6.6.3. Market size and forecast, by Source
- 8.3.6.6.4. Market size and forecast, by Product
- 8.3.6.7. Poland
- 8.3.6.7.1. Market size and forecast, by Waste Type
- 8.3.6.7.2. Market size and forecast, by Method
- 8.3.6.7.3. Market size and forecast, by Source
- 8.3.6.7.4. Market size and forecast, by Product
- 8.3.6.8. Rest of Europe
- 8.3.6.8.1. Market size and forecast, by Waste Type
- 8.3.6.8.2. Market size and forecast, by Method
- 8.3.6.8.3. Market size and forecast, by Source
- 8.3.6.8.4. Market size and forecast, by Product
- 8.4. Asia-Pacific
- 8.4.1. Key market trends, growth factors and opportunities
- 8.4.2. Market size and forecast, by Waste Type
- 8.4.3. Market size and forecast, by Method
- 8.4.4. Market size and forecast, by Source
- 8.4.5. Market size and forecast, by Product
- 8.4.6. Market size and forecast, by country
- 8.4.6.1. China
- 8.4.6.1.1. Market size and forecast, by Waste Type
- 8.4.6.1.2. Market size and forecast, by Method
- 8.4.6.1.3. Market size and forecast, by Source
- 8.4.6.1.4. Market size and forecast, by Product
- 8.4.6.2. India
- 8.4.6.2.1. Market size and forecast, by Waste Type
- 8.4.6.2.2. Market size and forecast, by Method
- 8.4.6.2.3. Market size and forecast, by Source
- 8.4.6.2.4. Market size and forecast, by Product
- 8.4.6.3. Japan
- 8.4.6.3.1. Market size and forecast, by Waste Type
- 8.4.6.3.2. Market size and forecast, by Method
- 8.4.6.3.3. Market size and forecast, by Source
- 8.4.6.3.4. Market size and forecast, by Product
- 8.4.6.4. South Korea
- 8.4.6.4.1. Market size and forecast, by Waste Type
- 8.4.6.4.2. Market size and forecast, by Method
- 8.4.6.4.3. Market size and forecast, by Source
- 8.4.6.4.4. Market size and forecast, by Product
- 8.4.6.5. Rest of Asia-Pacific
- 8.4.6.5.1. Market size and forecast, by Waste Type
- 8.4.6.5.2. Market size and forecast, by Method
- 8.4.6.5.3. Market size and forecast, by Source
- 8.4.6.5.4. Market size and forecast, by Product
- 8.5. LAMEA
- 8.5.1. Key market trends, growth factors and opportunities
- 8.5.2. Market size and forecast, by Waste Type
- 8.5.3. Market size and forecast, by Method
- 8.5.4. Market size and forecast, by Source
- 8.5.5. Market size and forecast, by Product
- 8.5.6. Market size and forecast, by country
- 8.5.6.1. Latin America
- 8.5.6.1.1. Market size and forecast, by Waste Type
- 8.5.6.1.2. Market size and forecast, by Method
- 8.5.6.1.3. Market size and forecast, by Source
- 8.5.6.1.4. Market size and forecast, by Product
- 8.5.6.2. Middle East
- 8.5.6.2.1. Market size and forecast, by Waste Type
- 8.5.6.2.2. Market size and forecast, by Method
- 8.5.6.2.3. Market size and forecast, by Source
- 8.5.6.2.4. Market size and forecast, by Product
- 8.5.6.3. Africa
- 8.5.6.3.1. Market size and forecast, by Waste Type
- 8.5.6.3.2. Market size and forecast, by Method
- 8.5.6.3.3. Market size and forecast, by Source
- 8.5.6.3.4. Market size and forecast, by Product
CHAPTER 9: COMPETITIVE LANDSCAPE
- 9.1. Introduction
- 9.2. Top winning strategies
- 9.3. Product mapping of top 10 player
- 9.4. Competitive dashboard
- 9.5. Competitive heatmap
- 9.6. Top player positioning, 2023
CHAPTER 10: COMPANY PROFILES
- 10.1. Veolia Environnement S.A.
- 10.1.1. Company overview
- 10.1.2. Key executives
- 10.1.3. Company snapshot
- 10.1.4. Operating business segments
- 10.1.5. Product portfolio
- 10.1.6. Business performance
- 10.1.7. Key strategic moves and developments
- 10.2. Ecube Labs Co. Ltd.
- 10.2.1. Company overview
- 10.2.2. Key executives
- 10.2.3. Company snapshot
- 10.2.4. Operating business segments
- 10.2.5. Product portfolio
- 10.3. Waste Management Inc.
- 10.3.1. Company overview
- 10.3.2. Key executives
- 10.3.3. Company snapshot
- 10.3.4. Operating business segments
- 10.3.5. Product portfolio
- 10.3.6. Business performance
- 10.3.7. Key strategic moves and developments
- 10.4. SUEZ Environmental Services.
- 10.4.1. Company overview
- 10.4.2. Key executives
- 10.4.3. Company snapshot
- 10.4.4. Operating business segments
- 10.4.5. Product portfolio
- 10.4.6. Business performance
- 10.4.7. Key strategic moves and developments
- 10.5. Enevo, Inc
- 10.5.1. Company overview
- 10.5.2. Key executives
- 10.5.3. Company snapshot
- 10.5.4. Operating business segments
- 10.5.5. Product portfolio
- 10.6. Bigbelly, Inc.
- 10.6.1. Company overview
- 10.6.2. Key executives
- 10.6.3. Company snapshot
- 10.6.4. Operating business segments
- 10.6.5. Product portfolio
- 10.6.6. Key strategic moves and developments
- 10.7. Sensoneo j. s. a.
- 10.7.1. Company overview
- 10.7.2. Key executives
- 10.7.3. Company snapshot
- 10.7.4. Operating business segments
- 10.7.5. Product portfolio
- 10.8. Rubicon Technologies, Inc.
- 10.8.1. Company overview
- 10.8.2. Key executives
- 10.8.3. Company snapshot
- 10.8.4. Operating business segments
- 10.8.5. Product portfolio
- 10.8.6. Business performance
- 10.8.7. Key strategic moves and developments
- 10.9. Bine Sp. z o.o.
- 10.9.1. Company overview
- 10.9.2. Key executives
- 10.9.3. Company snapshot
- 10.9.4. Operating business segments
- 10.9.5. Product portfolio
- 10.10. SAP SE
- 10.10.1. Company overview
- 10.10.2. Key executives
- 10.10.3. Company snapshot
- 10.10.4. Operating business segments
- 10.10.5. Product portfolio
- 10.10.6. Business performance
- 10.10.7. Key strategic moves and developments
