
|
市場調査レポート
商品コード
1641764
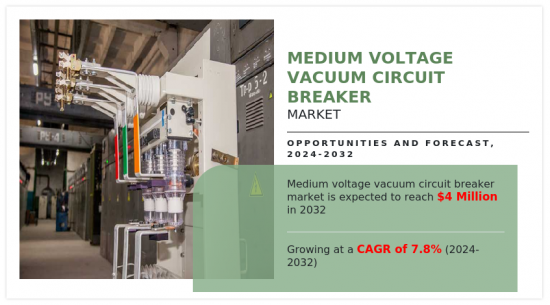
中電圧真空サーキットブレーカーの世界市場:容量帯別、設置場所別、最終用途産業別 - 機会分析と産業予測、2024年~2032年Medium Voltage Vacuum Circuit Breaker Market By Capacity bands, By Installation location, By End use industry : Global Opportunity Analysis and Industry Forecast, 2024-2032 |
||||||
|
|||||||

| 中電圧真空サーキットブレーカーの世界市場:容量帯別、設置場所別、最終用途産業別 - 機会分析と産業予測、2024年~2032年 |
|
出版日: 2024年12月01日
発行: Allied Market Research
ページ情報: 英文 350 Pages
納期: 2~3営業日
|

- 全表示
- 概要
- 目次
真空サーキットブレーカーは、回路内の電流の流れを遮断または遮断するために使用される電気スイッチング装置です。
真空をアーク消弧媒体として使用し、スイッチング動作中または故障時にブレーカーの接点が開くときに形成される電気アークを消弧します。真空サーキットブレーカーは、配電システム、産業施設、商業ビル、再生可能エネルギー設備で広く使用されており、過電流、短絡、その他の電気障害から保護することで、電気システムの安全で信頼性の高い動作を保証しています。
真空サーキットブレーカー市場は、フリー真空サーキットブレーカーのメンテナンス、送電網の近代化、送電網に接続される再生可能エネルギー源の採用増加、より優れた信頼性の高い性能を求める電力セクターからの需要の急増により、予測期間中に大幅に拡大すると予想されます。また、予測期間中、真空サーキットブレーカー市場はインフラ開発の増加による恩恵を受けると予測されます。一方、真空サーキットブレーカー市場の成長は、原材料費の高騰によって抑制されると予想されます。こうしたコスト増は生産コストを高くし、製品の最終価格に影響を与えるため、市場の拡大を鈍らせる可能性があります。原材料費の高騰はメーカーの利益率を低下させるため、特定の用途でより費用対効果の高いエアブレーカーやオイルブレーカーなどの代替技術に比べて競争力が低下します。
真空サーキットブレーカー市場は、容量帯、設置場所、最終用途産業、地域によって区分されます。容量帯域別では、市場は5kVから15kV、16kVから27kV、2kVから40kVに分けられます。設置場所別では、市場は屋内と屋外に分別されます。最終用途産業ベースでは、市場は輸送、データセンター、再生可能エネルギー、鉱業、石油・ガス、その他に分別されます。地域別では、真空サーキットブレーカーの市場動向は北米(米国、カナダ、メキシコ)で分析されています、
欧州(英国、ドイツ、フランス、その他欧州地域)、アジア太平洋(中国、日本、インド、韓国、その他アジア太平洋)、そしてLAMEA(ラテンアメリカ、中東・アフリカ)となります。真空サーキットブレーカー市場では、アジア太平洋が最も高い市場シェアを占めています。
利害関係者にとっての主なメリット
- 当レポートは、2023年から2032年までの中電圧真空サーキットブレーカー市場分析の市場セグメント、現在の動向、推定・力学を定量的に分析し、中電圧真空サーキットブレーカー市場の有力な市場機会を特定します。
- 市場促進要因、市場抑制要因、市場機会に関連する情報とともに市場調査を提供します。
- ポーターのファイブフォース分析では、利害関係者が利益重視のビジネス決定を下し、サプライヤーとバイヤーのネットワークを強化できるよう、バイヤーとサプライヤーの力を強調します。
- 中電圧真空サーキットブレーカーの市場セグメンテーションを詳細に分析することで、市場機会を見極めることができます。
- 各地域の主要国は、世界市場への収益貢献度に応じてマッピングされています。
- 市場企業のポジショニングはベンチマークを容易にし、市場企業の現在のポジションを明確に理解することができます。
- 地域別および世界の中電圧真空サーキットブレーカー市場動向、主要企業、市場セグメント、応用分野、市場成長戦略などの分析が含まれています。
本レポートで可能なカスタマイズ(追加費用とスケジュールが必要です。)
- 製品ライフサイクル
- 国、地域、世界レベルでの患者/疫学データ
- クライアントの関心に応じた追加企業プロファイル
- 国別または地域別の追加分析-市場規模および予測
- 主要企業の詳細(所在地、連絡先、サプライヤー/ベンダーネットワークなどを含む、エクセル形式)
- SWOT分析
目次
第1章 イントロダクション
第2章 エグゼクティブサマリー
第3章 市場概要
- 市場の定義と範囲
- 主要な調査結果
- 主要な影響要因
- 主要な投資機会
- ポーターのファイブフォース分析
- 市場力学
- 促進要因
- メンテナンスフリーの真空サーキットブレーカー
- 送電網の近代化と送電網に接続された再生可能エネルギー源の採用増加
- 信頼性の高い性能に対する電力セクターからの需要の急増
- 抑制要因
- スイッチング時の過電圧リスク
- 機会
- インフラ開発の増加
- 促進要因
- 規制ガイドライン
第4章 中電圧真空サーキットブレーカー市場:容量帯別
- 概要
- 5~15kV
- 16~27kV
- 28~40kV
第5章 中電圧真空サーキットブレーカー市場:設置場所別
- 概要
- 屋内
- 屋外
第6章 中電圧真空サーキットブレーカー市場:産業別
- 概要
- トランジット
- データセンター
- 再生可能エネルギー
- 鉱業
- 石油・ガス
- その他
第7章 中電圧真空サーキットブレーカー市場:地域別
- 概要
- 北米
- 米国
- カナダ
- メキシコ
- 欧州
- 英国
- ドイツ
- フランス
- イタリア
- その他
- アジア太平洋
- 中国
- 日本
- インド
- 韓国
- その他
- ラテンアメリカ
- ラテンアメリカ
- 中東
- アフリカ
第8章 競合情勢
- イントロダクション
- 主要成功戦略
- 主要10社の製品マッピング
- 競合ダッシュボード
- 競合ヒートマップ
- 主要企業のポジショニング、2023年
第9章 企業プロファイル
- ABB
- Schneider Electric
- Eaton Corporation
- Legrand
- Fuji Electric Co. Ltd.
- Mitsubishi Electric Corporation
- TOSHIBA CORPORATION
- Siemens AG
- Arteche
- Chint Electric Co Ltd
- Myers Power Products Inc.
- Avail SWGR
- Crompton Greaves Consumer Electricals Ltd
- Tavrida Electric AG
- CG Power and Industrial Solutions Ltd.
A vacuum circuit breaker is an electrical switching device that is used to interrupt or cut off the flow of electric current in a circuit. It uses a vacuum as the arc quenching medium to extinguish the electric arc that forms when the contacts of the breaker open during switching operations or in the event of a fault. Vacuum circuit breakers are widely used in power distribution systems, industrial facilities, commercial buildings, and renewable energy installations to ensure the safe and reliable operation of electrical systems by protecting against overcurrent, short circuits, and other electrical faults.
The vacuum circuit breakers market is anticipated to expand significantly during the forecast period owing to maintenance of free vacuum circuit breakers, grid modernization, increase in adoption of grid-connected renewable energy sources, and surge in demand from the power sector for better and more reliable performance. In addition, during the forecast period, the vacuum circuit breakers market is anticipated to benefit from rise in infrastructural developments. On the other hand, growth in the vacuum circuit breaker market is expected to be restrained by the high cost of raw materials. These increased costs make production more expensive and affect the final price of the product, potentially slowing market expansion. High raw material cost reduce manufacturers' profit margins, which make them less competitive as compared to alternative technologies, such as air or oil circuit breakers that are more cost effective in certain applications.
The vacuum circuit breaker market is segmented on the basis of capacity band, installation location, end-use industry, and region. On the basis of capacity band, the market is divided into 5 To 15kV, 16 To 27kV and 28 To 40kV. By installation location, the market is segregated into indoor and outdoor. On the basis of end-use industry, the market is segregated into transit, data centers, renewable energy, mining, oil and gas, and others. Region-wise, the vacuum circuit breakers market trends are analyzed across North America (the U.S., Canada, and Mexico),
Europe (the UK, Germany, France, and rest of Europe), Asia-Pacific (China, Japan, India, South Korea, and rest of Asia-Pacific), and LAMEA (Latin America, Middle East, and Africa). Asia-Pacific holds the highest market share in the vacuum circuit breakers market.
The key players profiled in the report include ABB, Schneider Electric, Eaton Corporation, Legrand, Fuji Electric Co. Ltd., Mitsubishi Electric Corporation, Toshiba Corporation, Siemens AG, Arteche, and Chint Electric Co Ltd. Market players have adopted various strategies such as product launch, product development, and acquisition to expand their foothold in the vacuum circuit breakers market.
Key Benefits For Stakeholders
- This report provides a quantitative analysis of the market segments, current trends, estimations, and dynamics of the medium voltage vacuum circuit breaker market analysis from 2023 to 2032 to identify the prevailing medium voltage vacuum circuit breaker market opportunities.
- The market research is offered along with information related to key drivers, restraints, and opportunities.
- Porter's five forces analysis highlights the potency of buyers and suppliers to enable stakeholders make profit-oriented business decisions and strengthen their supplier-buyer network.
- In-depth analysis of the medium voltage vacuum circuit breaker market segmentation assists to determine the prevailing market opportunities.
- Major countries in each region are mapped according to their revenue contribution to the global market.
- Market player positioning facilitates benchmarking and provides a clear understanding of the present position of the market players.
- The report includes the analysis of the regional as well as global medium voltage vacuum circuit breaker market trends, key players, market segments, application areas, and market growth strategies.
Additional benefits you will get with this purchase are:
- Quarterly Update and* (only available with a corporate license, on listed price)
- 5 additional Company Profile of client Choice pre- or Post-purchase, as a free update.
- Free Upcoming Version on the Purchase of Five and Enterprise User License.
- 16 analyst hours of support* (post-purchase, if you find additional data requirements upon review of the report, you may receive support amounting to 16 analyst hours to solve questions, and post-sale queries)
- 15% Free Customization* (in case the scope or segment of the report does not match your requirements, 15% is equivalent to 3 working days of free work, applicable once)
- Free data Pack on the Five and Enterprise User License. (Excel version of the report)
- Free Updated report if the report is 6-12 months old or older.
- 24-hour priority response*
- Free Industry updates and white papers.
Possible Customization with this report (with additional cost and timeline, please talk to the sales executive to know more)
- Product Life Cycles
- Patient/epidemiology data at country, region, global level
- Additional company profiles with specific to client's interest
- Additional country or region analysis- market size and forecast
- Key player details (including location, contact details, supplier/vendor network etc. in excel format)
- SWOT Analysis
Key Market Segments
By Capacity bands
- 5 to 15kV
- 16 to 27kV
- 28 to 40kV
By Installation location
- Indoor
- Outdoor
By End use industry
- Transit
- Data Centers
- Renewable Energy
- Mining
- Oil and Gas
- Others
By Region
- North America
- U.S.
- Canada
- Mexico
- Europe
- UK
- Germany
- France
- Italy
- Rest of Europe
- Asia-Pacific
- China
- Japan
- India
- South Korea
- Rest of Asia-Pacific
- LAMEA
- Latin America
- Middle East
- Africa
Key Market Players:
- ABB
- Arteche
- Avail SWGR
- CG Power and Industrial Solutions Ltd.
- Chint Electric Co Ltd
- Crompton Greaves Consumer Electricals Ltd
- Eaton Corporation
- Fuji Electric Co. Ltd.
- Legrand
- Mitsubishi Electric Corporation
- Myers Power Products Inc.
- Schneider Electric
- Siemens AG
- Tavrida Electric AG
- TOSHIBA CORPORATION
TABLE OF CONTENTS
CHAPTER 1: INTRODUCTION
- 1.1. Report description
- 1.2. Key market segments
- 1.3. Key benefits to the stakeholders
- 1.4. Research methodology
- 1.4.1. Primary research
- 1.4.2. Secondary research
- 1.4.3. Analyst tools and models
CHAPTER 2: EXECUTIVE SUMMARY
- 2.1. CXO perspective
CHAPTER 3: MARKET OVERVIEW
- 3.1. Market definition and scope
- 3.2. Key findings
- 3.2.1. Top impacting factors
- 3.2.2. Top investment pockets
- 3.3. Porter's five forces analysis
- 3.3.1. Moderate threat of new entrants
- 3.3.2. Moderate bargaining power of suppliers
- 3.3.3. Moderate threat of substitutes
- 3.3.4. Moderate to high intensity of rivalry
- 3.3.5. Moderate bargaining power of buyers
- 3.4. Market dynamics
- 3.4.1. Drivers
- 3.4.1.1. Maintenance free vacuum circuit breakers
- 3.4.1.2. Grid modernization and increasing adoption of grid-connected renewable energy sources
- 3.4.1.3. Surge in demand from the power sector for better and more reliable performance
- 3.4.2. Restraints
- 3.4.2.1. Risk of overvoltage during switching
- 3.4.3. Opportunities
- 3.4.3.1. Rise in infrastructural developments
- 3.4.1. Drivers
- 3.5. Regulatory Guidelines
CHAPTER 4: MEDIUM VOLTAGE VACUUM CIRCUIT BREAKER MARKET, BY CAPACITY BANDS
- 4.1. Overview
- 4.1.1. Market size and forecast
- 4.2. 5 to 15kV
- 4.2.1. Key market trends, growth factors and opportunities
- 4.2.2. Market size and forecast, by region
- 4.2.3. Market share analysis by country
- 4.3. 16 to 27kV
- 4.3.1. Key market trends, growth factors and opportunities
- 4.3.2. Market size and forecast, by region
- 4.3.3. Market share analysis by country
- 4.4. 28 to 40kV
- 4.4.1. Key market trends, growth factors and opportunities
- 4.4.2. Market size and forecast, by region
- 4.4.3. Market share analysis by country
CHAPTER 5: MEDIUM VOLTAGE VACUUM CIRCUIT BREAKER MARKET, BY INSTALLATION LOCATION
- 5.1. Overview
- 5.1.1. Market size and forecast
- 5.2. Indoor
- 5.2.1. Key market trends, growth factors and opportunities
- 5.2.2. Market size and forecast, by region
- 5.2.3. Market share analysis by country
- 5.3. Outdoor
- 5.3.1. Key market trends, growth factors and opportunities
- 5.3.2. Market size and forecast, by region
- 5.3.3. Market share analysis by country
CHAPTER 6: MEDIUM VOLTAGE VACUUM CIRCUIT BREAKER MARKET, BY END USE INDUSTRY
- 6.1. Overview
- 6.1.1. Market size and forecast
- 6.2. Transit
- 6.2.1. Key market trends, growth factors and opportunities
- 6.2.2. Market size and forecast, by region
- 6.2.3. Market share analysis by country
- 6.3. Data Centers
- 6.3.1. Key market trends, growth factors and opportunities
- 6.3.2. Market size and forecast, by region
- 6.3.3. Market share analysis by country
- 6.4. Renewable Energy
- 6.4.1. Key market trends, growth factors and opportunities
- 6.4.2. Market size and forecast, by region
- 6.4.3. Market share analysis by country
- 6.5. Mining
- 6.5.1. Key market trends, growth factors and opportunities
- 6.5.2. Market size and forecast, by region
- 6.5.3. Market share analysis by country
- 6.6. Oil and Gas
- 6.6.1. Key market trends, growth factors and opportunities
- 6.6.2. Market size and forecast, by region
- 6.6.3. Market share analysis by country
- 6.7. Others
- 6.7.1. Key market trends, growth factors and opportunities
- 6.7.2. Market size and forecast, by region
- 6.7.3. Market share analysis by country
CHAPTER 7: MEDIUM VOLTAGE VACUUM CIRCUIT BREAKER MARKET, BY REGION
- 7.1. Overview
- 7.1.1. Market size and forecast By Region
- 7.2. North America
- 7.2.1. Key market trends, growth factors and opportunities
- 7.2.2. Market size and forecast, by Capacity bands
- 7.2.3. Market size and forecast, by Installation location
- 7.2.4. Market size and forecast, by End use industry
- 7.2.5. Market size and forecast, by country
- 7.2.5.1. U.S.
- 7.2.5.1.1. Market size and forecast, by Capacity bands
- 7.2.5.1.2. Market size and forecast, by Installation location
- 7.2.5.1.3. Market size and forecast, by End use industry
- 7.2.5.2. Canada
- 7.2.5.2.1. Market size and forecast, by Capacity bands
- 7.2.5.2.2. Market size and forecast, by Installation location
- 7.2.5.2.3. Market size and forecast, by End use industry
- 7.2.5.3. Mexico
- 7.2.5.3.1. Market size and forecast, by Capacity bands
- 7.2.5.3.2. Market size and forecast, by Installation location
- 7.2.5.3.3. Market size and forecast, by End use industry
- 7.3. Europe
- 7.3.1. Key market trends, growth factors and opportunities
- 7.3.2. Market size and forecast, by Capacity bands
- 7.3.3. Market size and forecast, by Installation location
- 7.3.4. Market size and forecast, by End use industry
- 7.3.5. Market size and forecast, by country
- 7.3.5.1. UK
- 7.3.5.1.1. Market size and forecast, by Capacity bands
- 7.3.5.1.2. Market size and forecast, by Installation location
- 7.3.5.1.3. Market size and forecast, by End use industry
- 7.3.5.2. Germany
- 7.3.5.2.1. Market size and forecast, by Capacity bands
- 7.3.5.2.2. Market size and forecast, by Installation location
- 7.3.5.2.3. Market size and forecast, by End use industry
- 7.3.5.3. France
- 7.3.5.3.1. Market size and forecast, by Capacity bands
- 7.3.5.3.2. Market size and forecast, by Installation location
- 7.3.5.3.3. Market size and forecast, by End use industry
- 7.3.5.4. Italy
- 7.3.5.4.1. Market size and forecast, by Capacity bands
- 7.3.5.4.2. Market size and forecast, by Installation location
- 7.3.5.4.3. Market size and forecast, by End use industry
- 7.3.5.5. Rest of Europe
- 7.3.5.5.1. Market size and forecast, by Capacity bands
- 7.3.5.5.2. Market size and forecast, by Installation location
- 7.3.5.5.3. Market size and forecast, by End use industry
- 7.4. Asia-Pacific
- 7.4.1. Key market trends, growth factors and opportunities
- 7.4.2. Market size and forecast, by Capacity bands
- 7.4.3. Market size and forecast, by Installation location
- 7.4.4. Market size and forecast, by End use industry
- 7.4.5. Market size and forecast, by country
- 7.4.5.1. China
- 7.4.5.1.1. Market size and forecast, by Capacity bands
- 7.4.5.1.2. Market size and forecast, by Installation location
- 7.4.5.1.3. Market size and forecast, by End use industry
- 7.4.5.2. Japan
- 7.4.5.2.1. Market size and forecast, by Capacity bands
- 7.4.5.2.2. Market size and forecast, by Installation location
- 7.4.5.2.3. Market size and forecast, by End use industry
- 7.4.5.3. India
- 7.4.5.3.1. Market size and forecast, by Capacity bands
- 7.4.5.3.2. Market size and forecast, by Installation location
- 7.4.5.3.3. Market size and forecast, by End use industry
- 7.4.5.4. South Korea
- 7.4.5.4.1. Market size and forecast, by Capacity bands
- 7.4.5.4.2. Market size and forecast, by Installation location
- 7.4.5.4.3. Market size and forecast, by End use industry
- 7.4.5.5. Rest of Asia-Pacific
- 7.4.5.5.1. Market size and forecast, by Capacity bands
- 7.4.5.5.2. Market size and forecast, by Installation location
- 7.4.5.5.3. Market size and forecast, by End use industry
- 7.5. LAMEA
- 7.5.1. Key market trends, growth factors and opportunities
- 7.5.2. Market size and forecast, by Capacity bands
- 7.5.3. Market size and forecast, by Installation location
- 7.5.4. Market size and forecast, by End use industry
- 7.5.5. Market size and forecast, by country
- 7.5.5.1. Latin America
- 7.5.5.1.1. Market size and forecast, by Capacity bands
- 7.5.5.1.2. Market size and forecast, by Installation location
- 7.5.5.1.3. Market size and forecast, by End use industry
- 7.5.5.2. Middle East
- 7.5.5.2.1. Market size and forecast, by Capacity bands
- 7.5.5.2.2. Market size and forecast, by Installation location
- 7.5.5.2.3. Market size and forecast, by End use industry
- 7.5.5.3. Africa
- 7.5.5.3.1. Market size and forecast, by Capacity bands
- 7.5.5.3.2. Market size and forecast, by Installation location
- 7.5.5.3.3. Market size and forecast, by End use industry
CHAPTER 8: COMPETITIVE LANDSCAPE
- 8.1. Introduction
- 8.2. Top winning strategies
- 8.3. Product mapping of top 10 player
- 8.4. Competitive dashboard
- 8.5. Competitive heatmap
- 8.6. Top player positioning, 2023
CHAPTER 9: COMPANY PROFILES
- 9.1. ABB
- 9.1.1. Company overview
- 9.1.2. Key executives
- 9.1.3. Company snapshot
- 9.1.4. Operating business segments
- 9.1.5. Product portfolio
- 9.1.6. Business performance
- 9.1.7. Key strategic moves and developments
- 9.2. Schneider Electric
- 9.2.1. Company overview
- 9.2.2. Key executives
- 9.2.3. Company snapshot
- 9.2.4. Operating business segments
- 9.2.5. Product portfolio
- 9.2.6. Business performance
- 9.2.7. Key strategic moves and developments
- 9.3. Eaton Corporation
- 9.3.1. Company overview
- 9.3.2. Key executives
- 9.3.3. Company snapshot
- 9.3.4. Operating business segments
- 9.3.5. Product portfolio
- 9.3.6. Business performance
- 9.3.7. Key strategic moves and developments
- 9.4. Legrand
- 9.4.1. Company overview
- 9.4.2. Key executives
- 9.4.3. Company snapshot
- 9.4.4. Operating business segments
- 9.4.5. Product portfolio
- 9.4.6. Business performance
- 9.5. Fuji Electric Co. Ltd.
- 9.5.1. Company overview
- 9.5.2. Key executives
- 9.5.3. Company snapshot
- 9.5.4. Operating business segments
- 9.5.5. Product portfolio
- 9.5.6. Business performance
- 9.6. Mitsubishi Electric Corporation
- 9.6.1. Company overview
- 9.6.2. Key executives
- 9.6.3. Company snapshot
- 9.6.4. Operating business segments
- 9.6.5. Product portfolio
- 9.6.6. Business performance
- 9.6.7. Key strategic moves and developments
- 9.7. TOSHIBA CORPORATION
- 9.7.1. Company overview
- 9.7.2. Key executives
- 9.7.3. Company snapshot
- 9.7.4. Operating business segments
- 9.7.5. Product portfolio
- 9.7.6. Business performance
- 9.8. Siemens AG
- 9.8.1. Company overview
- 9.8.2. Key executives
- 9.8.3. Company snapshot
- 9.8.4. Operating business segments
- 9.8.5. Product portfolio
- 9.8.6. Business performance
- 9.8.7. Key strategic moves and developments
- 9.9. Arteche
- 9.9.1. Company overview
- 9.9.2. Key executives
- 9.9.3. Company snapshot
- 9.9.4. Operating business segments
- 9.9.5. Product portfolio
- 9.9.6. Business performance
- 9.10. Chint Electric Co Ltd
- 9.10.1. Company overview
- 9.10.2. Key executives
- 9.10.3. Company snapshot
- 9.10.4. Operating business segments
- 9.10.5. Product portfolio
- 9.11. Myers Power Products Inc.
- 9.11.1. Company overview
- 9.11.2. Key executives
- 9.11.3. Company snapshot
- 9.11.4. Operating business segments
- 9.11.5. Product portfolio
- 9.12. Avail SWGR
- 9.12.1. Company overview
- 9.12.2. Key executives
- 9.12.3. Company snapshot
- 9.12.4. Operating business segments
- 9.12.5. Product portfolio
- 9.13. Crompton Greaves Consumer Electricals Ltd
- 9.13.1. Company overview
- 9.13.2. Key executives
- 9.13.3. Company snapshot
- 9.13.4. Operating business segments
- 9.13.5. Product portfolio
- 9.13.6. Business performance
- 9.14. Tavrida Electric AG
- 9.14.1. Company overview
- 9.14.2. Key executives
- 9.14.3. Company snapshot
- 9.14.4. Operating business segments
- 9.14.5. Product portfolio
- 9.15. CG Power and Industrial Solutions Ltd.
- 9.15.1. Company overview
- 9.15.2. Key executives
- 9.15.3. Company snapshot
- 9.15.4. Operating business segments
- 9.15.5. Product portfolio
- 9.15.6. Business performance
