|
|
市場調査レポート
商品コード
1513428
排水ポンプの世界市場:タイプ別、容量別、エンドユーザー別 - 機会分析・産業予測、2024~2032年Sump Pumps Market By Type (Submersible Sump Pumps, Pedestal Sump Pumps), By Capacity (Low, Medium, High), By End User (Residential, Commercial, Industrial): Global Opportunity Analysis and Industry Forecast, 2024-2032 |
||||||
|
|
|||||||
|
|||||||


| 排水ポンプの世界市場:タイプ別、容量別、エンドユーザー別 - 機会分析・産業予測、2024~2032年 |
|
出版日: 2024年04月01日
発行: Allied Market Research
ページ情報: 英文 290 Pages
納期: 2~3営業日
|

- 全表示
- 概要
- 図表
- 目次
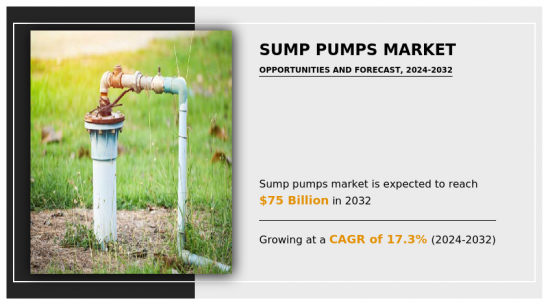
世界の排水ポンプの市場規模は、2023年に181億1,670万米ドルに達し、2023~2032年にかけてCAGR 17.3%で成長し、2032年には749億6,430万米ドルに達すると予測されています。
排水ポンプは、遠心式または水中式のポンプの一種で、排水ピットに溜まった水を排除するために特別に設計されています。縦型排水ポンプは、部分的に液中に浸漬される構造で、ポンプ端は液中に浸漬され、軸受柱は液面上に延びます。排水ポンプは、スラリー、摩耗性固形物を懸濁液に含む液体、および腐食、摩耗、極端な温度を含む困難なポンピング状況の管理に使用されます。さらに、排水ポンプは、住宅、商業、産業、自治体、農業地域などのさまざまな環境で、地下室、ピット、または収集タンクから水やその他の液体を排除または上昇させるために利用されています。
さらに、排水桝の排水管は、地下水によって運ばれるゴミやガンクによって頻繁に妨害されます。このような小石、シルト、土、その他の堆積物の蓄積により、パイプの直径が徐々に小さくなり、水の流れが妨げられます。最終的には、堆積したゴミがパイプを完全に塞いでしまい、地下室が水浸しになります。排水管の詰まりは、床や壁からの水漏れにつながり、その建物に住む人をカビや湿った地下室に関連する様々な問題にさらすことになります。さらに、不適切な埋設のために排水管が冬に凍結すると、ポンプが過熱し、最終的に焼損します。排水ポンプが故障すると、地下室が水浸しになるリスクが大幅に高まります。このような問題に対処するため、排水ポンプが住宅所有者に使用されることが増えており、住宅所有者が水害から財産を守るのに役立っています。住宅の地下室に設置された排水ポンプは、基礎を取り囲む余分な地下水を効果的に除去し、潜在的な水害から財産を守る。このポンプは効率的に水を排出パイプに導き、家から離れた場所や指定された自治体の雨水管に効果的に水を流します。
排水ポンプの人気の急上昇は、メーカーが拡大し、ユーザーが先進的で独創的な商品を受け取るチャンスをいくつも生み出しています。見過ごされてきた利点のひとつに、ポンプには火災発生の可能性を減少させる能力があることが挙げられます。水と火は混ざらないという通説があるが、この2つには直接的な相関関係があります。水が生きている電線に触れると、火花が散る。この火花は、電化製品や電子機器に引火したり、近くの可燃物に引火したりする可能性があります。たとえ床に水があったとしても、火はエスカレートし、家全体に急速に広がります。ポンプを利用して地下室から水を排除することで、水が電線に接触して火災を引き起こす危険性を大幅に減らすことができます。また、電線が水に近い場所で感電するリスクを最小限に抑えることができます。
タイプ別では、水中排水ポンプセグメントが2023年に最大の収益を上げました。水中ポンプは、液体を引っ張るのではなく、液体を押すことによって機能し、ポンププロセスを非常に効率的にします。この設計では、ポンプが浸漬されている液体の揚程を利用して作動するため、ポンプに液体を引き込むためにエネルギーを消費する必要がないです。さらに、周囲の液体がモーターを冷却し、オーバーヒートを防ぐため、ポンプは水中に浸かることで恩恵を受けます。石油・ガス分野の多くの水中ポンプは、電動水中ポンプ(ESP)の原理に基づいて機能しています。この技術は、深井戸から大量の流体を抽出するためのコスト効率の高いアプローチであることが証明されています。ESPシステムに組み込まれているモーターは、高温高圧に耐えられるように特別に設計されています。これらのモーターには独自の電力ケーブルが必要となり、運用コストが高くなる可能性があります。このような要因により、産業界ではより高性能な水中排水ポンプの需要が生じています。
容量別では、中型セグメントが2023年に最大の収益を上げました。これらのポンプは、様々な産業、農業、家庭で幅広い用途に利用されています。出力範囲が5~15馬力の水中ポンプは、電気的・機械的効率を向上させ、大幅なエネルギー節約と不安定な電源に起因する電気的過負荷問題の効果的な管理につながります。これらのポンプは、産業用水供給、水処理施設、農業、住宅地、商業施設、およびこの出力範囲内の他のさまざまな産業環境に適用することができます。
エンドユーザー別では、2023年に最も収益が大きかったのは産業用セグメントでした。産業用排水ポンプは、特に排水、産業廃棄物、生ごみ、スラリーなどの汚染水の除去が必要な場面で、脱水目的で頻繁に利用されます。一般的に電気モーターで駆動するこれらのポンプは、地表水や地下水を排除する必要がある建設現場など、洪水の影響を受けやすい低地でよく採用されています。さらに、ソーラーポンプは、電気が利用できなかったり信頼できなかったりする国の農村部に適しています。従来のポンプとは対照的に、ソーラーポンプは環境に優しいです。化石燃料に依存する従来のポンプは、ガスの排出を通じて気候変動の原因となっていたが、ソーラーポンプは排出がゼロで、カーボンフットプリントも最小限に抑えられます。このため、環境への影響を最小限に抑えることを目指す農家にとっては、持続可能な選択肢となります。
排水ポンプ市場は、タイプ、容量、エンドユーザー、地域によって区分されます。タイプ別では、水中排水ポンプと台座式排水ポンプに分類されます。容量によって、低容量、中容量、高容量に分けられます。エンドユーザー別では、住宅用、商業用、産業用に分類されます。地域別では、北米、欧州、アジア太平洋、中東・アフリカで分析されます。
利害関係者にとっての主なメリット
- 当レポートでは、2023~2032年にかけての排水ポンプ市場分析の市場セグメント、現在の動向、推定・動向、力学を定量的に分析し、排水ポンプ市場の有力な機会を特定します。
- 市場促進要因、市場抑制要因、市場機会に関連する情報とともに市場調査を提供します。
- ポーターのファイブフォース分析では、利害関係者が利益重視のビジネス決定を下し、サプライヤーとバイヤーのネットワークを強化できるよう、バイヤーとサプライヤーの力を強調します。
- 排水ポンプ市場のセグメンテーションの詳細な分析により、市場機会を見極めることができます。
- 各地域の主要国は、世界市場への収益貢献度に応じてマッピングされています。
- 市場プレイヤーのポジショニングはベンチマーキングを容易にし、市場プレイヤーの現在のポジションを明確に理解することができます。
- 本レポートには、地域別および世界の排水ポンプ市場動向、主要企業、市場セグメント、応用分野、市場成長戦略の分析が含まれています。
目次
第1章 イントロダクション
第2章 エグゼクティブサマリー
第3章 市場概要
- 市場の定義と範囲
- 主な調査結果
- 影響要因
- 主な投資機会
- ポーターのファイブフォース分析
- 市場力学
- 促進要因
- 抑制要因
- 機会
第4章 排水ポンプ市場:タイプ別
- 概要
- 水中排水ポンプ
- 台座式排水ポンプ
第5章 排水ポンプ市場:容量別
- 概要
- 低
- 中
- 高
第6章 排水ポンプ市場:エンドユーザー別
- 概要
- 住宅用
- 商業用
- 産業用
第7章 排水ポンプ市場:地域別
- 概要
- 北米
- 米国
- カナダ
- メキシコ
- 欧州
- ドイツ
- フランス
- 英国
- イタリア
- その他の欧州
- アジア太平洋
- 中国
- 日本
- 韓国
- インド
- その他のアジア太平洋
- ラテンアメリカ
- ブラジル
- アルゼンチン
- コロンビア
- チリ
- その他のラテンアメリカ
- 中東・アフリカ
- サウジアラビア
- アラブ首長国連邦
- ナイジェリア
- エジプト
- その他の中東・アフリカ
第8章 競合情勢
- イントロダクション
- 主要成功戦略
- 主要10社の製品マッピング
- 競合ダッシュボード
- 競合ヒートマップ
- 主要企業のポジショニング、2023年
第9章 企業プロファイル
- Zoeller Pumps Company
- EBARA CORPORATION
- Xylem, Inc.
- Flowserve Corporation
- WILO SE
- Dover Corporation
- Sulzer Ltd.
- Alfa Level AB
- Baker Hughes Company
- KSB SE
LIST OF TABLES
- TABLE 01. GLOBAL SUMP PUMPS MARKET, BY TYPE, 2023-2032 ($MILLION)
- TABLE 02. SUMP PUMPS MARKET FOR SUBMERSIBLE SUMP PUMPS, BY REGION, 2023-2032 ($MILLION)
- TABLE 03. SUMP PUMPS MARKET FOR PEDESTAL SUMP PUMPS, BY REGION, 2023-2032 ($MILLION)
- TABLE 04. GLOBAL SUMP PUMPS MARKET, BY CAPACITY, 2023-2032 ($MILLION)
- TABLE 05. SUMP PUMPS MARKET FOR LOW, BY REGION, 2023-2032 ($MILLION)
- TABLE 06. SUMP PUMPS MARKET FOR MEDIUM, BY REGION, 2023-2032 ($MILLION)
- TABLE 07. SUMP PUMPS MARKET FOR HIGH, BY REGION, 2023-2032 ($MILLION)
- TABLE 08. GLOBAL SUMP PUMPS MARKET, BY END USER, 2023-2032 ($MILLION)
- TABLE 09. SUMP PUMPS MARKET FOR RESIDENTIAL, BY REGION, 2023-2032 ($MILLION)
- TABLE 10. SUMP PUMPS MARKET FOR COMMERCIAL, BY REGION, 2023-2032 ($MILLION)
- TABLE 11. SUMP PUMPS MARKET FOR INDUSTRIAL, BY REGION, 2023-2032 ($MILLION)
- TABLE 12. SUMP PUMPS MARKET, BY REGION, 2023-2032 ($MILLION)
- TABLE 13. NORTH AMERICA SUMP PUMPS MARKET, BY TYPE, 2023-2032 ($MILLION)
- TABLE 14. NORTH AMERICA SUMP PUMPS MARKET, BY CAPACITY, 2023-2032 ($MILLION)
- TABLE 15. NORTH AMERICA SUMP PUMPS MARKET, BY END USER, 2023-2032 ($MILLION)
- TABLE 16. NORTH AMERICA SUMP PUMPS MARKET, BY COUNTRY, 2023-2032 ($MILLION)
- TABLE 17. U.S. SUMP PUMPS MARKET, BY TYPE, 2023-2032 ($MILLION)
- TABLE 18. U.S. SUMP PUMPS MARKET, BY CAPACITY, 2023-2032 ($MILLION)
- TABLE 19. U.S. SUMP PUMPS MARKET, BY END USER, 2023-2032 ($MILLION)
- TABLE 20. CANADA SUMP PUMPS MARKET, BY TYPE, 2023-2032 ($MILLION)
- TABLE 21. CANADA SUMP PUMPS MARKET, BY CAPACITY, 2023-2032 ($MILLION)
- TABLE 22. CANADA SUMP PUMPS MARKET, BY END USER, 2023-2032 ($MILLION)
- TABLE 23. MEXICO SUMP PUMPS MARKET, BY TYPE, 2023-2032 ($MILLION)
- TABLE 24. MEXICO SUMP PUMPS MARKET, BY CAPACITY, 2023-2032 ($MILLION)
- TABLE 25. MEXICO SUMP PUMPS MARKET, BY END USER, 2023-2032 ($MILLION)
- TABLE 26. EUROPE SUMP PUMPS MARKET, BY TYPE, 2023-2032 ($MILLION)
- TABLE 27. EUROPE SUMP PUMPS MARKET, BY CAPACITY, 2023-2032 ($MILLION)
- TABLE 28. EUROPE SUMP PUMPS MARKET, BY END USER, 2023-2032 ($MILLION)
- TABLE 29. EUROPE SUMP PUMPS MARKET, BY COUNTRY, 2023-2032 ($MILLION)
- TABLE 30. GERMANY SUMP PUMPS MARKET, BY TYPE, 2023-2032 ($MILLION)
- TABLE 31. GERMANY SUMP PUMPS MARKET, BY CAPACITY, 2023-2032 ($MILLION)
- TABLE 32. GERMANY SUMP PUMPS MARKET, BY END USER, 2023-2032 ($MILLION)
- TABLE 33. FRANCE SUMP PUMPS MARKET, BY TYPE, 2023-2032 ($MILLION)
- TABLE 34. FRANCE SUMP PUMPS MARKET, BY CAPACITY, 2023-2032 ($MILLION)
- TABLE 35. FRANCE SUMP PUMPS MARKET, BY END USER, 2023-2032 ($MILLION)
- TABLE 36. UK SUMP PUMPS MARKET, BY TYPE, 2023-2032 ($MILLION)
- TABLE 37. UK SUMP PUMPS MARKET, BY CAPACITY, 2023-2032 ($MILLION)
- TABLE 38. UK SUMP PUMPS MARKET, BY END USER, 2023-2032 ($MILLION)
- TABLE 39. ITALY SUMP PUMPS MARKET, BY TYPE, 2023-2032 ($MILLION)
- TABLE 40. ITALY SUMP PUMPS MARKET, BY CAPACITY, 2023-2032 ($MILLION)
- TABLE 41. ITALY SUMP PUMPS MARKET, BY END USER, 2023-2032 ($MILLION)
- TABLE 42. REST OF EUROPE SUMP PUMPS MARKET, BY TYPE, 2023-2032 ($MILLION)
- TABLE 43. REST OF EUROPE SUMP PUMPS MARKET, BY CAPACITY, 2023-2032 ($MILLION)
- TABLE 44. REST OF EUROPE SUMP PUMPS MARKET, BY END USER, 2023-2032 ($MILLION)
- TABLE 45. ASIA-PACIFIC SUMP PUMPS MARKET, BY TYPE, 2023-2032 ($MILLION)
- TABLE 46. ASIA-PACIFIC SUMP PUMPS MARKET, BY CAPACITY, 2023-2032 ($MILLION)
- TABLE 47. ASIA-PACIFIC SUMP PUMPS MARKET, BY END USER, 2023-2032 ($MILLION)
- TABLE 48. ASIA-PACIFIC SUMP PUMPS MARKET, BY COUNTRY, 2023-2032 ($MILLION)
- TABLE 49. CHINA SUMP PUMPS MARKET, BY TYPE, 2023-2032 ($MILLION)
- TABLE 50. CHINA SUMP PUMPS MARKET, BY CAPACITY, 2023-2032 ($MILLION)
- TABLE 51. CHINA SUMP PUMPS MARKET, BY END USER, 2023-2032 ($MILLION)
- TABLE 52. JAPAN SUMP PUMPS MARKET, BY TYPE, 2023-2032 ($MILLION)
- TABLE 53. JAPAN SUMP PUMPS MARKET, BY CAPACITY, 2023-2032 ($MILLION)
- TABLE 54. JAPAN SUMP PUMPS MARKET, BY END USER, 2023-2032 ($MILLION)
- TABLE 55. SOUTH KOREA SUMP PUMPS MARKET, BY TYPE, 2023-2032 ($MILLION)
- TABLE 56. SOUTH KOREA SUMP PUMPS MARKET, BY CAPACITY, 2023-2032 ($MILLION)
- TABLE 57. SOUTH KOREA SUMP PUMPS MARKET, BY END USER, 2023-2032 ($MILLION)
- TABLE 58. INDIA SUMP PUMPS MARKET, BY TYPE, 2023-2032 ($MILLION)
- TABLE 59. INDIA SUMP PUMPS MARKET, BY CAPACITY, 2023-2032 ($MILLION)
- TABLE 60. INDIA SUMP PUMPS MARKET, BY END USER, 2023-2032 ($MILLION)
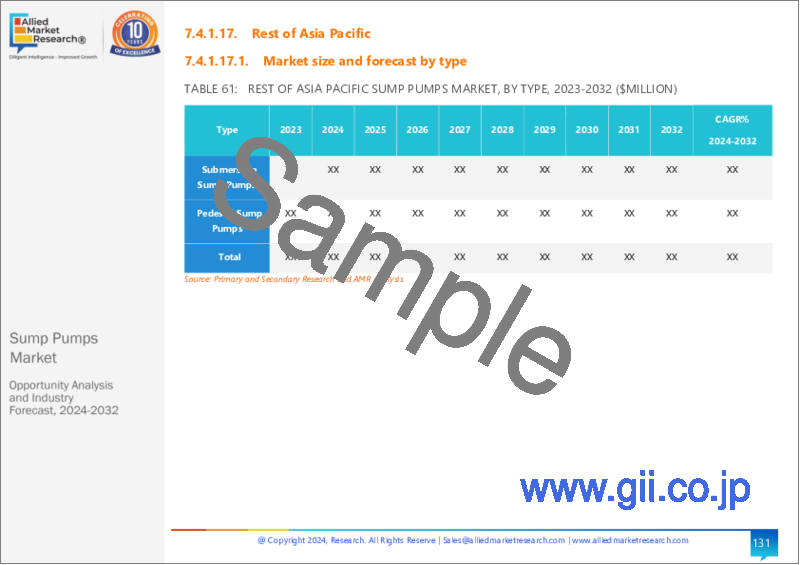
- TABLE 61. REST OF ASIA-PACIFIC SUMP PUMPS MARKET, BY TYPE, 2023-2032 ($MILLION)
- TABLE 62. REST OF ASIA-PACIFIC SUMP PUMPS MARKET, BY CAPACITY, 2023-2032 ($MILLION)
- TABLE 63. REST OF ASIA-PACIFIC SUMP PUMPS MARKET, BY END USER, 2023-2032 ($MILLION)
- TABLE 64. LATIN AMERICA SUMP PUMPS MARKET, BY TYPE, 2023-2032 ($MILLION)
- TABLE 65. LATIN AMERICA SUMP PUMPS MARKET, BY CAPACITY, 2023-2032 ($MILLION)
- TABLE 66. LATIN AMERICA SUMP PUMPS MARKET, BY END USER, 2023-2032 ($MILLION)
- TABLE 67. LATIN AMERICA SUMP PUMPS MARKET, BY COUNTRY, 2023-2032 ($MILLION)
- TABLE 68. BRAZIL SUMP PUMPS MARKET, BY TYPE, 2023-2032 ($MILLION)
- TABLE 69. BRAZIL SUMP PUMPS MARKET, BY CAPACITY, 2023-2032 ($MILLION)
- TABLE 70. BRAZIL SUMP PUMPS MARKET, BY END USER, 2023-2032 ($MILLION)
- TABLE 71. ARGENTINA SUMP PUMPS MARKET, BY TYPE, 2023-2032 ($MILLION)
- TABLE 72. ARGENTINA SUMP PUMPS MARKET, BY CAPACITY, 2023-2032 ($MILLION)
- TABLE 73. ARGENTINA SUMP PUMPS MARKET, BY END USER, 2023-2032 ($MILLION)
- TABLE 74. COLOMBIA SUMP PUMPS MARKET, BY TYPE, 2023-2032 ($MILLION)
- TABLE 75. COLOMBIA SUMP PUMPS MARKET, BY CAPACITY, 2023-2032 ($MILLION)
- TABLE 76. COLOMBIA SUMP PUMPS MARKET, BY END USER, 2023-2032 ($MILLION)
- TABLE 77. CHILE SUMP PUMPS MARKET, BY TYPE, 2023-2032 ($MILLION)
- TABLE 78. CHILE SUMP PUMPS MARKET, BY CAPACITY, 2023-2032 ($MILLION)
- TABLE 79. CHILE SUMP PUMPS MARKET, BY END USER, 2023-2032 ($MILLION)
- TABLE 80. REST OF LATIN AMERICA SUMP PUMPS MARKET, BY TYPE, 2023-2032 ($MILLION)
- TABLE 81. REST OF LATIN AMERICA SUMP PUMPS MARKET, BY CAPACITY, 2023-2032 ($MILLION)
- TABLE 82. REST OF LATIN AMERICA SUMP PUMPS MARKET, BY END USER, 2023-2032 ($MILLION)
- TABLE 83. MIDDLE EAST AND AFRICA SUMP PUMPS MARKET, BY TYPE, 2023-2032 ($MILLION)
- TABLE 84. MIDDLE EAST AND AFRICA SUMP PUMPS MARKET, BY CAPACITY, 2023-2032 ($MILLION)
- TABLE 85. MIDDLE EAST AND AFRICA SUMP PUMPS MARKET, BY END USER, 2023-2032 ($MILLION)
- TABLE 86. MIDDLE EAST AND AFRICA SUMP PUMPS MARKET, BY COUNTRY, 2023-2032 ($MILLION)
- TABLE 87. SAUDI ARABIA SUMP PUMPS MARKET, BY TYPE, 2023-2032 ($MILLION)
- TABLE 88. SAUDI ARABIA SUMP PUMPS MARKET, BY CAPACITY, 2023-2032 ($MILLION)
- TABLE 89. SAUDI ARABIA SUMP PUMPS MARKET, BY END USER, 2023-2032 ($MILLION)
- TABLE 90. UAE SUMP PUMPS MARKET, BY TYPE, 2023-2032 ($MILLION)
- TABLE 91. UAE SUMP PUMPS MARKET, BY CAPACITY, 2023-2032 ($MILLION)
- TABLE 92. UAE SUMP PUMPS MARKET, BY END USER, 2023-2032 ($MILLION)
- TABLE 93. NIGERIA SUMP PUMPS MARKET, BY TYPE, 2023-2032 ($MILLION)
- TABLE 94. NIGERIA SUMP PUMPS MARKET, BY CAPACITY, 2023-2032 ($MILLION)
- TABLE 95. NIGERIA SUMP PUMPS MARKET, BY END USER, 2023-2032 ($MILLION)
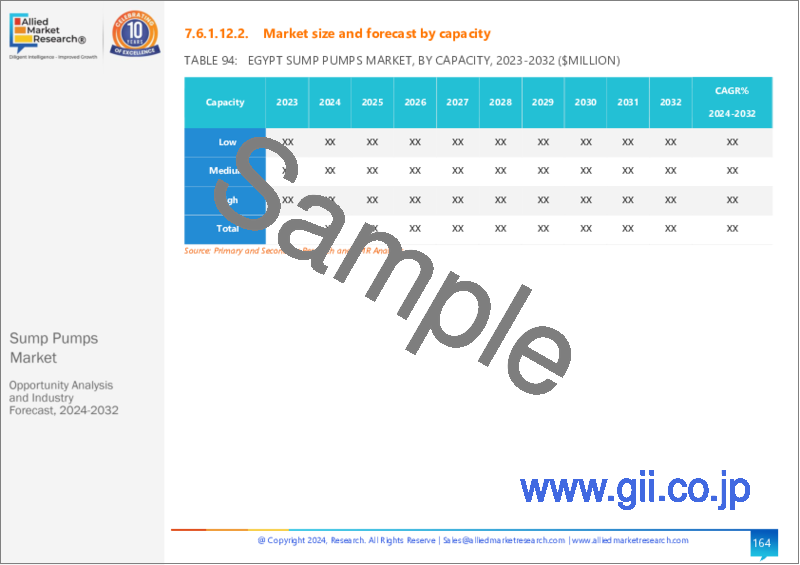
- TABLE 96. EGYPT SUMP PUMPS MARKET, BY TYPE, 2023-2032 ($MILLION)
- TABLE 97. EGYPT SUMP PUMPS MARKET, BY CAPACITY, 2023-2032 ($MILLION)
- TABLE 98. EGYPT SUMP PUMPS MARKET, BY END USER, 2023-2032 ($MILLION)
- TABLE 99. REST OF MIDDLE EAST AND AFRICA SUMP PUMPS MARKET, BY TYPE, 2023-2032 ($MILLION)
- TABLE 100. REST OF MIDDLE EAST AND AFRICA SUMP PUMPS MARKET, BY CAPACITY, 2023-2032 ($MILLION)
- TABLE 101. REST OF MIDDLE EAST AND AFRICA SUMP PUMPS MARKET, BY END USER, 2023-2032 ($MILLION)
- TABLE 102. Zoeller Company: KEY EXECUTIVES
- TABLE 103. Zoeller Company: COMPANY SNAPSHOT
- TABLE 104. Zoeller Company: PRODUCT SEGMENTS
- TABLE 105. Zoeller Company: SERVICE SEGMENTS
- TABLE 106. Zoeller Company: PRODUCT PORTFOLIO
- TABLE 107. Zoeller Company: KEY STRATEGIES
- TABLE 108. EBARA CORPORATION: KEY EXECUTIVES
- TABLE 109. EBARA CORPORATION: COMPANY SNAPSHOT
- TABLE 110. EBARA CORPORATION: PRODUCT SEGMENTS
- TABLE 111. EBARA CORPORATION: SERVICE SEGMENTS
- TABLE 112. EBARA CORPORATION: PRODUCT PORTFOLIO
- TABLE 113. EBARA CORPORATION: KEY STRATEGIES
- TABLE 114. Xylem: KEY EXECUTIVES
- TABLE 115. Xylem: COMPANY SNAPSHOT
- TABLE 116. Xylem: PRODUCT SEGMENTS
- TABLE 117. Xylem: SERVICE SEGMENTS
- TABLE 118. Xylem: PRODUCT PORTFOLIO
- TABLE 119. Xylem: KEY STRATEGIES
- TABLE 120. FLOWSERVE CORPORATION: KEY EXECUTIVES
- TABLE 121. FLOWSERVE CORPORATION: COMPANY SNAPSHOT
- TABLE 122. FLOWSERVE CORPORATION: PRODUCT SEGMENTS
- TABLE 123. FLOWSERVE CORPORATION: SERVICE SEGMENTS
- TABLE 124. FLOWSERVE CORPORATION: PRODUCT PORTFOLIO
- TABLE 125. FLOWSERVE CORPORATION: KEY STRATEGIES
- TABLE 126. WILO SE: KEY EXECUTIVES
- TABLE 127. WILO SE: COMPANY SNAPSHOT
- TABLE 128. WILO SE: PRODUCT SEGMENTS
- TABLE 129. WILO SE: SERVICE SEGMENTS
- TABLE 130. WILO SE: PRODUCT PORTFOLIO
- TABLE 131. WILO SE: KEY STRATEGIES
- TABLE 132. DOVER CORPORATION: KEY EXECUTIVES
- TABLE 133. DOVER CORPORATION: COMPANY SNAPSHOT
- TABLE 134. DOVER CORPORATION: PRODUCT SEGMENTS
- TABLE 135. DOVER CORPORATION: SERVICE SEGMENTS
- TABLE 136. DOVER CORPORATION: PRODUCT PORTFOLIO
- TABLE 137. DOVER CORPORATION: KEY STRATEGIES
- TABLE 138. SULZER LTD.: KEY EXECUTIVES
- TABLE 139. SULZER LTD.: COMPANY SNAPSHOT
- TABLE 140. SULZER LTD.: PRODUCT SEGMENTS
- TABLE 141. SULZER LTD.: SERVICE SEGMENTS
- TABLE 142. SULZER LTD.: PRODUCT PORTFOLIO
- TABLE 143. SULZER LTD.: KEY STRATEGIES
- TABLE 144. ALFA LAVAL: KEY EXECUTIVES
- TABLE 145. ALFA LAVAL: COMPANY SNAPSHOT
- TABLE 146. ALFA LAVAL: PRODUCT SEGMENTS
- TABLE 147. ALFA LAVAL: SERVICE SEGMENTS
- TABLE 148. ALFA LAVAL: PRODUCT PORTFOLIO
- TABLE 149. ALFA LAVAL: KEY STRATEGIES
- TABLE 150. BAKER HUGHES COMPANY: KEY EXECUTIVES
- TABLE 151. BAKER HUGHES COMPANY: COMPANY SNAPSHOT
- TABLE 152. BAKER HUGHES COMPANY: PRODUCT SEGMENTS
- TABLE 153. BAKER HUGHES COMPANY: SERVICE SEGMENTS
- TABLE 154. BAKER HUGHES COMPANY: PRODUCT PORTFOLIO
- TABLE 155. BAKER HUGHES COMPANY: KEY STRATEGIES
- TABLE 156. KSB SE & Co. KGaA: KEY EXECUTIVES
- TABLE 157. KSB SE & Co. KGaA: COMPANY SNAPSHOT
- TABLE 158. KSB SE & Co. KGaA: PRODUCT SEGMENTS
- TABLE 159. KSB SE & Co. KGaA: SERVICE SEGMENTS
- TABLE 160. KSB SE & Co. KGaA: PRODUCT PORTFOLIO
- TABLE 161. KSB SE & Co. KGaA: KEY STRATEGIES
LIST OF FIGURES
- FIGURE 01. SUMP PUMPS MARKET, 2023-2032
- FIGURE 02. SEGMENTATION OF SUMP PUMPS MARKET,2023-2032
- FIGURE 03. TOP IMPACTING FACTORS IN SUMP PUMPS MARKET
- FIGURE 04. TOP INVESTMENT POCKETS IN SUMP PUMPS MARKET (2024-2032)
- FIGURE 05. BARGAINING POWER OF SUPPLIERS
- FIGURE 06. BARGAINING POWER OF BUYERS
- FIGURE 07. THREAT OF SUBSTITUTION
- FIGURE 08. THREAT OF SUBSTITUTION
- FIGURE 09. COMPETITIVE RIVALRY
- FIGURE 10. GLOBAL SUMP PUMPS MARKET:DRIVERS, RESTRAINTS AND OPPORTUNITIES
- FIGURE 11. SUMP PUMPS MARKET, BY TYPE, 2023 AND 2032(%)
- FIGURE 12. COMPARATIVE SHARE ANALYSIS OF SUMP PUMPS MARKET FOR SUBMERSIBLE SUMP PUMPS, BY COUNTRY 2023 AND 2032(%)
- FIGURE 13. COMPARATIVE SHARE ANALYSIS OF SUMP PUMPS MARKET FOR PEDESTAL SUMP PUMPS, BY COUNTRY 2023 AND 2032(%)
- FIGURE 14. SUMP PUMPS MARKET, BY CAPACITY, 2023 AND 2032(%)
- FIGURE 15. COMPARATIVE SHARE ANALYSIS OF SUMP PUMPS MARKET FOR LOW, BY COUNTRY 2023 AND 2032(%)
- FIGURE 16. COMPARATIVE SHARE ANALYSIS OF SUMP PUMPS MARKET FOR MEDIUM, BY COUNTRY 2023 AND 2032(%)
- FIGURE 17. COMPARATIVE SHARE ANALYSIS OF SUMP PUMPS MARKET FOR HIGH, BY COUNTRY 2023 AND 2032(%)
- FIGURE 18. SUMP PUMPS MARKET, BY END USER, 2023 AND 2032(%)
- FIGURE 19. COMPARATIVE SHARE ANALYSIS OF SUMP PUMPS MARKET FOR RESIDENTIAL, BY COUNTRY 2023 AND 2032(%)
- FIGURE 20. COMPARATIVE SHARE ANALYSIS OF SUMP PUMPS MARKET FOR COMMERCIAL, BY COUNTRY 2023 AND 2032(%)
- FIGURE 21. COMPARATIVE SHARE ANALYSIS OF SUMP PUMPS MARKET FOR INDUSTRIAL, BY COUNTRY 2023 AND 2032(%)
- FIGURE 22. SUMP PUMPS MARKET BY REGION, 2023 AND 2032(%)
- FIGURE 23. U.S. SUMP PUMPS MARKET, 2023-2032 ($MILLION)
- FIGURE 24. CANADA SUMP PUMPS MARKET, 2023-2032 ($MILLION)
- FIGURE 25. MEXICO SUMP PUMPS MARKET, 2023-2032 ($MILLION)
- FIGURE 26. GERMANY SUMP PUMPS MARKET, 2023-2032 ($MILLION)
- FIGURE 27. FRANCE SUMP PUMPS MARKET, 2023-2032 ($MILLION)
- FIGURE 28. UK SUMP PUMPS MARKET, 2023-2032 ($MILLION)
- FIGURE 29. ITALY SUMP PUMPS MARKET, 2023-2032 ($MILLION)
- FIGURE 30. REST OF EUROPE SUMP PUMPS MARKET, 2023-2032 ($MILLION)
- FIGURE 31. CHINA SUMP PUMPS MARKET, 2023-2032 ($MILLION)
- FIGURE 32. JAPAN SUMP PUMPS MARKET, 2023-2032 ($MILLION)
- FIGURE 33. SOUTH KOREA SUMP PUMPS MARKET, 2023-2032 ($MILLION)
- FIGURE 34. INDIA SUMP PUMPS MARKET, 2023-2032 ($MILLION)
- FIGURE 35. REST OF ASIA-PACIFIC SUMP PUMPS MARKET, 2023-2032 ($MILLION)
- FIGURE 36. BRAZIL SUMP PUMPS MARKET, 2023-2032 ($MILLION)
- FIGURE 37. ARGENTINA SUMP PUMPS MARKET, 2023-2032 ($MILLION)
- FIGURE 38. COLOMBIA SUMP PUMPS MARKET, 2023-2032 ($MILLION)
- FIGURE 39. CHILE SUMP PUMPS MARKET, 2023-2032 ($MILLION)
- FIGURE 40. REST OF LATIN AMERICA SUMP PUMPS MARKET, 2023-2032 ($MILLION)
- FIGURE 41. SAUDI ARABIA SUMP PUMPS MARKET, 2023-2032 ($MILLION)
- FIGURE 42. UAE SUMP PUMPS MARKET, 2023-2032 ($MILLION)
- FIGURE 43. NIGERIA SUMP PUMPS MARKET, 2023-2032 ($MILLION)
- FIGURE 44. EGYPT SUMP PUMPS MARKET, 2023-2032 ($MILLION)
- FIGURE 45. REST OF MIDDLE EAST AND AFRICA SUMP PUMPS MARKET, 2023-2032 ($MILLION)
- FIGURE 46. TOP WINNING STRATEGIES, BY YEAR
- FIGURE 47. TOP WINNING STRATEGIES, BY DEVELOPMENT
- FIGURE 48. TOP WINNING STRATEGIES, BY COMPANY
- FIGURE 49. PRODUCT MAPPING OF TOP 10 PLAYERS
- FIGURE 50. COMPETITIVE DASHBOARD
- FIGURE 51. COMPETITIVE HEATMAP: SUMP PUMPS MARKET
- FIGURE 52. TOP PLAYER POSITIONING, 2023
The global sump pumps market size was valued at $18,116.7 million in 2023 and is projected to reach $74,964.3 million by 2032, registering a CAGR of 17.3% from 2023 to 2032.
A sump pumps is a type of pump, either centrifugal or submersible, which is specifically designed to eliminate water that has gathered in a sump pit. Vertical sump pumps are a partially submerged setup, where the pump end is submerged in the liquid while the bearing column extends above the liquid surface. Sump pumps are utilized for managing slurries, liquids that contain abrasive solids in suspension, and challenging pumping situations involving corrosion, abrasion, and extreme temperatures. Moreover, sump pumps are utilized in various settings such as residential, commercial, industrial, municipal, and agricultural areas to eliminate or raise water or other liquids from a basement, pit, or collection tank.
Furthermore, the drainpipe in the sump basin is frequently obstructed by debris and gunk carried by the groundwater. This accumulation of small rocks, silt, dirt, and other sediments gradually reduces the diameter of the pipe, impeding the flow of water. Eventually, the build-up of gunk completely blocks the pipe, resulting in basement flooding. Clogged drains lead to water leakage through the floor and walls and expose any person living in the building to mold and various other issues associated with a damp basement. Moreover, if the drain line freezes during winter due to improper burial, it causes the pump to overheat and eventually burn out. When the sump pump fails, the risk of basement flooding significantly increases. To tackle such issues, sump pumps are increasingly used by houseowners, which helps homeowners to save their property from water damage. The sump pump located in the basement of a home effectively removes excess groundwater surrounding the foundation, safeguarding property against potential water damage. This pump efficiently directs the water through a discharge pipe, effectively diverting it away from house or into a designated municipal storm pipe.
The surge in popularity of sump pumps creates several chances for manufacturers to expand and users to receive advanced and creative goods. One benefit that has been overlooked is that a pump has the ability to decrease the likelihood of a fire occurring. Despite the common belief that water and fire do not mix, there is a direct correlation between the two. When water comes into contact with live electric wires, it leads to sparking. This spark has the potential to ignite appliances or electronic devices or ignite nearby flammable materials. Even if there is water on the floor, the fire escalates and spreads rapidly throughout the entire house. By utilizing a pump to eliminate water from the basement, the risk of it coming into contact with electric wires and causing a fire is significantly reduced. In addition, it helps minimize the risk of individuals getting electrocuted in areas where electric wires are in close proximity to water.
By Type, the submersible sump pumps segment had the largest revenue in 2023. A submersible pump functions by pushing liquid instead of pulling it, making the pumping process highly efficient. This design utilizes the liquid's head in which it is immersed to operate, eliminating the need to expend energy on drawing the liquid into the pump. Additionally, the pump benefits from being submerged as the surrounding liquid cools the motor, preventing overheating. Numerous submersible pumps within the oil and gas sector function based on the Electric Submersible Pumping (ESP) principle. This technique proves to be a cost-efficient approach for extracting substantial amounts of fluids from deep wells. The motors integrated into an ESP system are specifically engineered to withstand elevated temperatures and pressures. These motors necessitate unique electricity cables and may result in high operational costs. Such factors create demand for more enhance submersible sump pumps in industries.
By Capacity, the medium segment had the largest revenue in 2023. These pumps are utilized by a variety of industries, agriculture, and households for a wide array of purposes. Submersible pumps with a power range of 5-15 hp provide enhanced electrical and mechanical efficiency, leading to significant energy savings and effective management of electric overload issues caused by unstable power sources. These pumps can be applied in industrial water supply, water treatment facilities, farming, residential areas, commercial establishments, and various other industrial settings within this power range.
By End user, the industrial segment had the largest revenue in 2023. Industrial sump pumps are frequently utilized for dewatering purposes, specifically in scenarios where the elimination of contaminated water in effluent, industrial waste, raw sewage, or slurries is necessary. Typically driven by electric motors, these pumps are commonly employed in low-lying regions that are susceptible to flooding, such as construction sites that need to eliminate surface water or groundwater. In addition, solar pumps are well-suited for rural areas in countries where electricity is either unavailable or unreliable. In contrast to traditional pumps, solar-powered pumps are environmentally friendly. Conventional pumps that rely on fossil fuels contribute to climate change through gas emissions, whereas solar pumps have zero emissions and minimal carbon footprints. This makes them a sustainable option for farmers aiming to minimize their environmental impact.
The sump pumps market is segmented on the basis of type, capacity, end user, and region. By type, the market is categorized into submersible sump pumps, and pedestal sump pumps. Depending on capacity, it is divided into low, medium, and high. By end user, the market is segregated into residential, commercial, and industrial. and Region wise, the market is analyzed across North America, Europe, Asia-Pacific, LA, and MEA.
Competition Analysis
Key companies profiled in the sump pumps market include Zoeller Pump Company, Ebara Corporation, Xylem, Inc. Flowserve Corporation, WILO SE, Dover Corporation, Sulzer Ltd., Alfa Level AB, Baker Hughes Company, and KSB SE.
Key Benefits For Stakeholders
- This report provides a quantitative analysis of the market segments, current trends, estimations, and dynamics of the sump pumps market analysis from 2023 to 2032 to identify the prevailing sump pumps market opportunities.
- The market research is offered along with information related to key drivers, restraints, and opportunities.
- Porter's five forces analysis highlights the potency of buyers and suppliers to enable stakeholders make profit-oriented business decisions and strengthen their supplier-buyer network.
- In-depth analysis of the sump pumps market segmentation assists to determine the prevailing market opportunities.
- Major countries in each region are mapped according to their revenue contribution to the global market.
- Market player positioning facilitates benchmarking and provides a clear understanding of the present position of the market players.
- The report includes the analysis of the regional as well as global sump pumps market trends, key players, market segments, application areas, and market growth strategies.
Additional benefits you will get with this purchase are:
- Quarterly Update and* (only available with a corporate license, on listed price)
- 5 additional Company Profile of client Choice pre- or Post-purchase, as a free update.
- Free Upcoming Version on the Purchase of Five and Enterprise User License.
- 16 analyst hours of support* (post-purchase, if you find additional data requirements upon review of the report, you may receive support amounting to 16 analyst hours to solve questions, and post-sale queries)
- 15% Free Customization* (in case the scope or segment of the report does not match your requirements, 15% is equivalent to 3 working days of free work, applicable once)
- Free data Pack on the Five and Enterprise User License. (Excel version of the report)
- Free Updated report if the report is 6-12 months old or older.
- 24-hour priority response*
- Free Industry updates and white papers.
Possible Customization with this report (with additional cost and timeline, please talk to the sales executive to know more)
- End user preferences and pain points
- Investment Opportunities
- Product Benchmarking / Product specification and applications
- Product Life Cycles
- Upcoming/New Entrant by Regions
- Technology Trend Analysis
- Average Consumer Expenditure
- Consumer Preference and Product Specifications
- Market share analysis of players by products/segments
- New Product Development/ Product Matrix of Key Players
- Additional company profiles with specific to client's interest
- Additional country or region analysis- market size and forecast
- Key player details (including location, contact details, supplier/vendor network etc. in excel format)
- Market share analysis of players at global/region/country level
- SWOT Analysis
Key Market Segments
By Type
- Submersible Sump Pumps
- Pedestal Sump Pumps
By Capacity
- Low
- Medium
- High
By End User
- Residential
- Commercial
- Industrial
By Region
- North America
- U.S.
- Canada
- Mexico
- Europe
- Germany
- France
- UK
- Italy
- Rest of Europe
- Asia-Pacific
- China
- Japan
- South Korea
- India
- Rest of Asia-Pacific
- Latin America
- Brazil
- Argentina
- Colombia
- Chile
- Rest of Latin America
- Middle East and Africa
- Saudi Arabia
- UAE
- Nigeria
- Egypt
- Rest of Middle East And Africa
Key Market Players:
- EBARA CORPORATION
- Xylem, Inc.
- Flowserve Corporation
- WILO SE
- Dover Corporation
- Sulzer Ltd.
- Alfa Level AB
- Baker Hughes Company
- KSB SE
- Zoeller Pumps Company
TABLE OF CONTENTS
CHAPTER 1: INTRODUCTION
- 1.1. Report description
- 1.2. Key market segments
- 1.3. Key benefits to the stakeholders
- 1.4. Research methodology
- 1.4.1. Primary research
- 1.4.2. Secondary research
- 1.4.3. Analyst tools and models
CHAPTER 2: EXECUTIVE SUMMARY
- 2.1. CXO perspective
CHAPTER 3: MARKET OVERVIEW
- 3.1. Market definition and scope
- 3.2. Key findings
- 3.2.1. Top impacting factors
- 3.2.2. Top investment pockets
- 3.3. Porter's five forces analysis
- 3.4. Market dynamics
- 3.4.1. Drivers
- 3.4.2. Restraints
- 3.4.3. Opportunities
CHAPTER 4: SUMP PUMPS MARKET, BY TYPE
- 4.1. Overview
- 4.1.1. Market size and forecast
- 4.2. Submersible Sump Pumps
- 4.2.1. Key market trends, growth factors and opportunities
- 4.2.2. Market size and forecast, by region
- 4.2.3. Market share analysis by country
- 4.3. Pedestal Sump Pumps
- 4.3.1. Key market trends, growth factors and opportunities
- 4.3.2. Market size and forecast, by region
- 4.3.3. Market share analysis by country
CHAPTER 5: SUMP PUMPS MARKET, BY CAPACITY
- 5.1. Overview
- 5.1.1. Market size and forecast
- 5.2. Low
- 5.2.1. Key market trends, growth factors and opportunities
- 5.2.2. Market size and forecast, by region
- 5.2.3. Market share analysis by country
- 5.3. Medium
- 5.3.1. Key market trends, growth factors and opportunities
- 5.3.2. Market size and forecast, by region
- 5.3.3. Market share analysis by country
- 5.4. High
- 5.4.1. Key market trends, growth factors and opportunities
- 5.4.2. Market size and forecast, by region
- 5.4.3. Market share analysis by country
CHAPTER 6: SUMP PUMPS MARKET, BY END USER
- 6.1. Overview
- 6.1.1. Market size and forecast
- 6.2. Residential
- 6.2.1. Key market trends, growth factors and opportunities
- 6.2.2. Market size and forecast, by region
- 6.2.3. Market share analysis by country
- 6.3. Commercial
- 6.3.1. Key market trends, growth factors and opportunities
- 6.3.2. Market size and forecast, by region
- 6.3.3. Market share analysis by country
- 6.4. Industrial
- 6.4.1. Key market trends, growth factors and opportunities
- 6.4.2. Market size and forecast, by region
- 6.4.3. Market share analysis by country
CHAPTER 7: SUMP PUMPS MARKET, BY REGION
- 7.1. Overview
- 7.1.1. Market size and forecast By Region
- 7.2. North America
- 7.2.1. Key market trends, growth factors and opportunities
- 7.2.2. Market size and forecast, by Type
- 7.2.3. Market size and forecast, by Capacity
- 7.2.4. Market size and forecast, by End User
- 7.2.5. Market size and forecast, by country
- 7.2.5.1. U.S.
- 7.2.5.1.1. Market size and forecast, by Type
- 7.2.5.1.2. Market size and forecast, by Capacity
- 7.2.5.1.3. Market size and forecast, by End User
- 7.2.5.2. Canada
- 7.2.5.2.1. Market size and forecast, by Type
- 7.2.5.2.2. Market size and forecast, by Capacity
- 7.2.5.2.3. Market size and forecast, by End User
- 7.2.5.3. Mexico
- 7.2.5.3.1. Market size and forecast, by Type
- 7.2.5.3.2. Market size and forecast, by Capacity
- 7.2.5.3.3. Market size and forecast, by End User
- 7.3. Europe
- 7.3.1. Key market trends, growth factors and opportunities
- 7.3.2. Market size and forecast, by Type
- 7.3.3. Market size and forecast, by Capacity
- 7.3.4. Market size and forecast, by End User
- 7.3.5. Market size and forecast, by country
- 7.3.5.1. Germany
- 7.3.5.1.1. Market size and forecast, by Type
- 7.3.5.1.2. Market size and forecast, by Capacity
- 7.3.5.1.3. Market size and forecast, by End User
- 7.3.5.2. France
- 7.3.5.2.1. Market size and forecast, by Type
- 7.3.5.2.2. Market size and forecast, by Capacity
- 7.3.5.2.3. Market size and forecast, by End User
- 7.3.5.3. UK
- 7.3.5.3.1. Market size and forecast, by Type
- 7.3.5.3.2. Market size and forecast, by Capacity
- 7.3.5.3.3. Market size and forecast, by End User
- 7.3.5.4. Italy
- 7.3.5.4.1. Market size and forecast, by Type
- 7.3.5.4.2. Market size and forecast, by Capacity
- 7.3.5.4.3. Market size and forecast, by End User
- 7.3.5.5. Rest of Europe
- 7.3.5.5.1. Market size and forecast, by Type
- 7.3.5.5.2. Market size and forecast, by Capacity
- 7.3.5.5.3. Market size and forecast, by End User
- 7.4. Asia-Pacific
- 7.4.1. Key market trends, growth factors and opportunities
- 7.4.2. Market size and forecast, by Type
- 7.4.3. Market size and forecast, by Capacity
- 7.4.4. Market size and forecast, by End User
- 7.4.5. Market size and forecast, by country
- 7.4.5.1. China
- 7.4.5.1.1. Market size and forecast, by Type
- 7.4.5.1.2. Market size and forecast, by Capacity
- 7.4.5.1.3. Market size and forecast, by End User
- 7.4.5.2. Japan
- 7.4.5.2.1. Market size and forecast, by Type
- 7.4.5.2.2. Market size and forecast, by Capacity
- 7.4.5.2.3. Market size and forecast, by End User
- 7.4.5.3. South Korea
- 7.4.5.3.1. Market size and forecast, by Type
- 7.4.5.3.2. Market size and forecast, by Capacity
- 7.4.5.3.3. Market size and forecast, by End User
- 7.4.5.4. India
- 7.4.5.4.1. Market size and forecast, by Type
- 7.4.5.4.2. Market size and forecast, by Capacity
- 7.4.5.4.3. Market size and forecast, by End User
- 7.4.5.5. Rest of Asia-Pacific
- 7.4.5.5.1. Market size and forecast, by Type
- 7.4.5.5.2. Market size and forecast, by Capacity
- 7.4.5.5.3. Market size and forecast, by End User
- 7.5. Latin America
- 7.5.1. Key market trends, growth factors and opportunities
- 7.5.2. Market size and forecast, by Type
- 7.5.3. Market size and forecast, by Capacity
- 7.5.4. Market size and forecast, by End User
- 7.5.5. Market size and forecast, by country
- 7.5.5.1. Brazil
- 7.5.5.1.1. Market size and forecast, by Type
- 7.5.5.1.2. Market size and forecast, by Capacity
- 7.5.5.1.3. Market size and forecast, by End User
- 7.5.5.2. Argentina
- 7.5.5.2.1. Market size and forecast, by Type
- 7.5.5.2.2. Market size and forecast, by Capacity
- 7.5.5.2.3. Market size and forecast, by End User
- 7.5.5.3. Colombia
- 7.5.5.3.1. Market size and forecast, by Type
- 7.5.5.3.2. Market size and forecast, by Capacity
- 7.5.5.3.3. Market size and forecast, by End User
- 7.5.5.4. Chile
- 7.5.5.4.1. Market size and forecast, by Type
- 7.5.5.4.2. Market size and forecast, by Capacity
- 7.5.5.4.3. Market size and forecast, by End User
- 7.5.5.5. Rest of Latin America
- 7.5.5.5.1. Market size and forecast, by Type
- 7.5.5.5.2. Market size and forecast, by Capacity
- 7.5.5.5.3. Market size and forecast, by End User
- 7.6. Middle East and Africa
- 7.6.1. Key market trends, growth factors and opportunities
- 7.6.2. Market size and forecast, by Type
- 7.6.3. Market size and forecast, by Capacity
- 7.6.4. Market size and forecast, by End User
- 7.6.5. Market size and forecast, by country
- 7.6.5.1. Saudi Arabia
- 7.6.5.1.1. Market size and forecast, by Type
- 7.6.5.1.2. Market size and forecast, by Capacity
- 7.6.5.1.3. Market size and forecast, by End User
- 7.6.5.2. UAE
- 7.6.5.2.1. Market size and forecast, by Type
- 7.6.5.2.2. Market size and forecast, by Capacity
- 7.6.5.2.3. Market size and forecast, by End User
- 7.6.5.3. Nigeria
- 7.6.5.3.1. Market size and forecast, by Type
- 7.6.5.3.2. Market size and forecast, by Capacity
- 7.6.5.3.3. Market size and forecast, by End User
- 7.6.5.4. Egypt
- 7.6.5.4.1. Market size and forecast, by Type
- 7.6.5.4.2. Market size and forecast, by Capacity
- 7.6.5.4.3. Market size and forecast, by End User
- 7.6.5.5. Rest of Middle East And Africa
- 7.6.5.5.1. Market size and forecast, by Type
- 7.6.5.5.2. Market size and forecast, by Capacity
- 7.6.5.5.3. Market size and forecast, by End User
CHAPTER 8: COMPETITIVE LANDSCAPE
- 8.1. Introduction
- 8.2. Top winning strategies
- 8.3. Product mapping of top 10 player
- 8.4. Competitive dashboard
- 8.5. Competitive heatmap
- 8.6. Top player positioning, 2023
CHAPTER 9: COMPANY PROFILES
- 9.1. Zoeller Pumps Company
- 9.1.1. Company overview
- 9.1.2. Key executives
- 9.1.3. Company snapshot
- 9.1.4. Operating business segments
- 9.1.5. Product portfolio
- 9.1.6. Business performance
- 9.1.7. Key strategic moves and developments
- 9.2. EBARA CORPORATION
- 9.2.1. Company overview
- 9.2.2. Key executives
- 9.2.3. Company snapshot
- 9.2.4. Operating business segments
- 9.2.5. Product portfolio
- 9.2.6. Business performance
- 9.2.7. Key strategic moves and developments
- 9.3. Xylem, Inc.
- 9.3.1. Company overview
- 9.3.2. Key executives
- 9.3.3. Company snapshot
- 9.3.4. Operating business segments
- 9.3.5. Product portfolio
- 9.3.6. Business performance
- 9.3.7. Key strategic moves and developments
- 9.4. Flowserve Corporation
- 9.4.1. Company overview
- 9.4.2. Key executives
- 9.4.3. Company snapshot
- 9.4.4. Operating business segments
- 9.4.5. Product portfolio
- 9.4.6. Business performance
- 9.4.7. Key strategic moves and developments
- 9.5. WILO SE
- 9.5.1. Company overview
- 9.5.2. Key executives
- 9.5.3. Company snapshot
- 9.5.4. Operating business segments
- 9.5.5. Product portfolio
- 9.5.6. Business performance
- 9.5.7. Key strategic moves and developments
- 9.6. Dover Corporation
- 9.6.1. Company overview
- 9.6.2. Key executives
- 9.6.3. Company snapshot
- 9.6.4. Operating business segments
- 9.6.5. Product portfolio
- 9.6.6. Business performance
- 9.6.7. Key strategic moves and developments
- 9.7. Sulzer Ltd.
- 9.7.1. Company overview
- 9.7.2. Key executives
- 9.7.3. Company snapshot
- 9.7.4. Operating business segments
- 9.7.5. Product portfolio
- 9.7.6. Business performance
- 9.7.7. Key strategic moves and developments
- 9.8. Alfa Level AB
- 9.8.1. Company overview
- 9.8.2. Key executives
- 9.8.3. Company snapshot
- 9.8.4. Operating business segments
- 9.8.5. Product portfolio
- 9.8.6. Business performance
- 9.8.7. Key strategic moves and developments
- 9.9. Baker Hughes Company
- 9.9.1. Company overview
- 9.9.2. Key executives
- 9.9.3. Company snapshot
- 9.9.4. Operating business segments
- 9.9.5. Product portfolio
- 9.9.6. Business performance
- 9.9.7. Key strategic moves and developments
- 9.10. KSB SE
- 9.10.1. Company overview
- 9.10.2. Key executives
- 9.10.3. Company snapshot
- 9.10.4. Operating business segments
- 9.10.5. Product portfolio
- 9.10.6. Business performance
- 9.10.7. Key strategic moves and developments
