
|
市場調査レポート
商品コード
1513379
食器の世界市場:タイプ別、流通チャネル別 - 機会分析・産業予測、2023~2032年Tableware Market By Type (Opalware, Glassware, Melamine, Bone China, Ceramicware, Others), By Distribution Channel (Online, Offline): Global Opportunity Analysis and Industry Forecast, 2023-2032 |
||||||
|
|||||||

| 食器の世界市場:タイプ別、流通チャネル別 - 機会分析・産業予測、2023~2032年 |
|
出版日: 2024年04月01日
発行: Allied Market Research
ページ情報: 英文 310 Pages
納期: 2~3営業日
|

- 全表示
- 概要
- 図表
- 目次
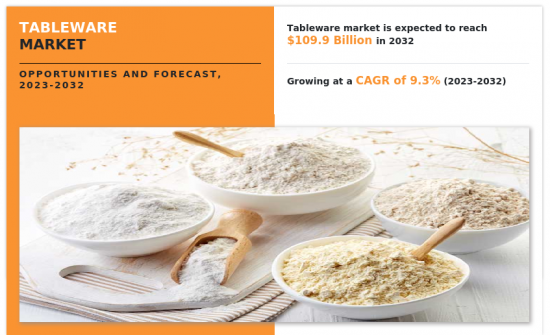
世界の食器の市場規模は、2022年に455億8,020万米ドルに達し、2023~2032年にかけてCAGR 9.3%で成長し、2032年には1,099億1,440万米ドルに達すると予測されています。
食器には、食事の際に使用される食器、調理器具、装飾品、テーブルセッティングに使用されるサーブウェアなどが含まれます。食器には、皿、ボウル、カップ、調理器具のような必需品のほか、取り皿やステムウェアも含まれます。一般的に、磁器、ストーンウェア、中国などの丈夫な素材で作られた食器は、食卓で実用的かつ美的な役割を果たします。食器の主な種類には、フラットウェア(食器)、ディナーウェア(皿やボウル)、グラスウェア(酒器)、サーブウェア(料理を盛り付けるもの)があります。それぞれの種類は、食事の実用的な側面からテーブルの演出という装飾的な側面に至るまで、食事の場で特定の機能を果たします。日常使いからフォーマルな場まで、食器は食卓を豊かにし、個人のスタイルの好みを反映する重要な役割を担っています。
陶磁器食器は、その多用途性と審美的な魅力から人気が高まっており、今後数年間で食器市場シェアを押し上げると予想されています。食器、特にセラミック食器の人気は、それを食卓に欠かせない要素にしているいくつかの要因に起因しています。第一に、陶器食器の多用途性と機能性が、その幅広い魅力に貢献しています。陶器の食器、ボウル、マグカップ、取り皿は、カジュアルな朝食からフォーマルなディナーまで、さまざまなタイプの食事に適しており、どんな場面でも万能に使えます。第二に、陶器食器の美的魅力がその人気に大きな役割を果たしています。デザイン、形、サイズ、色のバリエーションが豊富な陶磁器食器は、個人のスタイルを表現し、食卓のビジュアルアピールを高めることができます。フォーマルな晩餐会にはエレガントな磁器食器、家族団らんの食事には素朴な石器など、陶器食器はどんな食卓にも洗練された魅力を添えてくれます。特に磁器は耐久性に優れ、欠けやひび割れ、汚れに強いことで知られています。この耐久性により、セラミック食器は家庭やレストランにとって実用的で費用対効果の高い投資となります。さらに、セラミック食器は健康面や安全面でも優れているため、多くの消費者に選ばれています。プラスチックや金属製の食器とは異なり、セラミック食器は毒性がなく、食品に有害な化学物質を溶出させないため、汚染されることなく安全に食事を提供することができます。しかし、木製食器や粘土製食器の使用に関連する制限や欠点が、今後数年間の食器市場の成長を妨げると予想されます。重要な制約の1つは、木製製品は時間の経過とともにひび割れが生じやすいことです。こうしたひび割れは食器の構造的完全性を損なうだけでなく、切り傷や怪我を引き起こす可能性があるため、安全性にも懸念をもたらします。さらに、ひび割れがあると細菌が繁殖しやすい環境になるため、カビが生えるなどの健康被害が発生する可能性もあります。さらに、木製食器は消毒キャビネットで効果的に殺菌することができないため、使用後の徹底的な清潔を確保することが難しいです。同様に、粘土食器にもデメリットがあります。粘土食器はもともと壊れやすいため、破損を防ぐには繊細な扱いが必要です。また、長持ちさせるためにはシーズニングが必要で、温度変化により割れることもあります。土鍋の洗浄には特別な注意が必要で、多孔質であるため洗剤で洗うことができず、不適切な保管は菌やカビの繁殖につながります。セラミック食器の復活は、進化する消費者の嗜好や市場の需要に対応し、業界に無数の機会をもたらします。陶磁器食器の復活は、進化する消費者の嗜好や市場の需要に応えることで、業界に無数のチャンスをもたらします。ホスピタリティセクターがオーダーメイドのソリューションを求め続けているため、陶磁器食器メーカーが提供する製品を拡大し、多様な要件に対応する余地があります。形状、サイズ、色、ブランドなどの面でカスタマイズを提供することで、メーカーはパーソナライズされた食体験の動向を利用し、市場での競争力を高めることができます。さらに、陶磁器製食器は汎用性が高いため、デザインの革新性や創造性を高める機会にもなります。職人やデザイナーが陶磁器を表現媒体として取り入れることで、大胆な色使いや複雑な模様、持続可能なプロセスを探求できる可能性があります。さらに、陶器食器の持続可能性の側面は、環境に優しい選択肢を求める消費者の需要の高まりに乗じる機会を提供します。セラミック製品の耐久性と寿命の長さを強調することで、メーカーは、持続可能性を重視する傾向が強まる市場において、環境に配慮した選択肢として自らを位置づけることができます。さらに、オンラインショッピングの台頭は、持続可能で審美的な食器ソリューションを求める消費者を含め、より多くの人々にリーチし、新たな市場セグメントを開拓するためのプラットフォームを提供します。本レポートで紹介する主要企業には、Lenox Corporation、PITO、Steelite International、FIESTA TABLEWARE、PORCEL S.A.、Dudson、La Opala RG Limited、Noritake Co.が含まれています。市場関係者は、買収、提携、製品発売、事業拡大などの戦略を駆使して、この競合市場で優位な地位を獲得しようと絶えず努力しています。
- 当レポートは、2022~2032年までの食器市場分析の市場セグメント、現在の動向、推定・動向分析、力学の定量分析を提供し、食器市場の有力な機会を特定します。
- 市場促進要因、市場抑制要因、市場機会に関連する情報とともに市場調査を提供します。
- ポーターのファイブフォース分析では、利害関係者が利益重視のビジネス決定を下し、サプライヤーとバイヤーのネットワークを強化できるように、バイヤーとサプライヤーの潜在力を強調します。
- 食器市場セグメンテーションの詳細な分析は、市場機会を決定するのに役立ちます。
- 各地域の主要国は、世界市場への収益貢献度に応じてマッピングされています。
- 市場プレイヤーのポジショニングはベンチマーキングを容易にし、市場プレイヤーの現在のポジションを明確に理解することができます。
- 本レポートには、地域および世界の食器市場動向、主要企業、市場セグメント、応用分野、市場成長戦略の分析が含まれています。
目次
第1章 イントロダクション
第2章 エグゼクティブサマリー
第3章 市場概要
- 市場の定義と範囲
- 主な調査結果
- 影響要因
- 主な投資機会
- ポーターのファイブフォース分析
- 市場力学
- 促進要因
- 抑制要因
- 機会
- 市場シェア分析
- ブランドシェア分析
- バリューチェーン分析
- 主要プレーヤーの詳細
- 規制ガイドライン
- 特許状況
第4章 食器市場:タイプ別
- 概要
- オパール製品
- ガラス製品
- メラミン
- ボーンチャイナ
- 陶磁器
- その他
第5章 食器市場:流通チャネル別
- 概要
- オンライン
- オフライン
第6章 食器市場:地域別
- 概要
- 北米
- 米国
- カナダ
- メキシコ
- 欧州
- ドイツ
- 英国
- フランス
- イタリア
- スペイン
- その他の欧州
- アジア太平洋
- 中国
- 日本
- インド
- 韓国
- オーストラリア
- その他のアジア太平洋
- ラテンアメリカ・中東・アフリカ
- ブラジル
- サウジアラビア
- UAE
- 南アフリカ
- その他のラテンアメリカ・中東・アフリカ
第7章 競合情勢
- イントロダクション
- 主要成功戦略
- 主要10社の製品マッピング
- 競合ダッシュボード
- 競合ヒートマップ
- 主要企業のポジショニング、2022年
第8章 企業プロファイル
- Lenox Corporation
- Steelite International
- PITO
- FIESTA TABLEWARE
- PORCEL S.A.
- Dudson
- La Opala RG Limited
- Noritake Co., Ltd
- Wedgwood
- Villeroy & Boch
- Rosenthal GmbH
LIST OF TABLES
- TABLE 01. GLOBAL TABLEWARE MARKET, BY TYPE, 2022-2032 ($MILLION)
- TABLE 02. TABLEWARE MARKET FOR OPALWARE, BY REGION, 2022-2032 ($MILLION)
- TABLE 03. TABLEWARE MARKET FOR GLASSWARE, BY REGION, 2022-2032 ($MILLION)
- TABLE 04. TABLEWARE MARKET FOR MELAMINE, BY REGION, 2022-2032 ($MILLION)
- TABLE 05. TABLEWARE MARKET FOR BONE CHINA, BY REGION, 2022-2032 ($MILLION)
- TABLE 06. TABLEWARE MARKET FOR CERAMICWARE, BY REGION, 2022-2032 ($MILLION)
- TABLE 07. TABLEWARE MARKET FOR OTHERS, BY REGION, 2022-2032 ($MILLION)
- TABLE 08. GLOBAL TABLEWARE MARKET, BY DISTRIBUTION CHANNEL, 2022-2032 ($MILLION)
- TABLE 09. TABLEWARE MARKET FOR ONLINE, BY REGION, 2022-2032 ($MILLION)
- TABLE 10. TABLEWARE MARKET FOR OFFLINE, BY REGION, 2022-2032 ($MILLION)
- TABLE 11. TABLEWARE MARKET, BY REGION, 2022-2032 ($MILLION)
- TABLE 12. NORTH AMERICA TABLEWARE MARKET, BY TYPE, 2022-2032 ($MILLION)
- TABLE 13. NORTH AMERICA TABLEWARE MARKET, BY DISTRIBUTION CHANNEL, 2022-2032 ($MILLION)
- TABLE 14. NORTH AMERICA TABLEWARE MARKET, BY COUNTRY, 2022-2032 ($MILLION)
- TABLE 15. U.S. TABLEWARE MARKET, BY TYPE, 2022-2032 ($MILLION)
- TABLE 16. U.S. TABLEWARE MARKET, BY DISTRIBUTION CHANNEL, 2022-2032 ($MILLION)
- TABLE 17. CANADA TABLEWARE MARKET, BY TYPE, 2022-2032 ($MILLION)
- TABLE 18. CANADA TABLEWARE MARKET, BY DISTRIBUTION CHANNEL, 2022-2032 ($MILLION)
- TABLE 19. MEXICO TABLEWARE MARKET, BY TYPE, 2022-2032 ($MILLION)
- TABLE 20. MEXICO TABLEWARE MARKET, BY DISTRIBUTION CHANNEL, 2022-2032 ($MILLION)
- TABLE 21. EUROPE TABLEWARE MARKET, BY TYPE, 2022-2032 ($MILLION)
- TABLE 22. EUROPE TABLEWARE MARKET, BY DISTRIBUTION CHANNEL, 2022-2032 ($MILLION)
- TABLE 23. EUROPE TABLEWARE MARKET, BY COUNTRY, 2022-2032 ($MILLION)
- TABLE 24. GERMANY TABLEWARE MARKET, BY TYPE, 2022-2032 ($MILLION)
- TABLE 25. GERMANY TABLEWARE MARKET, BY DISTRIBUTION CHANNEL, 2022-2032 ($MILLION)
- TABLE 26. UK TABLEWARE MARKET, BY TYPE, 2022-2032 ($MILLION)
- TABLE 27. UK TABLEWARE MARKET, BY DISTRIBUTION CHANNEL, 2022-2032 ($MILLION)
- TABLE 28. FRANCE TABLEWARE MARKET, BY TYPE, 2022-2032 ($MILLION)
- TABLE 29. FRANCE TABLEWARE MARKET, BY DISTRIBUTION CHANNEL, 2022-2032 ($MILLION)
- TABLE 30. ITALY TABLEWARE MARKET, BY TYPE, 2022-2032 ($MILLION)
- TABLE 31. ITALY TABLEWARE MARKET, BY DISTRIBUTION CHANNEL, 2022-2032 ($MILLION)
- TABLE 32. SPAIN TABLEWARE MARKET, BY TYPE, 2022-2032 ($MILLION)
- TABLE 33. SPAIN TABLEWARE MARKET, BY DISTRIBUTION CHANNEL, 2022-2032 ($MILLION)
- TABLE 34. REST OF EUROPE TABLEWARE MARKET, BY TYPE, 2022-2032 ($MILLION)
- TABLE 35. REST OF EUROPE TABLEWARE MARKET, BY DISTRIBUTION CHANNEL, 2022-2032 ($MILLION)
- TABLE 36. ASIA-PACIFIC TABLEWARE MARKET, BY TYPE, 2022-2032 ($MILLION)
- TABLE 37. ASIA-PACIFIC TABLEWARE MARKET, BY DISTRIBUTION CHANNEL, 2022-2032 ($MILLION)
- TABLE 38. ASIA-PACIFIC TABLEWARE MARKET, BY COUNTRY, 2022-2032 ($MILLION)
- TABLE 39. CHINA TABLEWARE MARKET, BY TYPE, 2022-2032 ($MILLION)
- TABLE 40. CHINA TABLEWARE MARKET, BY DISTRIBUTION CHANNEL, 2022-2032 ($MILLION)
- TABLE 41. JAPAN TABLEWARE MARKET, BY TYPE, 2022-2032 ($MILLION)
- TABLE 42. JAPAN TABLEWARE MARKET, BY DISTRIBUTION CHANNEL, 2022-2032 ($MILLION)
- TABLE 43. INDIA TABLEWARE MARKET, BY TYPE, 2022-2032 ($MILLION)
- TABLE 44. INDIA TABLEWARE MARKET, BY DISTRIBUTION CHANNEL, 2022-2032 ($MILLION)
- TABLE 45. SOUTH KOREA TABLEWARE MARKET, BY TYPE, 2022-2032 ($MILLION)
- TABLE 46. SOUTH KOREA TABLEWARE MARKET, BY DISTRIBUTION CHANNEL, 2022-2032 ($MILLION)
- TABLE 47. AUSTRALIA TABLEWARE MARKET, BY TYPE, 2022-2032 ($MILLION)
- TABLE 48. AUSTRALIA TABLEWARE MARKET, BY DISTRIBUTION CHANNEL, 2022-2032 ($MILLION)
- TABLE 49. REST OF ASIA-PACIFIC TABLEWARE MARKET, BY TYPE, 2022-2032 ($MILLION)
- TABLE 50. REST OF ASIA-PACIFIC TABLEWARE MARKET, BY DISTRIBUTION CHANNEL, 2022-2032 ($MILLION)
- TABLE 51. LAMEA TABLEWARE MARKET, BY TYPE, 2022-2032 ($MILLION)
- TABLE 52. LAMEA TABLEWARE MARKET, BY DISTRIBUTION CHANNEL, 2022-2032 ($MILLION)
- TABLE 53. LAMEA TABLEWARE MARKET, BY COUNTRY, 2022-2032 ($MILLION)
- TABLE 54. BRAZIL TABLEWARE MARKET, BY TYPE, 2022-2032 ($MILLION)
- TABLE 55. BRAZIL TABLEWARE MARKET, BY DISTRIBUTION CHANNEL, 2022-2032 ($MILLION)
- TABLE 56. SAUDI ARABIA TABLEWARE MARKET, BY TYPE, 2022-2032 ($MILLION)
- TABLE 57. SAUDI ARABIA TABLEWARE MARKET, BY DISTRIBUTION CHANNEL, 2022-2032 ($MILLION)
- TABLE 58. UAE TABLEWARE MARKET, BY TYPE, 2022-2032 ($MILLION)
- TABLE 59. UAE TABLEWARE MARKET, BY DISTRIBUTION CHANNEL, 2022-2032 ($MILLION)
- TABLE 60. SOUTH AFRICA TABLEWARE MARKET, BY TYPE, 2022-2032 ($MILLION)
- TABLE 61. SOUTH AFRICA TABLEWARE MARKET, BY DISTRIBUTION CHANNEL, 2022-2032 ($MILLION)
- TABLE 62. REST OF LAMEA TABLEWARE MARKET, BY TYPE, 2022-2032 ($MILLION)
- TABLE 63. REST OF LAMEA TABLEWARE MARKET, BY DISTRIBUTION CHANNEL, 2022-2032 ($MILLION)
- TABLE 64. LENOX CORPORATION: KEY EXECUTIVES
- TABLE 65. LENOX CORPORATION: COMPANY SNAPSHOT
- TABLE 66. LENOX CORPORATION: PRODUCT SEGMENTS
- TABLE 67. LENOX CORPORATION: SERVICE SEGMENTS
- TABLE 68. LENOX CORPORATION: PRODUCT PORTFOLIO
- TABLE 69. LENOX CORPORATION: KEY STRATEGIES
- TABLE 70. STEELITE INTERNATIONAL: KEY EXECUTIVES
- TABLE 71. STEELITE INTERNATIONAL: COMPANY SNAPSHOT
- TABLE 72. STEELITE INTERNATIONAL: PRODUCT SEGMENTS
- TABLE 73. STEELITE INTERNATIONAL: SERVICE SEGMENTS
- TABLE 74. STEELITE INTERNATIONAL: PRODUCT PORTFOLIO
- TABLE 75. STEELITE INTERNATIONAL: KEY STRATEGIES
- TABLE 76. PITO: KEY EXECUTIVES
- TABLE 77. PITO: COMPANY SNAPSHOT
- TABLE 78. PITO: PRODUCT SEGMENTS
- TABLE 79. PITO: SERVICE SEGMENTS
- TABLE 80. PITO: PRODUCT PORTFOLIO
- TABLE 81. PITO: KEY STRATEGIES
- TABLE 82. FIESTA TABLEWARE: KEY EXECUTIVES
- TABLE 83. FIESTA TABLEWARE: COMPANY SNAPSHOT
- TABLE 84. FIESTA TABLEWARE: PRODUCT SEGMENTS
- TABLE 85. FIESTA TABLEWARE: SERVICE SEGMENTS
- TABLE 86. FIESTA TABLEWARE: PRODUCT PORTFOLIO
- TABLE 87. FIESTA TABLEWARE: KEY STRATEGIES
- TABLE 88. PORCEL S.A.: KEY EXECUTIVES
- TABLE 89. PORCEL S.A.: COMPANY SNAPSHOT
- TABLE 90. PORCEL S.A.: PRODUCT SEGMENTS
- TABLE 91. PORCEL S.A.: SERVICE SEGMENTS
- TABLE 92. PORCEL S.A.: PRODUCT PORTFOLIO
- TABLE 93. PORCEL S.A.: KEY STRATEGIES
- TABLE 94. DUDSON: KEY EXECUTIVES
- TABLE 95. DUDSON: COMPANY SNAPSHOT
- TABLE 96. DUDSON: PRODUCT SEGMENTS
- TABLE 97. DUDSON: SERVICE SEGMENTS
- TABLE 98. DUDSON: PRODUCT PORTFOLIO
- TABLE 99. DUDSON: KEY STRATEGIES
- TABLE 100. LA OPALA RG LIMITED: KEY EXECUTIVES
- TABLE 101. LA OPALA RG LIMITED: COMPANY SNAPSHOT
- TABLE 102. LA OPALA RG LIMITED: PRODUCT SEGMENTS
- TABLE 103. LA OPALA RG LIMITED: SERVICE SEGMENTS
- TABLE 104. LA OPALA RG LIMITED: PRODUCT PORTFOLIO
- TABLE 105. LA OPALA RG LIMITED: KEY STRATEGIES
- TABLE 106. NORITAKE CO., LTD: KEY EXECUTIVES
- TABLE 107. NORITAKE CO., LTD: COMPANY SNAPSHOT
- TABLE 108. NORITAKE CO., LTD: PRODUCT SEGMENTS
- TABLE 109. NORITAKE CO., LTD: SERVICE SEGMENTS
- TABLE 110. NORITAKE CO., LTD: PRODUCT PORTFOLIO
- TABLE 111. NORITAKE CO., LTD: KEY STRATEGIES
- TABLE 112. WEDGWOOD: KEY EXECUTIVES
- TABLE 113. WEDGWOOD: COMPANY SNAPSHOT
- TABLE 114. WEDGWOOD: PRODUCT SEGMENTS
- TABLE 115. WEDGWOOD: SERVICE SEGMENTS
- TABLE 116. WEDGWOOD: PRODUCT PORTFOLIO
- TABLE 117. WEDGWOOD: KEY STRATEGIES
- TABLE 118. VILLEROY & BOCH: KEY EXECUTIVES
- TABLE 119. VILLEROY & BOCH: COMPANY SNAPSHOT
- TABLE 120. VILLEROY & BOCH: PRODUCT SEGMENTS
- TABLE 121. VILLEROY & BOCH: SERVICE SEGMENTS
- TABLE 122. VILLEROY & BOCH: PRODUCT PORTFOLIO
- TABLE 123. VILLEROY & BOCH: KEY STRATEGIES
- TABLE 124. ROSENTHAL GMBH: KEY EXECUTIVES
- TABLE 125. ROSENTHAL GMBH: COMPANY SNAPSHOT
- TABLE 126. ROSENTHAL GMBH: PRODUCT SEGMENTS
- TABLE 127. ROSENTHAL GMBH: SERVICE SEGMENTS
- TABLE 128. ROSENTHAL GMBH: PRODUCT PORTFOLIO
- TABLE 129. ROSENTHAL GMBH: KEY STRATEGIES
LIST OF FIGURES
- FIGURE 01. TABLEWARE MARKET, 2022-2032
- FIGURE 02. SEGMENTATION OF TABLEWARE MARKET,2022-2032
- FIGURE 03. TOP IMPACTING FACTORS IN TABLEWARE MARKET
- FIGURE 04. TOP INVESTMENT POCKETS IN TABLEWARE MARKET (2023-2032)
- FIGURE 05. BARGAINING POWER OF SUPPLIERS
- FIGURE 06. BARGAINING POWER OF BUYERS
- FIGURE 07. THREAT OF SUBSTITUTION
- FIGURE 08. THREAT OF SUBSTITUTION
- FIGURE 09. COMPETITIVE RIVALRY
- FIGURE 10. GLOBAL TABLEWARE MARKET:DRIVERS, RESTRAINTS AND OPPORTUNITIES
- FIGURE 11. PATENT ANALYSIS BY COMPANY
- FIGURE 12. PATENT ANALYSIS BY COUNTRY
- FIGURE 13. TABLEWARE MARKET, BY TYPE, 2022 AND 2032(%)
- FIGURE 14. COMPARATIVE SHARE ANALYSIS OF TABLEWARE MARKET FOR OPALWARE, BY COUNTRY 2022 AND 2032(%)
- FIGURE 15. COMPARATIVE SHARE ANALYSIS OF TABLEWARE MARKET FOR GLASSWARE, BY COUNTRY 2022 AND 2032(%)
- FIGURE 16. COMPARATIVE SHARE ANALYSIS OF TABLEWARE MARKET FOR MELAMINE, BY COUNTRY 2022 AND 2032(%)
- FIGURE 17. COMPARATIVE SHARE ANALYSIS OF TABLEWARE MARKET FOR BONE CHINA, BY COUNTRY 2022 AND 2032(%)
- FIGURE 18. COMPARATIVE SHARE ANALYSIS OF TABLEWARE MARKET FOR CERAMICWARE, BY COUNTRY 2022 AND 2032(%)
- FIGURE 19. COMPARATIVE SHARE ANALYSIS OF TABLEWARE MARKET FOR OTHERS, BY COUNTRY 2022 AND 2032(%)
- FIGURE 20. TABLEWARE MARKET, BY DISTRIBUTION CHANNEL, 2022 AND 2032(%)
- FIGURE 21. COMPARATIVE SHARE ANALYSIS OF TABLEWARE MARKET FOR ONLINE, BY COUNTRY 2022 AND 2032(%)
- FIGURE 22. COMPARATIVE SHARE ANALYSIS OF TABLEWARE MARKET FOR OFFLINE, BY COUNTRY 2022 AND 2032(%)
- FIGURE 23. TABLEWARE MARKET BY REGION, 2022 AND 2032(%)
- FIGURE 24. U.S. TABLEWARE MARKET, 2022-2032 ($MILLION)
- FIGURE 25. CANADA TABLEWARE MARKET, 2022-2032 ($MILLION)
- FIGURE 26. MEXICO TABLEWARE MARKET, 2022-2032 ($MILLION)
- FIGURE 27. GERMANY TABLEWARE MARKET, 2022-2032 ($MILLION)
- FIGURE 28. UK TABLEWARE MARKET, 2022-2032 ($MILLION)
- FIGURE 29. FRANCE TABLEWARE MARKET, 2022-2032 ($MILLION)
- FIGURE 30. ITALY TABLEWARE MARKET, 2022-2032 ($MILLION)
- FIGURE 31. SPAIN TABLEWARE MARKET, 2022-2032 ($MILLION)
- FIGURE 32. REST OF EUROPE TABLEWARE MARKET, 2022-2032 ($MILLION)
- FIGURE 33. CHINA TABLEWARE MARKET, 2022-2032 ($MILLION)
- FIGURE 34. JAPAN TABLEWARE MARKET, 2022-2032 ($MILLION)
- FIGURE 35. INDIA TABLEWARE MARKET, 2022-2032 ($MILLION)
- FIGURE 36. SOUTH KOREA TABLEWARE MARKET, 2022-2032 ($MILLION)
- FIGURE 37. AUSTRALIA TABLEWARE MARKET, 2022-2032 ($MILLION)
- FIGURE 38. REST OF ASIA-PACIFIC TABLEWARE MARKET, 2022-2032 ($MILLION)
- FIGURE 39. BRAZIL TABLEWARE MARKET, 2022-2032 ($MILLION)
- FIGURE 40. SAUDI ARABIA TABLEWARE MARKET, 2022-2032 ($MILLION)
- FIGURE 41. UAE TABLEWARE MARKET, 2022-2032 ($MILLION)
- FIGURE 42. SOUTH AFRICA TABLEWARE MARKET, 2022-2032 ($MILLION)
- FIGURE 43. REST OF LAMEA TABLEWARE MARKET, 2022-2032 ($MILLION)
- FIGURE 44. TOP WINNING STRATEGIES, BY YEAR
- FIGURE 45. TOP WINNING STRATEGIES, BY DEVELOPMENT
- FIGURE 46. TOP WINNING STRATEGIES, BY COMPANY
- FIGURE 47. PRODUCT MAPPING OF TOP 10 PLAYERS
- FIGURE 48. COMPETITIVE DASHBOARD
- FIGURE 49. COMPETITIVE HEATMAP: TABLEWARE MARKET
- FIGURE 50. TOP PLAYER POSITIONING, 2022
Key Benefits For Stakeholders
- This report provides a quantitative analysis of the market segments, current trends, estimations, and dynamics of the tableware market analysis from 2022 to 2032 to identify the prevailing tableware market opportunities.
- The market research is offered along with information related to key drivers, restraints, and opportunities.
- Porter's five forces analysis highlights the potency of buyers and suppliers to enable stakeholders make profit-oriented business decisions and strengthen their supplier-buyer network.
- In-depth analysis of the tableware market segmentation assists to determine the prevailing market opportunities.
- Major countries in each region are mapped according to their revenue contribution to the global market.
- Market player positioning facilitates benchmarking and provides a clear understanding of the present position of the market players.
- The report includes the analysis of the regional as well as global tableware market trends, key players, market segments, application areas, and market growth strategies.
Additional benefits you will get with this purchase are:
- Quarterly Update and* (only available with a corporate license, on listed price)
- 5 additional Company Profile of client Choice pre- or Post-purchase, as a free update.
- Free Upcoming Version on the Purchase of Five and Enterprise User License.
- 16 analyst hours of support* (post-purchase, if you find additional data requirements upon review of the report, you may receive support amounting to 16 analyst hours to solve questions, and post-sale queries)
- 15% Free Customization* (in case the scope or segment of the report does not match your requirements, 15% is equivalent to 3 working days of free work, applicable once)
- Free data Pack on the Five and Enterprise User License. (Excel version of the report)
- Free Updated report if the report is 6-12 months old or older.
- 24-hour priority response*
- Free Industry updates and white papers.Possible Customization with this report (with additional cost and timeline, please talk to the sales executive to know more)
- Consumer Buying Behavior Analysis
- Investment Opportunities
- Upcoming/New Entrant by Regions
- Technology Trend Analysis
- Consumer Preference and Product Specifications
- Market share analysis of players by products/segments
- New Product Development/ Product Matrix of Key Players
- Pain Point Analysis
- Regulatory Guidelines
- Strategic Recommendations
- Additional company profiles with specific to client's interest
- Additional country or region analysis- market size and forecast
- Criss-cross segment analysis- market size and forecast
- Expanded list for Company Profiles
- Historic market data
- Key player details (including location, contact details, supplier/vendor network etc. in excel format)
- Market share analysis of players at global/region/country level
- SWOT Analysis
Key Market Segments
By Type
- Glassware
- Melamine
- Bone China
- Ceramicware
- Others
- Opalware
By Distribution Channel
- Online
- Offline
By Region
- North America
- U.S.
- Canada
- Mexico
- Europe
- Germany
- UK
- France
- Italy
- Spain
- Rest of Europe
- Asia-Pacific
- China
- Japan
- India
- South Korea
- Australia
- Rest of Asia-Pacific
- LAMEA
- Brazil
- Saudi Arabia
- UAE
- South Africa
- Rest of LAMEA
Key Market Players:
- Lenox Corporation
- Steelite International
- PITO
- FIESTA TABLEWARE
- PORCEL S.A.
- Dudson
- La Opala RG Limited
- Noritake Co., Ltd
- Wedgwood
- Villeroy & Boch
- Rosenthal GmbH
TABLE OF CONTENTS
CHAPTER 1: INTRODUCTION
- 1.1. Report description
- 1.2. Key market segments
- 1.3. Key benefits to the stakeholders
- 1.4. Research methodology
- 1.4.1. Primary research
- 1.4.2. Secondary research
- 1.4.3. Analyst tools and models
CHAPTER 2: EXECUTIVE SUMMARY
- 2.1. CXO perspective
CHAPTER 3: MARKET OVERVIEW
- 3.1. Market definition and scope
- 3.2. Key findings
- 3.2.1. Top impacting factors
- 3.2.2. Top investment pockets
- 3.3. Porter's five forces analysis
- 3.4. Market dynamics
- 3.4.1. Drivers
- 3.4.2. Restraints
- 3.4.3. Opportunities
- 3.5. Market Share Analysis
- 3.6. Brand Share Analysis
- 3.7. Value Chain Analysis
- 3.8. Key Players Details
- 3.9. Regulatory Guidelines
- 3.10. Patent Landscape
CHAPTER 4: TABLEWARE MARKET, BY TYPE
- 4.1. Overview
- 4.1.1. Market size and forecast
- 4.2. Opalware
- 4.2.1. Key market trends, growth factors and opportunities
- 4.2.2. Market size and forecast, by region
- 4.2.3. Market share analysis by country
- 4.3. Glassware
- 4.3.1. Key market trends, growth factors and opportunities
- 4.3.2. Market size and forecast, by region
- 4.3.3. Market share analysis by country
- 4.4. Melamine
- 4.4.1. Key market trends, growth factors and opportunities
- 4.4.2. Market size and forecast, by region
- 4.4.3. Market share analysis by country
- 4.5. Bone China
- 4.5.1. Key market trends, growth factors and opportunities
- 4.5.2. Market size and forecast, by region
- 4.5.3. Market share analysis by country
- 4.6. Ceramicware
- 4.6.1. Key market trends, growth factors and opportunities
- 4.6.2. Market size and forecast, by region
- 4.6.3. Market share analysis by country
- 4.7. Others
- 4.7.1. Key market trends, growth factors and opportunities
- 4.7.2. Market size and forecast, by region
- 4.7.3. Market share analysis by country
CHAPTER 5: TABLEWARE MARKET, BY DISTRIBUTION CHANNEL
- 5.1. Overview
- 5.1.1. Market size and forecast
- 5.2. Online
- 5.2.1. Key market trends, growth factors and opportunities
- 5.2.2. Market size and forecast, by region
- 5.2.3. Market share analysis by country
- 5.3. Offline
- 5.3.1. Key market trends, growth factors and opportunities
- 5.3.2. Market size and forecast, by region
- 5.3.3. Market share analysis by country
CHAPTER 6: TABLEWARE MARKET, BY REGION
- 6.1. Overview
- 6.1.1. Market size and forecast By Region
- 6.2. North America
- 6.2.1. Key market trends, growth factors and opportunities
- 6.2.2. Market size and forecast, by Type
- 6.2.3. Market size and forecast, by Distribution Channel
- 6.2.4. Market size and forecast, by country
- 6.2.4.1. U.S.
- 6.2.4.1.1. Market size and forecast, by Type
- 6.2.4.1.2. Market size and forecast, by Distribution Channel
- 6.2.4.2. Canada
- 6.2.4.2.1. Market size and forecast, by Type
- 6.2.4.2.2. Market size and forecast, by Distribution Channel
- 6.2.4.3. Mexico
- 6.2.4.3.1. Market size and forecast, by Type
- 6.2.4.3.2. Market size and forecast, by Distribution Channel
- 6.3. Europe
- 6.3.1. Key market trends, growth factors and opportunities
- 6.3.2. Market size and forecast, by Type
- 6.3.3. Market size and forecast, by Distribution Channel
- 6.3.4. Market size and forecast, by country
- 6.3.4.1. Germany
- 6.3.4.1.1. Market size and forecast, by Type
- 6.3.4.1.2. Market size and forecast, by Distribution Channel
- 6.3.4.2. UK
- 6.3.4.2.1. Market size and forecast, by Type
- 6.3.4.2.2. Market size and forecast, by Distribution Channel
- 6.3.4.3. France
- 6.3.4.3.1. Market size and forecast, by Type
- 6.3.4.3.2. Market size and forecast, by Distribution Channel
- 6.3.4.4. Italy
- 6.3.4.4.1. Market size and forecast, by Type
- 6.3.4.4.2. Market size and forecast, by Distribution Channel
- 6.3.4.5. Spain
- 6.3.4.5.1. Market size and forecast, by Type
- 6.3.4.5.2. Market size and forecast, by Distribution Channel
- 6.3.4.6. Rest of Europe
- 6.3.4.6.1. Market size and forecast, by Type
- 6.3.4.6.2. Market size and forecast, by Distribution Channel
- 6.4. Asia-Pacific
- 6.4.1. Key market trends, growth factors and opportunities
- 6.4.2. Market size and forecast, by Type
- 6.4.3. Market size and forecast, by Distribution Channel
- 6.4.4. Market size and forecast, by country
- 6.4.4.1. China
- 6.4.4.1.1. Market size and forecast, by Type
- 6.4.4.1.2. Market size and forecast, by Distribution Channel
- 6.4.4.2. Japan
- 6.4.4.2.1. Market size and forecast, by Type
- 6.4.4.2.2. Market size and forecast, by Distribution Channel
- 6.4.4.3. India
- 6.4.4.3.1. Market size and forecast, by Type
- 6.4.4.3.2. Market size and forecast, by Distribution Channel
- 6.4.4.4. South Korea
- 6.4.4.4.1. Market size and forecast, by Type
- 6.4.4.4.2. Market size and forecast, by Distribution Channel
- 6.4.4.5. Australia
- 6.4.4.5.1. Market size and forecast, by Type
- 6.4.4.5.2. Market size and forecast, by Distribution Channel
- 6.4.4.6. Rest of Asia-Pacific
- 6.4.4.6.1. Market size and forecast, by Type
- 6.4.4.6.2. Market size and forecast, by Distribution Channel
- 6.5. LAMEA
- 6.5.1. Key market trends, growth factors and opportunities
- 6.5.2. Market size and forecast, by Type
- 6.5.3. Market size and forecast, by Distribution Channel
- 6.5.4. Market size and forecast, by country
- 6.5.4.1. Brazil
- 6.5.4.1.1. Market size and forecast, by Type
- 6.5.4.1.2. Market size and forecast, by Distribution Channel
- 6.5.4.2. Saudi Arabia
- 6.5.4.2.1. Market size and forecast, by Type
- 6.5.4.2.2. Market size and forecast, by Distribution Channel
- 6.5.4.3. UAE
- 6.5.4.3.1. Market size and forecast, by Type
- 6.5.4.3.2. Market size and forecast, by Distribution Channel
- 6.5.4.4. South Africa
- 6.5.4.4.1. Market size and forecast, by Type
- 6.5.4.4.2. Market size and forecast, by Distribution Channel
- 6.5.4.5. Rest of LAMEA
- 6.5.4.5.1. Market size and forecast, by Type
- 6.5.4.5.2. Market size and forecast, by Distribution Channel
CHAPTER 7: COMPETITIVE LANDSCAPE
- 7.1. Introduction
- 7.2. Top winning strategies
- 7.3. Product mapping of top 10 player
- 7.4. Competitive dashboard
- 7.5. Competitive heatmap
- 7.6. Top player positioning, 2022
CHAPTER 8: COMPANY PROFILES
- 8.1. Lenox Corporation
- 8.1.1. Company overview
- 8.1.2. Key executives
- 8.1.3. Company snapshot
- 8.1.4. Operating business segments
- 8.1.5. Product portfolio
- 8.1.6. Business performance
- 8.1.7. Key strategic moves and developments
- 8.2. Steelite International
- 8.2.1. Company overview
- 8.2.2. Key executives
- 8.2.3. Company snapshot
- 8.2.4. Operating business segments
- 8.2.5. Product portfolio
- 8.2.6. Business performance
- 8.2.7. Key strategic moves and developments
- 8.3. PITO
- 8.3.1. Company overview
- 8.3.2. Key executives
- 8.3.3. Company snapshot
- 8.3.4. Operating business segments
- 8.3.5. Product portfolio
- 8.3.6. Business performance
- 8.3.7. Key strategic moves and developments
- 8.4. FIESTA TABLEWARE
- 8.4.1. Company overview
- 8.4.2. Key executives
- 8.4.3. Company snapshot
- 8.4.4. Operating business segments
- 8.4.5. Product portfolio
- 8.4.6. Business performance
- 8.4.7. Key strategic moves and developments
- 8.5. PORCEL S.A.
- 8.5.1. Company overview
- 8.5.2. Key executives
- 8.5.3. Company snapshot
- 8.5.4. Operating business segments
- 8.5.5. Product portfolio
- 8.5.6. Business performance
- 8.5.7. Key strategic moves and developments
- 8.6. Dudson
- 8.6.1. Company overview
- 8.6.2. Key executives
- 8.6.3. Company snapshot
- 8.6.4. Operating business segments
- 8.6.5. Product portfolio
- 8.6.6. Business performance
- 8.6.7. Key strategic moves and developments
- 8.7. La Opala RG Limited
- 8.7.1. Company overview
- 8.7.2. Key executives
- 8.7.3. Company snapshot
- 8.7.4. Operating business segments
- 8.7.5. Product portfolio
- 8.7.6. Business performance
- 8.7.7. Key strategic moves and developments
- 8.8. Noritake Co., Ltd
- 8.8.1. Company overview
- 8.8.2. Key executives
- 8.8.3. Company snapshot
- 8.8.4. Operating business segments
- 8.8.5. Product portfolio
- 8.8.6. Business performance
- 8.8.7. Key strategic moves and developments
- 8.9. Wedgwood
- 8.9.1. Company overview
- 8.9.2. Key executives
- 8.9.3. Company snapshot
- 8.9.4. Operating business segments
- 8.9.5. Product portfolio
- 8.9.6. Business performance
- 8.9.7. Key strategic moves and developments
- 8.10. Villeroy & Boch
- 8.10.1. Company overview
- 8.10.2. Key executives
- 8.10.3. Company snapshot
- 8.10.4. Operating business segments
- 8.10.5. Product portfolio
- 8.10.6. Business performance
- 8.10.7. Key strategic moves and developments
- 8.11. Rosenthal GmbH
- 8.11.1. Company overview
- 8.11.2. Key executives
- 8.11.3. Company snapshot
- 8.11.4. Operating business segments
- 8.11.5. Product portfolio
- 8.11.6. Business performance
- 8.11.7. Key strategic moves and developments
