|
|
市場調査レポート
商品コード
1472368
SIMカードの世界市場:タイプ別、業界別:機会分析と産業予測(2023年~2032年)SIM Card Market By Type (Full Size SIM, Mini-SIM, Micro-SIM, Nano-SIM, Embedded-SIM, Software SIM ), By Industry Vertical: Global Opportunity Analysis and Industry Forecast, 2023-2032 |
||||||
|
|
|||||||
|
|||||||


| SIMカードの世界市場:タイプ別、業界別:機会分析と産業予測(2023年~2032年) |
|
出版日: 2024年03月01日
発行: Allied Market Research
ページ情報: 英文 250 Pages
納期: 2~3営業日
|

- 全表示
- 概要
- 図表
- 目次
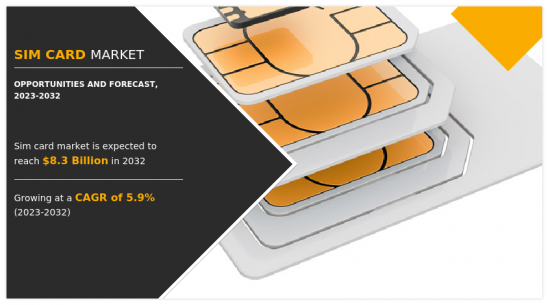
世界のSIMカードの市場規模は、2022年に47億米ドルに達し、2023年~2032年にCAGR5.9%で成長し、2032年には83億米ドルに達すると予測されています。
SIM(Subscriber Identity Module)カードは、モバイル機器の識別情報を格納する回路内蔵チップを搭載したプラスチック片です。この情報は、モバイル・サービス・プロバイダーがデバイスと個々の顧客アカウントを関連付けるのに役立ちます。
IoTとM2M技術の出現は、SIMカード市場の大きな原動力となっています。ヘルスケア、運輸、農業などさまざまな業界でIoTデバイスが普及するにつれ、接続に不可欠なコンポーネントとしてのSIMカードの需要は飛躍的に伸びています。SIMカードは、IoTデバイスとネットワーク間のセキュアな通信を可能にし、データ交換やリモート管理機能を促進する上で極めて重要な役割を果たしています。さらに、M2M(Machine-to-Machine)通信が、特に資産追跡や産業オートメーションなどの業界でますます普及するにつれて、SIMカードのニーズは高まり続けています。しかし、生分解性ではないSIMカードの廃棄は電子廃棄物(e-waste)の蓄積につながるため、環境への懸念がSIMカード市場の抑制要因となっています。これは持続可能性の課題を提起し、環境に優しいソリューションの必要性を促します。一方、eSIM技術の進歩はSIMカード市場にとって大きなチャンスです。eSIM(組み込みSIM)は、物理的なSIMカードを必要とせずに、SIMプロファイルのリモートプロビジョニングと管理を可能にします。この技術は、デバイスのアクティベーションを簡素化し、複数のネットワークにまたがるシームレスな接続を容易にするため、ユーザーに高い柔軟性と利便性を提供します。さらにeSIMは、従来のSIMカードスロットを必要としないため、メーカーがより小型のフォームファクタと耐久性を向上させたデバイスを設計することを可能にします。その結果、eSIMの採用は家電、自動車、IoTを含む様々な分野で牽引力を増しており、eSIM対応デバイスの需要を促進し、SIMカード市場の成長を後押ししています。
SIMカード市場は、タイプ、業界別、地域別に区分されます。タイプ別では、フルサイズSIM(1FF)、ミニSIM(2FF)、マイクロSIM(3FF)、ナノSIM(4FF)、組み込みSIM(e-SIM)、ソフトウェアSIM(SoftSIM)に分けられます。業界別では、自動車、家電、製造、通信、運輸・物流、その他に分類されます。
地域別では、北米(米国、カナダ、メキシコ)、欧州(英国、ドイツ、フランス、イタリア、スペイン、その他欧州)、アジア太平洋(中国、日本、インド、韓国、オーストラリア、その他アジア太平洋)、ラテンアメリカ(ブラジル、アルゼンチン、その他ラテンアメリカ)、中東・アフリカ(アラブ首長国連邦、サウジアラビア、カタール、南アフリカ、その他中東・アフリカ)で分析されます。
利害関係者にとっての主なメリット
- 当レポートでは、2022年~2032年のSIMカード市場分析の市場セグメント、現在の動向、推定・動向分析、力学を定量的に分析し、一般的なSIMカード市場機会を特定します。
- 市場調査は、主要な促進要因、抑制要因、および機会に関連する情報とともに提供されます。
- ポーターのファイブフォース分析は、利害関係者が利益指向のビジネス上の意思決定を行い、サプライヤーとバイヤーのネットワークを強化できるようにバイヤーとサプライヤーの効力を強調します。
- SIMカードの市場セグメンテーションの詳細な分析は、一般的な市場機会を決定するのに役立ちます。
- 各地域の主要国は、世界市場への収益貢献度に応じてマッピングされています。
- 市場企業のポジショニングは、ベンチマークを容易にし、市場企業の現在の位置の明確な理解を提供します。
- 本レポートには、地域および世界のSIMカード市場動向、主要企業、市場セグメント、応用分野、市場成長戦略の分析が含まれています。
本レポートで可能なレポートカスタマイズ(追加費用とタイムラインに関しましては販売担当へご連絡ください)
- 製品ライフサイクル
- 製品/セグメント別の企業の市場シェア分析
- 顧客の関心に応じた企業プロファイルの追加
- 国別または地域別の追加分析:市場規模と予測
- 主要企業の詳細(所在地、連絡先、サプライヤー/ベンダーネットワークなどを含む、エクセル形式)
- 世界/地域/国別レベルでの企業の市場シェア分析
目次
第1章 イントロダクション
第2章 エグゼクティブサマリー
第3章 市場概要
- 市場の定義と範囲
- 主な調査結果
- 影響要因
- 主な投資機会
- ポーターのファイブフォース分析
- 市場力学
- 促進要因
- 抑制要因
- 機会
第4章 SIMカード市場:タイプ別
- 概要
- フルサイズSIM(1FF)
- ミニSIM(2FF)
- マイクロSIM(3FF)
- ナノSIM(4FF)
- 組み込みSIM(e-SIM)
- ソフトウェアSIM(SoftSIM)
第5章 SIMカード市場:業界別
- 概要
- 自動車
- 家電
- 製造
- 通信
- 運輸・物流
- その他
第6章 SIMカード市場:地域別
- 概要
- 北米
- 米国
- カナダ
- メキシコ
- 欧州
- 英国
- ドイツ
- フランス
- イタリア
- その他
- アジア太平洋
- 中国
- インド
- 日本
- 韓国
- オーストラリア
- その他
- ラテンアメリカ
- ブラジル
- アルゼンチン
- その他ラテンアメリカ
- 中東・アフリカ
- アラブ首長国連邦
- サウジアラビア
- カタール
- その他中東・アフリカ
第7章 競合情勢
- イントロダクション
- 主要成功戦略
- 主要10社の製品マッピング
- 競合ダッシュボード
- 競合ヒートマップ
- 主要企業のポジショニング(2022年)
第8章 企業プロファイル
- Thales
- Giesecke & Devrient GmbH.
- IDEMIA
- Watchdata Systems Co.
- VALID
- XH Smart tech
- DZ Cards
- HkCard Electronics co. ltd
- Hengbao
- Datang Telecom Technology
LIST OF TABLES
- TABLE 01. GLOBAL SIM CARD MARKET, BY TYPE, 2022-2032 ($MILLION)
- TABLE 02. SIM CARD MARKET FOR FULL SIZE SIM (1FF), BY REGION, 2022-2032 ($MILLION)
- TABLE 03. SIM CARD MARKET FOR MINI-SIM (2FF), BY REGION, 2022-2032 ($MILLION)
- TABLE 04. SIM CARD MARKET FOR MICRO-SIM (3FF), BY REGION, 2022-2032 ($MILLION)
- TABLE 05. SIM CARD MARKET FOR NANO-SIM (4FF), BY REGION, 2022-2032 ($MILLION)
- TABLE 06. SIM CARD MARKET FOR EMBEDDED-SIM (E-SIM), BY REGION, 2022-2032 ($MILLION)
- TABLE 07. SIM CARD MARKET FOR SOFTWARE SIM (SOFTSIM), BY REGION, 2022-2032 ($MILLION)
- TABLE 08. GLOBAL SIM CARD MARKET, BY INDUSTRY VERTICAL, 2022-2032 ($MILLION)
- TABLE 09. SIM CARD MARKET FOR AUTOMOTIVE, BY REGION, 2022-2032 ($MILLION)
- TABLE 10. SIM CARD MARKET FOR CONSUMER ELECTRONICS, BY REGION, 2022-2032 ($MILLION)
- TABLE 11. SIM CARD MARKET FOR MANUFACTURING, BY REGION, 2022-2032 ($MILLION)
- TABLE 12. SIM CARD MARKET FOR TELECOMMUNICATION, BY REGION, 2022-2032 ($MILLION)
- TABLE 13. SIM CARD MARKET FOR TRANSPORTATION AND LOGISTICS, BY REGION, 2022-2032 ($MILLION)
- TABLE 14. SIM CARD MARKET FOR OTHERS, BY REGION, 2022-2032 ($MILLION)
- TABLE 15. SIM CARD MARKET, BY REGION, 2022-2032 ($MILLION)
- TABLE 16. NORTH AMERICA SIM CARD MARKET, BY TYPE, 2022-2032 ($MILLION)
- TABLE 17. NORTH AMERICA SIM CARD MARKET, BY INDUSTRY VERTICAL, 2022-2032 ($MILLION)
- TABLE 18. NORTH AMERICA SIM CARD MARKET, BY COUNTRY, 2022-2032 ($MILLION)
- TABLE 19. U.S. SIM CARD MARKET, BY TYPE, 2022-2032 ($MILLION)
- TABLE 20. U.S. SIM CARD MARKET, BY INDUSTRY VERTICAL, 2022-2032 ($MILLION)
- TABLE 21. CANADA SIM CARD MARKET, BY TYPE, 2022-2032 ($MILLION)
- TABLE 22. CANADA SIM CARD MARKET, BY INDUSTRY VERTICAL, 2022-2032 ($MILLION)
- TABLE 23. MEXICO SIM CARD MARKET, BY TYPE, 2022-2032 ($MILLION)
- TABLE 24. MEXICO SIM CARD MARKET, BY INDUSTRY VERTICAL, 2022-2032 ($MILLION)
- TABLE 25. EUROPE SIM CARD MARKET, BY TYPE, 2022-2032 ($MILLION)
- TABLE 26. EUROPE SIM CARD MARKET, BY INDUSTRY VERTICAL, 2022-2032 ($MILLION)
- TABLE 27. EUROPE SIM CARD MARKET, BY COUNTRY, 2022-2032 ($MILLION)
- TABLE 28. UK SIM CARD MARKET, BY TYPE, 2022-2032 ($MILLION)
- TABLE 29. UK SIM CARD MARKET, BY INDUSTRY VERTICAL, 2022-2032 ($MILLION)
- TABLE 30. GERMANY SIM CARD MARKET, BY TYPE, 2022-2032 ($MILLION)
- TABLE 31. GERMANY SIM CARD MARKET, BY INDUSTRY VERTICAL, 2022-2032 ($MILLION)
- TABLE 32. FRANCE SIM CARD MARKET, BY TYPE, 2022-2032 ($MILLION)
- TABLE 33. FRANCE SIM CARD MARKET, BY INDUSTRY VERTICAL, 2022-2032 ($MILLION)
- TABLE 34. ITALY SIM CARD MARKET, BY TYPE, 2022-2032 ($MILLION)
- TABLE 35. ITALY SIM CARD MARKET, BY INDUSTRY VERTICAL, 2022-2032 ($MILLION)
- TABLE 36. REST OF EUROPE SIM CARD MARKET, BY TYPE, 2022-2032 ($MILLION)
- TABLE 37. REST OF EUROPE SIM CARD MARKET, BY INDUSTRY VERTICAL, 2022-2032 ($MILLION)
- TABLE 38. ASIA-PACIFIC SIM CARD MARKET, BY TYPE, 2022-2032 ($MILLION)
- TABLE 39. ASIA-PACIFIC SIM CARD MARKET, BY INDUSTRY VERTICAL, 2022-2032 ($MILLION)
- TABLE 40. ASIA-PACIFIC SIM CARD MARKET, BY COUNTRY, 2022-2032 ($MILLION)
- TABLE 41. CHINA SIM CARD MARKET, BY TYPE, 2022-2032 ($MILLION)
- TABLE 42. CHINA SIM CARD MARKET, BY INDUSTRY VERTICAL, 2022-2032 ($MILLION)
- TABLE 43. INDIA SIM CARD MARKET, BY TYPE, 2022-2032 ($MILLION)
- TABLE 44. INDIA SIM CARD MARKET, BY INDUSTRY VERTICAL, 2022-2032 ($MILLION)
- TABLE 45. JAPAN SIM CARD MARKET, BY TYPE, 2022-2032 ($MILLION)
- TABLE 46. JAPAN SIM CARD MARKET, BY INDUSTRY VERTICAL, 2022-2032 ($MILLION)
- TABLE 47. SOUTH KOREA SIM CARD MARKET, BY TYPE, 2022-2032 ($MILLION)
- TABLE 48. SOUTH KOREA SIM CARD MARKET, BY INDUSTRY VERTICAL, 2022-2032 ($MILLION)
- TABLE 49. AUSTRALIA SIM CARD MARKET, BY TYPE, 2022-2032 ($MILLION)
- TABLE 50. AUSTRALIA SIM CARD MARKET, BY INDUSTRY VERTICAL, 2022-2032 ($MILLION)
- TABLE 51. REST OF ASIA-PACIFIC SIM CARD MARKET, BY TYPE, 2022-2032 ($MILLION)
- TABLE 52. REST OF ASIA-PACIFIC SIM CARD MARKET, BY INDUSTRY VERTICAL, 2022-2032 ($MILLION)
- TABLE 53. LATIN AMERICA SIM CARD MARKET, BY TYPE, 2022-2032 ($MILLION)
- TABLE 54. LATIN AMERICA SIM CARD MARKET, BY INDUSTRY VERTICAL, 2022-2032 ($MILLION)
- TABLE 55. LATIN AMERICA SIM CARD MARKET, BY COUNTRY, 2022-2032 ($MILLION)
- TABLE 56. BRAZIL SIM CARD MARKET, BY TYPE, 2022-2032 ($MILLION)
- TABLE 57. BRAZIL SIM CARD MARKET, BY INDUSTRY VERTICAL, 2022-2032 ($MILLION)
- TABLE 58. ARGENTINA SIM CARD MARKET, BY TYPE, 2022-2032 ($MILLION)
- TABLE 59. ARGENTINA SIM CARD MARKET, BY INDUSTRY VERTICAL, 2022-2032 ($MILLION)
- TABLE 60. REST OF LATIN AMERICA SIM CARD MARKET, BY TYPE, 2022-2032 ($MILLION)
- TABLE 61. REST OF LATIN AMERICA SIM CARD MARKET, BY INDUSTRY VERTICAL, 2022-2032 ($MILLION)
- TABLE 62. MIDDLE EAST AND AFRICA SIM CARD MARKET, BY TYPE, 2022-2032 ($MILLION)
- TABLE 63. MIDDLE EAST AND AFRICA SIM CARD MARKET, BY INDUSTRY VERTICAL, 2022-2032 ($MILLION)
- TABLE 64. MIDDLE EAST AND AFRICA SIM CARD MARKET, BY COUNTRY, 2022-2032 ($MILLION)
- TABLE 65. UAE SIM CARD MARKET, BY TYPE, 2022-2032 ($MILLION)
- TABLE 66. UAE SIM CARD MARKET, BY INDUSTRY VERTICAL, 2022-2032 ($MILLION)
- TABLE 67. SAUDI ARABIA SIM CARD MARKET, BY TYPE, 2022-2032 ($MILLION)
- TABLE 68. SAUDI ARABIA SIM CARD MARKET, BY INDUSTRY VERTICAL, 2022-2032 ($MILLION)
- TABLE 69. QATAR SIM CARD MARKET, BY TYPE, 2022-2032 ($MILLION)
- TABLE 70. QATAR SIM CARD MARKET, BY INDUSTRY VERTICAL, 2022-2032 ($MILLION)
- TABLE 71. REST OF MIDDLE EAST AND AFRICA SIM CARD MARKET, BY TYPE, 2022-2032 ($MILLION)
- TABLE 72. REST OF MIDDLE EAST AND AFRICA SIM CARD MARKET, BY INDUSTRY VERTICAL, 2022-2032 ($MILLION)
- TABLE 73. THALES: KEY EXECUTIVES
- TABLE 74. THALES: COMPANY SNAPSHOT
- TABLE 75. THALES: PRODUCT SEGMENTS
- TABLE 76. THALES: SERVICE SEGMENTS
- TABLE 77. THALES: PRODUCT PORTFOLIO
- TABLE 78. THALES: KEY STRATERGIES
- TABLE 79. GIESECKE & DEVRIENT GMBH.: KEY EXECUTIVES
- TABLE 80. GIESECKE & DEVRIENT GMBH.: COMPANY SNAPSHOT
- TABLE 81. GIESECKE & DEVRIENT GMBH.: PRODUCT SEGMENTS
- TABLE 82. GIESECKE & DEVRIENT GMBH.: SERVICE SEGMENTS
- TABLE 83. GIESECKE & DEVRIENT GMBH.: PRODUCT PORTFOLIO
- TABLE 84. GIESECKE & DEVRIENT GMBH.: KEY STRATERGIES
- TABLE 85. IDEMIA: KEY EXECUTIVES
- TABLE 86. IDEMIA: COMPANY SNAPSHOT
- TABLE 87. IDEMIA: PRODUCT SEGMENTS
- TABLE 88. IDEMIA: SERVICE SEGMENTS
- TABLE 89. IDEMIA: PRODUCT PORTFOLIO
- TABLE 90. IDEMIA: KEY STRATERGIES
- TABLE 91. WATCHDATA SYSTEMS CO.: KEY EXECUTIVES
- TABLE 92. WATCHDATA SYSTEMS CO.: COMPANY SNAPSHOT
- TABLE 93. WATCHDATA SYSTEMS CO.: PRODUCT SEGMENTS
- TABLE 94. WATCHDATA SYSTEMS CO.: SERVICE SEGMENTS
- TABLE 95. WATCHDATA SYSTEMS CO.: PRODUCT PORTFOLIO
- TABLE 96. WATCHDATA SYSTEMS CO.: KEY STRATERGIES
- TABLE 97. VALID: KEY EXECUTIVES
- TABLE 98. VALID: COMPANY SNAPSHOT
- TABLE 99. VALID: PRODUCT SEGMENTS
- TABLE 100. VALID: SERVICE SEGMENTS
- TABLE 101. VALID: PRODUCT PORTFOLIO
- TABLE 102. VALID: KEY STRATERGIES
- TABLE 103. XH SMART TECH: KEY EXECUTIVES
- TABLE 104. XH SMART TECH: COMPANY SNAPSHOT
- TABLE 105. XH SMART TECH: PRODUCT SEGMENTS
- TABLE 106. XH SMART TECH: SERVICE SEGMENTS
- TABLE 107. XH SMART TECH: PRODUCT PORTFOLIO
- TABLE 108. XH SMART TECH: KEY STRATERGIES
- TABLE 109. DZ CARDS: KEY EXECUTIVES
- TABLE 110. DZ CARDS: COMPANY SNAPSHOT
- TABLE 111. DZ CARDS: PRODUCT SEGMENTS
- TABLE 112. DZ CARDS: SERVICE SEGMENTS
- TABLE 113. DZ CARDS: PRODUCT PORTFOLIO
- TABLE 114. DZ CARDS: KEY STRATERGIES
- TABLE 115. HKCARD ELECTRONICS CO. LTD: KEY EXECUTIVES
- TABLE 116. HKCARD ELECTRONICS CO. LTD: COMPANY SNAPSHOT
- TABLE 117. HKCARD ELECTRONICS CO. LTD: PRODUCT SEGMENTS
- TABLE 118. HKCARD ELECTRONICS CO. LTD: SERVICE SEGMENTS
- TABLE 119. HKCARD ELECTRONICS CO. LTD: PRODUCT PORTFOLIO
- TABLE 120. HKCARD ELECTRONICS CO. LTD: KEY STRATERGIES
- TABLE 121. HENGBAO: KEY EXECUTIVES
- TABLE 122. HENGBAO: COMPANY SNAPSHOT
- TABLE 123. HENGBAO: PRODUCT SEGMENTS
- TABLE 124. HENGBAO: SERVICE SEGMENTS
- TABLE 125. HENGBAO: PRODUCT PORTFOLIO
- TABLE 126. HENGBAO: KEY STRATERGIES
- TABLE 127. DATANG TELECOM TECHNOLOGY: KEY EXECUTIVES
- TABLE 128. DATANG TELECOM TECHNOLOGY: COMPANY SNAPSHOT
- TABLE 129. DATANG TELECOM TECHNOLOGY: PRODUCT SEGMENTS
- TABLE 130. DATANG TELECOM TECHNOLOGY: SERVICE SEGMENTS
- TABLE 131. DATANG TELECOM TECHNOLOGY: PRODUCT PORTFOLIO
- TABLE 132. DATANG TELECOM TECHNOLOGY: KEY STRATERGIES
LIST OF FIGURES
- FIGURE 01. SIM CARD MARKET, 2022-2032
- FIGURE 02. SEGMENTATION OF SIM CARD MARKET,2022-2032
- FIGURE 03. TOP IMPACTING FACTORS IN SIM CARD MARKET
- FIGURE 04. TOP INVESTMENT POCKETS IN SIM CARD MARKET (2023-2032)
- FIGURE 05. BARGAINING POWER OF SUPPLIERS
- FIGURE 06. BARGAINING POWER OF BUYERS
- FIGURE 07. THREAT OF SUBSTITUTION
- FIGURE 08. THREAT OF SUBSTITUTION
- FIGURE 09. COMPETITIVE RIVALRY
- FIGURE 10. GLOBAL SIM CARD MARKET:DRIVERS, RESTRAINTS AND OPPORTUNITIES
- FIGURE 11. SIM CARD MARKET, BY TYPE, 2022 AND 2032(%)
- FIGURE 12. COMPARATIVE SHARE ANALYSIS OF SIM CARD MARKET FOR FULL SIZE SIM (1FF), BY COUNTRY 2022 AND 2032(%)
- FIGURE 13. COMPARATIVE SHARE ANALYSIS OF SIM CARD MARKET FOR MINI-SIM (2FF), BY COUNTRY 2022 AND 2032(%)
- FIGURE 14. COMPARATIVE SHARE ANALYSIS OF SIM CARD MARKET FOR MICRO-SIM (3FF), BY COUNTRY 2022 AND 2032(%)
- FIGURE 15. COMPARATIVE SHARE ANALYSIS OF SIM CARD MARKET FOR NANO-SIM (4FF), BY COUNTRY 2022 AND 2032(%)
- FIGURE 16. COMPARATIVE SHARE ANALYSIS OF SIM CARD MARKET FOR EMBEDDED-SIM (E-SIM), BY COUNTRY 2022 AND 2032(%)
- FIGURE 17. COMPARATIVE SHARE ANALYSIS OF SIM CARD MARKET FOR SOFTWARE SIM (SOFTSIM), BY COUNTRY 2022 AND 2032(%)
- FIGURE 18. SIM CARD MARKET, BY INDUSTRY VERTICAL, 2022 AND 2032(%)
- FIGURE 19. COMPARATIVE SHARE ANALYSIS OF SIM CARD MARKET FOR AUTOMOTIVE, BY COUNTRY 2022 AND 2032(%)
- FIGURE 20. COMPARATIVE SHARE ANALYSIS OF SIM CARD MARKET FOR CONSUMER ELECTRONICS, BY COUNTRY 2022 AND 2032(%)
- FIGURE 21. COMPARATIVE SHARE ANALYSIS OF SIM CARD MARKET FOR MANUFACTURING, BY COUNTRY 2022 AND 2032(%)
- FIGURE 22. COMPARATIVE SHARE ANALYSIS OF SIM CARD MARKET FOR TELECOMMUNICATION, BY COUNTRY 2022 AND 2032(%)
- FIGURE 23. COMPARATIVE SHARE ANALYSIS OF SIM CARD MARKET FOR TRANSPORTATION AND LOGISTICS, BY COUNTRY 2022 AND 2032(%)
- FIGURE 24. COMPARATIVE SHARE ANALYSIS OF SIM CARD MARKET FOR OTHERS, BY COUNTRY 2022 AND 2032(%)
- FIGURE 25. SIM CARD MARKET BY REGION, 2022 AND 2032(%)
- FIGURE 26. U.S. SIM CARD MARKET, 2022-2032 ($MILLION)
- FIGURE 27. CANADA SIM CARD MARKET, 2022-2032 ($MILLION)
- FIGURE 28. MEXICO SIM CARD MARKET, 2022-2032 ($MILLION)
- FIGURE 29. UK SIM CARD MARKET, 2022-2032 ($MILLION)
- FIGURE 30. GERMANY SIM CARD MARKET, 2022-2032 ($MILLION)
- FIGURE 31. FRANCE SIM CARD MARKET, 2022-2032 ($MILLION)
- FIGURE 32. ITALY SIM CARD MARKET, 2022-2032 ($MILLION)
- FIGURE 33. REST OF EUROPE SIM CARD MARKET, 2022-2032 ($MILLION)
- FIGURE 34. CHINA SIM CARD MARKET, 2022-2032 ($MILLION)
- FIGURE 35. INDIA SIM CARD MARKET, 2022-2032 ($MILLION)
- FIGURE 36. JAPAN SIM CARD MARKET, 2022-2032 ($MILLION)
- FIGURE 37. SOUTH KOREA SIM CARD MARKET, 2022-2032 ($MILLION)
- FIGURE 38. AUSTRALIA SIM CARD MARKET, 2022-2032 ($MILLION)
- FIGURE 39. REST OF ASIA-PACIFIC SIM CARD MARKET, 2022-2032 ($MILLION)
- FIGURE 40. BRAZIL SIM CARD MARKET, 2022-2032 ($MILLION)
- FIGURE 41. ARGENTINA SIM CARD MARKET, 2022-2032 ($MILLION)
- FIGURE 42. REST OF LATIN AMERICA SIM CARD MARKET, 2022-2032 ($MILLION)
- FIGURE 43. UAE SIM CARD MARKET, 2022-2032 ($MILLION)
- FIGURE 44. SAUDI ARABIA SIM CARD MARKET, 2022-2032 ($MILLION)
- FIGURE 45. QATAR SIM CARD MARKET, 2022-2032 ($MILLION)
- FIGURE 46. REST OF MIDDLE EAST AND AFRICA SIM CARD MARKET, 2022-2032 ($MILLION)
- FIGURE 47. TOP WINNING STRATEGIES, BY YEAR
- FIGURE 48. TOP WINNING STRATEGIES, BY DEVELOPMENT
- FIGURE 49. TOP WINNING STRATEGIES, BY COMPANY
- FIGURE 50. PRODUCT MAPPING OF TOP 10 PLAYERS
- FIGURE 51. COMPETITIVE DASHBOARD
- FIGURE 52. COMPETITIVE HEATMAP: SIM CARD MARKET
- FIGURE 53. TOP PLAYER POSITIONING, 2022
The SIM card market was valued at $4.7 billion in 2022 and is estimated to reach $8.3 billion by 2032, exhibiting a CAGR of 5.9% from 2023 to 2032.
A SIM (Subscriber Identity Module) card is a plastic piece with a circuit-embedded chip that stores identifying information on a mobile device. This information helps mobile service providers associate devices with individual customer accounts.
The emergence of IoT and M2M technologies represents a significant driving force for the SIM card market. With the proliferation of IoT devices across various industries such as healthcare, transportation, and agriculture, the demand for SIM cards as essential components for connectivity grows exponentially. SIM cards play a pivotal role in enabling secure communication between IoT devices and networks, facilitating data exchange and remote management functionalities. Moreover, as Machine-to-Machine (M2M) communication becomes increasingly prevalent, particularly in industry verticals like asset tracking and industrial automation, the need for SIM cards continue to rise. However, environmental concerns pose a restraint for the SIM card market as the disposal of non-biodegradable SIM cards contributes to electronic waste (e-waste) accumulation. This raises sustainability challenges and prompts calls for eco-friendly solutions, potentially increasing production costs and complexity for manufacturer, which hinder market growth. On the other hand, advancements in eSIM technology represent a significant opportunity for the SIM card market. eSIM, or embedded SIM, allows for the remote provisioning and management of SIM profiles without the need for physical SIM cards. This technology simplifies device activation and facilitates seamless connectivity across multiple networks, offering users greater flexibility and convenience. Moreover, eSIM enables manufacturers to design devices with smaller form factors and increased durability, as there is no need for a traditional SIM card slot. As a result, eSIM adoption is gaining traction in various sectors, including consumer electronics, automotive, and IoT, driving demand for eSIM-compatible devices and boosting the growth in the SIM card market.
The SIM card market is segmented on the basis of type, industry vertical, and region. On the basis of type, the market is divided into Full Size SIM (1FF), Mini-SIM (2FF), Micro-SIM (3FF), Nano-SIM (4FF), Embedded-SIM (e-SIM), and Software SIM (SoftSIM). On the basis of industry vertical, the market is classified into automotive, consumer electronics, manufacturing, telecommunication, transportation & logistics, and others.
Region wise, it is analyzed across North America (the U.S., Canada, and Mexico), Europe (the UK, Germany, France, Italy, Spain, and the rest of Europe), Asia-Pacific (China, Japan, India, South Korea, Australia, and rest of Asia-Pacific), Latin America (Brazil, Argentina, and rest of Latin America), and Middle East and Africa (UAE, Saudi Arabia, Qatar, South Africa, and rest of Middle East & Africa).
The key players profiled in the report include Thales, Giesecke & Devrient GmbH., IDEMIA, Watchdata Systems Co., VALID, XH Smart tech, DZ Cards, HkCard Electronics co. Ltd, Hengbao, and Datang Telecom Technology. These key players have adopted strategies such as product portfolio expansion, mergers & acquisitions, agreements, geographical expansion, and collaborations to enhance their market penetration.
Key Benefits For Stakeholders
- This report provides a quantitative analysis of the market segments, current trends, estimations, and dynamics of the sim card market analysis from 2022 to 2032 to identify the prevailing sim card market opportunities.
- The market research is offered along with information related to key drivers, restraints, and opportunities.
- Porter's five forces analysis highlights the potency of buyers and suppliers to enable stakeholders make profit-oriented business decisions and strengthen their supplier-buyer network.
- In-depth analysis of the sim card market segmentation assists to determine the prevailing market opportunities.
- Major countries in each region are mapped according to their revenue contribution to the global market.
- Market player positioning facilitates benchmarking and provides a clear understanding of the present position of the market players.
- The report includes the analysis of the regional as well as global sim card market trends, key players, market segments, application areas, and market growth strategies.
Additional benefits you will get with this purchase are:
- Quarterly Update and* (only available with a corporate license, on listed price)
- 5 additional Company Profile of client Choice pre- or Post-purchase, as a free update.
- Free Upcoming Version on the Purchase of Five and Enterprise User License.
- 16 analyst hours of support* (post-purchase, if you find additional data requirements upon review of the report, you may receive support amounting to 16 analyst hours to solve questions, and post-sale queries)
- 15% Free Customization* (in case the scope or segment of the report does not match your requirements, 15% is equivalent to 3 working days of free work, applicable once)
- Free data Pack on the Five and Enterprise User License. (Excel version of the report)
- Free Updated report if the report is 6-12 months old or older.
- 24-hour priority response*
- Free Industry updates and white papers.
Possible Customization with this report (with additional cost and timeline, please talk to the sales executive to know more)
- Product Life Cycles
- Market share analysis of players by products/segments
- Additional company profiles with specific to client's interest
- Additional country or region analysis- market size and forecast
- Key player details (including location, contact details, supplier/vendor network etc. in excel format)
- Market share analysis of players at global/region/country level
Key Market Segments
By Type
- Embedded-SIM (e-SIM)
- Software SIM (SoftSIM)
- Full Size SIM (1FF)
- Mini-SIM (2FF)
- Micro-SIM (3FF)
- Nano-SIM (4FF)
By Industry Vertical
- Automotive
- Consumer Electronics
- Manufacturing
- Telecommunication
- Transportation and Logistics
- Others
By Region
- North America
- U.S.
- Canada
- Mexico
- Europe
- UK
- Germany
- France
- Italy
- Rest of Europe
- Asia-Pacific
- China
- India
- Japan
- South Korea
- Australia
- Rest of Asia-Pacific
- Latin America
- Brazil
- Argentina
- Rest of Latin America
- Middle East and Africa
- UAE
- Saudi Arabia
- Qatar
- Rest of Middle East And Africa
Key Market Players:
- Thales
- Giesecke & Devrient GmbH.
- IDEMIA
- Watchdata Systems Co.
- VALID
- XH Smart tech
- DZ Cards
- HkCard Electronics co. ltd
- Hengbao
- Datang Telecom Technology
TABLE OF CONTENTS
CHAPTER 1: INTRODUCTION
- 1.1. Report description
- 1.2. Key market segments
- 1.3. Key benefits to the stakeholders
- 1.4. Research methodology
- 1.4.1. Primary research
- 1.4.2. Secondary research
- 1.4.3. Analyst tools and models
CHAPTER 2: EXECUTIVE SUMMARY
- 2.1. CXO perspective
CHAPTER 3: MARKET OVERVIEW
- 3.1. Market definition and scope
- 3.2. Key findings
- 3.2.1. Top impacting factors
- 3.2.2. Top investment pockets
- 3.3. Porter's five forces analysis
- 3.4. Market dynamics
- 3.4.1. Drivers
- 3.4.2. Restraints
- 3.4.3. Opportunities
CHAPTER 4: SIM CARD MARKET, BY TYPE
- 4.1. Overview
- 4.1.1. Market size and forecast
- 4.2. Full Size SIM (1FF)
- 4.2.1. Key market trends, growth factors and opportunities
- 4.2.2. Market size and forecast, by region
- 4.2.3. Market share analysis by country
- 4.3. Mini-SIM (2FF)
- 4.3.1. Key market trends, growth factors and opportunities
- 4.3.2. Market size and forecast, by region
- 4.3.3. Market share analysis by country
- 4.4. Micro-SIM (3FF)
- 4.4.1. Key market trends, growth factors and opportunities
- 4.4.2. Market size and forecast, by region
- 4.4.3. Market share analysis by country
- 4.5. Nano-SIM (4FF)
- 4.5.1. Key market trends, growth factors and opportunities
- 4.5.2. Market size and forecast, by region
- 4.5.3. Market share analysis by country
- 4.6. Embedded-SIM (e-SIM)
- 4.6.1. Key market trends, growth factors and opportunities
- 4.6.2. Market size and forecast, by region
- 4.6.3. Market share analysis by country
- 4.7. Software SIM (SoftSIM)
- 4.7.1. Key market trends, growth factors and opportunities
- 4.7.2. Market size and forecast, by region
- 4.7.3. Market share analysis by country
CHAPTER 5: SIM CARD MARKET, BY INDUSTRY VERTICAL
- 5.1. Overview
- 5.1.1. Market size and forecast
- 5.2. Automotive
- 5.2.1. Key market trends, growth factors and opportunities
- 5.2.2. Market size and forecast, by region
- 5.2.3. Market share analysis by country
- 5.3. Consumer Electronics
- 5.3.1. Key market trends, growth factors and opportunities
- 5.3.2. Market size and forecast, by region
- 5.3.3. Market share analysis by country
- 5.4. Manufacturing
- 5.4.1. Key market trends, growth factors and opportunities
- 5.4.2. Market size and forecast, by region
- 5.4.3. Market share analysis by country
- 5.5. Telecommunication
- 5.5.1. Key market trends, growth factors and opportunities
- 5.5.2. Market size and forecast, by region
- 5.5.3. Market share analysis by country
- 5.6. Transportation and Logistics
- 5.6.1. Key market trends, growth factors and opportunities
- 5.6.2. Market size and forecast, by region
- 5.6.3. Market share analysis by country
- 5.7. Others
- 5.7.1. Key market trends, growth factors and opportunities
- 5.7.2. Market size and forecast, by region
- 5.7.3. Market share analysis by country
CHAPTER 6: SIM CARD MARKET, BY REGION
- 6.1. Overview
- 6.1.1. Market size and forecast By Region
- 6.2. North America
- 6.2.1. Key market trends, growth factors and opportunities
- 6.2.2. Market size and forecast, by Type
- 6.2.3. Market size and forecast, by Industry Vertical
- 6.2.4. Market size and forecast, by country
- 6.2.4.1. U.S.
- 6.2.4.1.1. Market size and forecast, by Type
- 6.2.4.1.2. Market size and forecast, by Industry Vertical
- 6.2.4.2. Canada
- 6.2.4.2.1. Market size and forecast, by Type
- 6.2.4.2.2. Market size and forecast, by Industry Vertical
- 6.2.4.3. Mexico
- 6.2.4.3.1. Market size and forecast, by Type
- 6.2.4.3.2. Market size and forecast, by Industry Vertical
- 6.3. Europe
- 6.3.1. Key market trends, growth factors and opportunities
- 6.3.2. Market size and forecast, by Type
- 6.3.3. Market size and forecast, by Industry Vertical
- 6.3.4. Market size and forecast, by country
- 6.3.4.1. UK
- 6.3.4.1.1. Market size and forecast, by Type
- 6.3.4.1.2. Market size and forecast, by Industry Vertical
- 6.3.4.2. Germany
- 6.3.4.2.1. Market size and forecast, by Type
- 6.3.4.2.2. Market size and forecast, by Industry Vertical
- 6.3.4.3. France
- 6.3.4.3.1. Market size and forecast, by Type
- 6.3.4.3.2. Market size and forecast, by Industry Vertical
- 6.3.4.4. Italy
- 6.3.4.4.1. Market size and forecast, by Type
- 6.3.4.4.2. Market size and forecast, by Industry Vertical
- 6.3.4.5. Rest of Europe
- 6.3.4.5.1. Market size and forecast, by Type
- 6.3.4.5.2. Market size and forecast, by Industry Vertical
- 6.4. Asia-Pacific
- 6.4.1. Key market trends, growth factors and opportunities
- 6.4.2. Market size and forecast, by Type
- 6.4.3. Market size and forecast, by Industry Vertical
- 6.4.4. Market size and forecast, by country
- 6.4.4.1. China
- 6.4.4.1.1. Market size and forecast, by Type
- 6.4.4.1.2. Market size and forecast, by Industry Vertical
- 6.4.4.2. India
- 6.4.4.2.1. Market size and forecast, by Type
- 6.4.4.2.2. Market size and forecast, by Industry Vertical
- 6.4.4.3. Japan
- 6.4.4.3.1. Market size and forecast, by Type
- 6.4.4.3.2. Market size and forecast, by Industry Vertical
- 6.4.4.4. South Korea
- 6.4.4.4.1. Market size and forecast, by Type
- 6.4.4.4.2. Market size and forecast, by Industry Vertical
- 6.4.4.5. Australia
- 6.4.4.5.1. Market size and forecast, by Type
- 6.4.4.5.2. Market size and forecast, by Industry Vertical
- 6.4.4.6. Rest of Asia-Pacific
- 6.4.4.6.1. Market size and forecast, by Type
- 6.4.4.6.2. Market size and forecast, by Industry Vertical
- 6.5. Latin America
- 6.5.1. Key market trends, growth factors and opportunities
- 6.5.2. Market size and forecast, by Type
- 6.5.3. Market size and forecast, by Industry Vertical
- 6.5.4. Market size and forecast, by country
- 6.5.4.1. Brazil
- 6.5.4.1.1. Market size and forecast, by Type
- 6.5.4.1.2. Market size and forecast, by Industry Vertical
- 6.5.4.2. Argentina
- 6.5.4.2.1. Market size and forecast, by Type
- 6.5.4.2.2. Market size and forecast, by Industry Vertical
- 6.5.4.3. Rest of Latin America
- 6.5.4.3.1. Market size and forecast, by Type
- 6.5.4.3.2. Market size and forecast, by Industry Vertical
- 6.6. Middle East and Africa
- 6.6.1. Key market trends, growth factors and opportunities
- 6.6.2. Market size and forecast, by Type
- 6.6.3. Market size and forecast, by Industry Vertical
- 6.6.4. Market size and forecast, by country
- 6.6.4.1. UAE
- 6.6.4.1.1. Market size and forecast, by Type
- 6.6.4.1.2. Market size and forecast, by Industry Vertical
- 6.6.4.2. Saudi Arabia
- 6.6.4.2.1. Market size and forecast, by Type
- 6.6.4.2.2. Market size and forecast, by Industry Vertical
- 6.6.4.3. Qatar
- 6.6.4.3.1. Market size and forecast, by Type
- 6.6.4.3.2. Market size and forecast, by Industry Vertical
- 6.6.4.4. Rest of Middle East And Africa
- 6.6.4.4.1. Market size and forecast, by Type
- 6.6.4.4.2. Market size and forecast, by Industry Vertical
CHAPTER 7: COMPETITIVE LANDSCAPE
- 7.1. Introduction
- 7.2. Top winning strategies
- 7.3. Product mapping of top 10 player
- 7.4. Competitive dashboard
- 7.5. Competitive heatmap
- 7.6. Top player positioning, 2022
CHAPTER 8: COMPANY PROFILES
- 8.1. Thales
- 8.1.1. Company overview
- 8.1.2. Key executives
- 8.1.3. Company snapshot
- 8.1.4. Operating business segments
- 8.1.5. Product portfolio
- 8.1.6. Business performance
- 8.1.7. Key strategic moves and developments
- 8.2. Giesecke & Devrient GmbH.
- 8.2.1. Company overview
- 8.2.2. Key executives
- 8.2.3. Company snapshot
- 8.2.4. Operating business segments
- 8.2.5. Product portfolio
- 8.2.6. Business performance
- 8.2.7. Key strategic moves and developments
- 8.3. IDEMIA
- 8.3.1. Company overview
- 8.3.2. Key executives
- 8.3.3. Company snapshot
- 8.3.4. Operating business segments
- 8.3.5. Product portfolio
- 8.3.6. Business performance
- 8.3.7. Key strategic moves and developments
- 8.4. Watchdata Systems Co.
- 8.4.1. Company overview
- 8.4.2. Key executives
- 8.4.3. Company snapshot
- 8.4.4. Operating business segments
- 8.4.5. Product portfolio
- 8.4.6. Business performance
- 8.4.7. Key strategic moves and developments
- 8.5. VALID
- 8.5.1. Company overview
- 8.5.2. Key executives
- 8.5.3. Company snapshot
- 8.5.4. Operating business segments
- 8.5.5. Product portfolio
- 8.5.6. Business performance
- 8.5.7. Key strategic moves and developments
- 8.6. XH Smart tech
- 8.6.1. Company overview
- 8.6.2. Key executives
- 8.6.3. Company snapshot
- 8.6.4. Operating business segments
- 8.6.5. Product portfolio
- 8.6.6. Business performance
- 8.6.7. Key strategic moves and developments
- 8.7. DZ Cards
- 8.7.1. Company overview
- 8.7.2. Key executives
- 8.7.3. Company snapshot
- 8.7.4. Operating business segments
- 8.7.5. Product portfolio
- 8.7.6. Business performance
- 8.7.7. Key strategic moves and developments
- 8.8. HkCard Electronics co. ltd
- 8.8.1. Company overview
- 8.8.2. Key executives
- 8.8.3. Company snapshot
- 8.8.4. Operating business segments
- 8.8.5. Product portfolio
- 8.8.6. Business performance
- 8.8.7. Key strategic moves and developments
- 8.9. Hengbao
- 8.9.1. Company overview
- 8.9.2. Key executives
- 8.9.3. Company snapshot
- 8.9.4. Operating business segments
- 8.9.5. Product portfolio
- 8.9.6. Business performance
- 8.9.7. Key strategic moves and developments
- 8.10. Datang Telecom Technology
- 8.10.1. Company overview
- 8.10.2. Key executives
- 8.10.3. Company snapshot
- 8.10.4. Operating business segments
- 8.10.5. Product portfolio
- 8.10.6. Business performance
- 8.10.7. Key strategic moves and developments
