|
|
市場調査レポート
商品コード
1472335
再生PET市場:タイプ別、供給源別、用途別:世界の機会分析と産業予測、2023年~2032年Recycled PET Market By Type, By Source, By Application : Global Opportunity Analysis and Industry Forecast, 2023-2032 |
||||||
|
|
|||||||
|
|||||||


| 再生PET市場:タイプ別、供給源別、用途別:世界の機会分析と産業予測、2023年~2032年 |
|
出版日: 2024年03月01日
発行: Allied Market Research
ページ情報: 英文 610 Pages
納期: 2~3営業日
|

- 全表示
- 概要
- 図表
- 目次
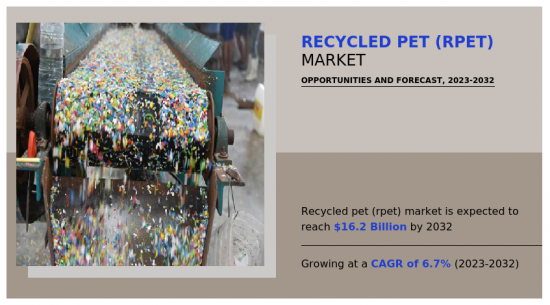
世界の再生PET(rPET)市場は、2022年に84億米ドルと評価され、2023年から2032年までのCAGRは6.7%を示し、2032年には162億米ドルに達すると推定されています。
再生ポリエチレンテレフタレート(PET)とは、使用済みPETプラスチック製品を回収、選別、洗浄、加工して新しい素材を作るプロセスを指します。PETは、その耐久性と汎用性から、飲料ボトル、飲食品容器、ポリエステル織物などによく見られるプラスチックです。
PETをリサイクルすることで、埋立地や焼却炉に送られるプラスチック廃棄物の量を減らし、天然資源を保護し、新しいプラスチックの生産に伴う環境への影響を減らすことができます。また、素材の再利用を促進し、バージンプラスチック生産の必要性を最小限に抑えることで、より持続可能な循環型経済にも貢献します。
再生PET市場の主な促進要因の一つは、環境意識の高まりとプラスチック汚染に対する懸念です。PETは包装材、繊維製品、様々な消費財に広く使用されている素材ですが、その廃棄には大きな環境課題があります。廃棄されたPET製品は、海洋、埋立地、生態系の汚染を引き起こし、野生生物や人間の健康に害を与えています。再生PETは、バージンPETの需要を減らし、資源を節約し、廃棄物を埋立地から転換することで、こうした環境への影響を緩和する解決策を提供します。エネルギー消費、温室効果ガス排出、資源枯渇の削減など、リサイクルPETの環境上の利点は、企業、政府、消費者の採用の原動力となっています。
さらに、政府の規制と政策が再生PET市場の形成に重要な役割を果たしています。多くの国がプラスチック廃棄物に対処し、リサイクルを促進するための法規制を実施しています。このような規制には、包装材にリサイクル材を使用することの義務付け、デポジット払い戻し制度、拡大生産者責任(EPR)プログラム、使い捨てプラスチックの禁止や制限などが含まれます。さらに、規制要件を遵守することは、企業がリサイクルインフラに投資し、製品中のリサイクル含有量を増やし、持続可能な慣行を採用するインセンティブとなります。さらに、規制の安定性と施行は、市場参入企業にとって公平な競争環境を確保し、再生PET分野への投資に長期的な確実性をもたらします。
さらに、リサイクル技術の革新により、リサイクルPET処理の効率、品質、拡張性が大幅に改善されました。高度な選別・洗浄・精製技術により、消費者使用後のボトル、産業廃棄物、ポリエステル繊維製品など、幅広いPET廃棄物のリサイクルが可能になりました。ケミカルリサイクル、解重合、酵素分解などの新しい技術は、機械的リサイクルの限界を克服し、リサイクルPETの用途を拡大する有望なソリューションです。このような技術の進歩は、再生PET製品の競争力と持続可能性を高め、市場の成長と技術革新を促進します。
しかし、規制の枠組みは再生PET市場のダイナミクスを形成する上で重要な役割を果たしています。しかし、一貫性のない規制、施行の欠如、地域によって異なる基準が、再生PET分野で事業を展開する業界関係者に課題を突きつけています。食品接触材料、製品ラベリング、品質基準に関する複雑な規制要件は、再生PETメーカーにコンプライアンス上の負担を与え、経営コストを増加させます。規制を調和させ、再生PET製品に関する明確なガイドラインを確立することで、市場の成長を促進し、利害関係者の信頼を高めることができます。
逆に、再生PET市場には、環境上の要請、規制の義務化、消費者の嗜好の変化により、広大で多面的なビジネスチャンスがあります。汚染問題、インフラの制約、経済的制約などの課題が存在する一方で、バリューチェーン全体の利害関係者が協調して努力することで、再生PETの可能性を最大限に引き出すことができます。インフラ開拓、技術革新、製品の多様化、共同イニシアティブに投資することで、再生PET市場は持続可能な成長を促進し、新たな経済諸国を生み出し、より循環的で資源効率の高い経済に貢献することができます。
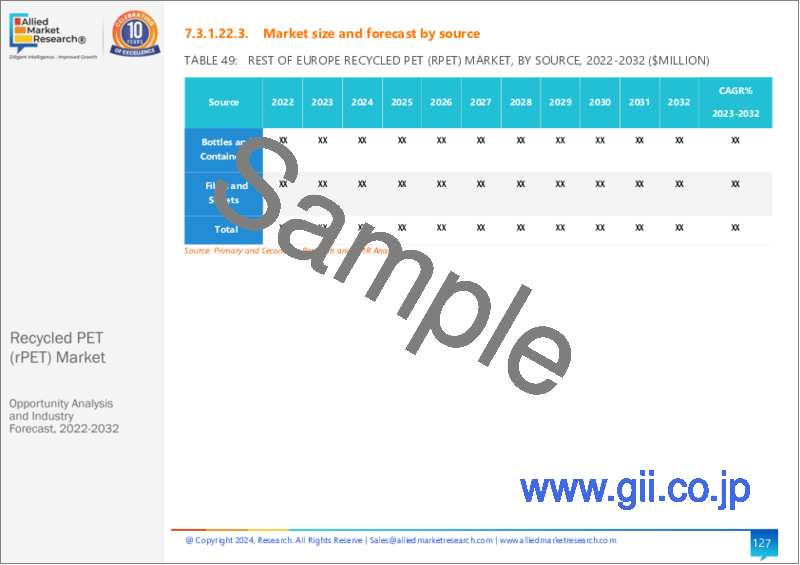
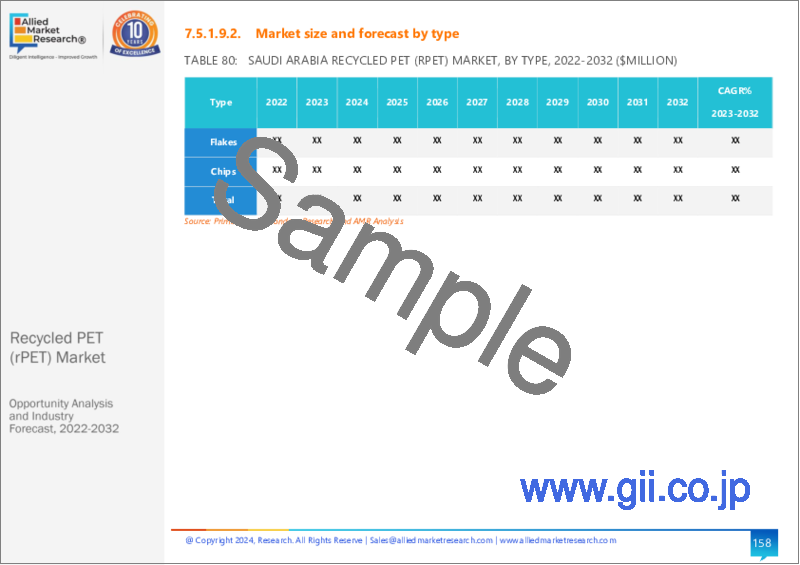
再生PET(rpET)市場は、種類、供給源、用途、地域によって区分されます。供給源別では、市場はフレークとチップに分類されます。供給源別では、市場はボトル・容器とフィルム・シートに分けられます。用途別では、市場は包装、繊維・テキスタイル、シート・熱成形、建材、自動車部品、その他に分類されます。地域別では、北米、欧州、アジア太平洋、LAMEAで調査されています。
利害関係者にとっての主なメリット
- 当レポートでは、2022年から2032年までの再生ペット(rpet)市場分析の市場セグメント、現在の動向、推定・動向、力学を定量的に分析し、有力な再生ペット(rpet)市場機会を特定します。
- 市場促進要因、市場抑制要因、市場機会に関連する情報とともに市場調査を提供します。
- ポーターのファイブフォース分析では、利害関係者が利益重視のビジネス決定を下し、サプライヤーとバイヤーのネットワークを強化できるよう、バイヤーとサプライヤーの潜在力を明らかにします。
- リサイクルペット(rpet)市場のセグメンテーションを詳細に分析することで、市場機会を見極めることができます。
- 各地域の主要国は、世界市場への収益貢献度に応じてマッピングされています。
- 市場プレイヤーのポジショニングはベンチマーキングを容易にし、市場プレイヤーの現在のポジションを明確に理解することができます。
- 本レポートには、地域別および世界の再生ペット(rpet)市場動向、主要企業、市場セグメント、応用分野、市場成長戦略の分析が含まれています。
本レポートで可能なレポートカスタマイズ(追加費用とスケジュールがあります。)
- 製品に含まれる原材料の分析(%別)
- 技術動向分析
- 平均消費支出
- 国、地域、世界レベルでの患者/疫学データ
- 規制ガイドライン
- 顧客の関心に特化した追加企業プロファイル
- 国別または地域別追加分析-市場規模および予測
- 平均販売価格分析/価格帯分析
- 企業プロファイルの拡張リスト
- 過去の市場データ
- 輸出入分析/データ
- 主要プレーヤーの詳細(所在地、連絡先、サプライヤー/ベンダーネットワークなどを含む、エクセル形式)
- 顧客/消費者/原料サプライヤーのリスト-バリューチェーン分析
- 世界/地域/国別レベルでのプレーヤーの市場シェア分析
- SWOT分析
- 数量市場規模と予測
目次
第1章 イントロダクション
第2章 エグゼクティブサマリー
第3章 市場概要
- 市場の定義と範囲
- 主な調査結果
- 影響要因
- 主な投資機会
- ポーターのファイブフォース分析
- 市場力学
- 促進要因
- 抑制要因
- 機会
- バリューチェーン分析
- 価格分析
- 主要規制分析
- 特許情勢
第4章 再生PET市場:タイプ別
- 概要
- フレーク
- チップ
第5章 再生PET市場:供給源別
- 概要
- ボトルと容器
- フィルム・シート
第6章 再生PET市場:用途別
- 概要
- 包装
- 繊維・テキスタイル
- シートと熱成形
- 建築材料
- 自動車部品
- その他
第7章 再生PET市場:地域別
- 概要
- 北米
- 米国
- カナダ
- メキシコ
- 欧州
- ドイツ
- 英国
- フランス
- スペイン
- イタリア
- その他
- アジア太平洋
- 中国
- インド
- 日本
- 韓国
- オーストラリア
- その他
- ラテンアメリカ・中東・アフリカ
- ブラジル
- サウジアラビア
- 南アフリカ
- その他
第8章 競争情勢
- イントロダクション
- 主要成功戦略
- 主要10社の製品マッピング
- 競合ダッシュボード
- 競合ヒートマップ
- 主要企業のポジショニング、2022年
第9章 企業プロファイル
- Indorama Ventures Public Company Limited
- PLASTIPAK HOLDINGS, INC.
- Alpek SAB de CV
- Clear Path Recycling, LLC
- CarbonLite Industries, LLC
- Evergreen Plastics
- Phoenix Technologies International LLC,
- M&G Chemicals
- Loop Industries, Inc.
- Placon
LIST OF TABLES
- TABLE 01. GLOBAL RECYCLED PET (RPET) MARKET, BY TYPE, 2022-2032 ($MILLION)
- TABLE 02. GLOBAL RECYCLED PET (RPET) MARKET, BY TYPE, 2022-2032 (KILOTON)
- TABLE 03. RECYCLED PET (RPET) MARKET FOR FLAKES, BY REGION, 2022-2032 ($MILLION)
- TABLE 04. RECYCLED PET (RPET) MARKET FOR FLAKES, BY REGION, 2022-2032 (KILOTON)
- TABLE 05. RECYCLED PET (RPET) MARKET FOR CHIPS, BY REGION, 2022-2032 ($MILLION)
- TABLE 06. RECYCLED PET (RPET) MARKET FOR CHIPS, BY REGION, 2022-2032 (KILOTON)
- TABLE 07. GLOBAL RECYCLED PET (RPET) MARKET, BY SOURCE, 2022-2032 ($MILLION)
- TABLE 08. GLOBAL RECYCLED PET (RPET) MARKET, BY SOURCE, 2022-2032 (KILOTON)
- TABLE 09. RECYCLED PET (RPET) MARKET FOR BOTTLES AND CONTAINERS, BY REGION, 2022-2032 ($MILLION)
- TABLE 10. RECYCLED PET (RPET) MARKET FOR BOTTLES AND CONTAINERS, BY REGION, 2022-2032 (KILOTON)
- TABLE 11. RECYCLED PET (RPET) MARKET FOR FILMS AND SHEETS, BY REGION, 2022-2032 ($MILLION)
- TABLE 12. RECYCLED PET (RPET) MARKET FOR FILMS AND SHEETS, BY REGION, 2022-2032 (KILOTON)
- TABLE 13. GLOBAL RECYCLED PET (RPET) MARKET, BY APPLICATION, 2022-2032 ($MILLION)
- TABLE 14. GLOBAL RECYCLED PET (RPET) MARKET, BY APPLICATION, 2022-2032 (KILOTON)
- TABLE 15. RECYCLED PET (RPET) MARKET FOR PACKAGING, BY REGION, 2022-2032 ($MILLION)
- TABLE 16. RECYCLED PET (RPET) MARKET FOR PACKAGING, BY REGION, 2022-2032 (KILOTON)
- TABLE 17. RECYCLED PET (RPET) MARKET FOR FIBER AND TEXTILES, BY REGION, 2022-2032 ($MILLION)
- TABLE 18. RECYCLED PET (RPET) MARKET FOR FIBER AND TEXTILES, BY REGION, 2022-2032 (KILOTON)
- TABLE 19. RECYCLED PET (RPET) MARKET FOR SHEETS AND THERMOFORMING, BY REGION, 2022-2032 ($MILLION)
- TABLE 20. RECYCLED PET (RPET) MARKET FOR SHEETS AND THERMOFORMING, BY REGION, 2022-2032 (KILOTON)
- TABLE 21. RECYCLED PET (RPET) MARKET FOR CONSTRUCTION MATERIALS, BY REGION, 2022-2032 ($MILLION)
- TABLE 22. RECYCLED PET (RPET) MARKET FOR CONSTRUCTION MATERIALS, BY REGION, 2022-2032 (KILOTON)
- TABLE 23. RECYCLED PET (RPET) MARKET FOR AUTOMOTIVE PARTS, BY REGION, 2022-2032 ($MILLION)
- TABLE 24. RECYCLED PET (RPET) MARKET FOR AUTOMOTIVE PARTS, BY REGION, 2022-2032 (KILOTON)
- TABLE 25. RECYCLED PET (RPET) MARKET FOR OTHERS, BY REGION, 2022-2032 ($MILLION)
- TABLE 26. RECYCLED PET (RPET) MARKET FOR OTHERS, BY REGION, 2022-2032 (KILOTON)
- TABLE 27. RECYCLED PET (RPET) MARKET, BY REGION, 2022-2032 ($MILLION)
- TABLE 28. RECYCLED PET (RPET) MARKET, BY REGION, 2022-2032 (KILOTON)
- TABLE 29. NORTH AMERICA RECYCLED PET (RPET) MARKET, BY TYPE, 2022-2032 ($MILLION)
- TABLE 30. NORTH AMERICA RECYCLED PET (RPET) MARKET, BY TYPE, 2022-2032 (KILOTON)
- TABLE 31. NORTH AMERICA RECYCLED PET (RPET) MARKET, BY SOURCE, 2022-2032 ($MILLION)
- TABLE 32. NORTH AMERICA RECYCLED PET (RPET) MARKET, BY SOURCE, 2022-2032 (KILOTON)
- TABLE 33. NORTH AMERICA RECYCLED PET (RPET) MARKET, BY APPLICATION, 2022-2032 ($MILLION)
- TABLE 34. NORTH AMERICA RECYCLED PET (RPET) MARKET, BY APPLICATION, 2022-2032 (KILOTON)
- TABLE 35. NORTH AMERICA RECYCLED PET (RPET) MARKET, BY COUNTRY, 2022-2032 ($MILLION)
- TABLE 36. NORTH AMERICA RECYCLED PET (RPET) MARKET, BY COUNTRY, 2022-2032 (KILOTON)
- TABLE 37. U.S. RECYCLED PET (RPET) MARKET, BY TYPE, 2022-2032 ($MILLION)
- TABLE 38. U.S. RECYCLED PET (RPET) MARKET, BY TYPE, 2022-2032 (KILOTON)
- TABLE 39. U.S. RECYCLED PET (RPET) MARKET, BY SOURCE, 2022-2032 ($MILLION)
- TABLE 40. U.S. RECYCLED PET (RPET) MARKET, BY SOURCE, 2022-2032 (KILOTON)
- TABLE 41. U.S. RECYCLED PET (RPET) MARKET, BY APPLICATION, 2022-2032 ($MILLION)
- TABLE 42. U.S. RECYCLED PET (RPET) MARKET, BY APPLICATION, 2022-2032 (KILOTON)
- TABLE 43. CANADA RECYCLED PET (RPET) MARKET, BY TYPE, 2022-2032 ($MILLION)
- TABLE 44. CANADA RECYCLED PET (RPET) MARKET, BY TYPE, 2022-2032 (KILOTON)
- TABLE 45. CANADA RECYCLED PET (RPET) MARKET, BY SOURCE, 2022-2032 ($MILLION)
- TABLE 46. CANADA RECYCLED PET (RPET) MARKET, BY SOURCE, 2022-2032 (KILOTON)
- TABLE 47. CANADA RECYCLED PET (RPET) MARKET, BY APPLICATION, 2022-2032 ($MILLION)
- TABLE 48. CANADA RECYCLED PET (RPET) MARKET, BY APPLICATION, 2022-2032 (KILOTON)
- TABLE 49. MEXICO RECYCLED PET (RPET) MARKET, BY TYPE, 2022-2032 ($MILLION)
- TABLE 50. MEXICO RECYCLED PET (RPET) MARKET, BY TYPE, 2022-2032 (KILOTON)
- TABLE 51. MEXICO RECYCLED PET (RPET) MARKET, BY SOURCE, 2022-2032 ($MILLION)
- TABLE 52. MEXICO RECYCLED PET (RPET) MARKET, BY SOURCE, 2022-2032 (KILOTON)
- TABLE 53. MEXICO RECYCLED PET (RPET) MARKET, BY APPLICATION, 2022-2032 ($MILLION)
- TABLE 54. MEXICO RECYCLED PET (RPET) MARKET, BY APPLICATION, 2022-2032 (KILOTON)
- TABLE 55. EUROPE RECYCLED PET (RPET) MARKET, BY TYPE, 2022-2032 ($MILLION)
- TABLE 56. EUROPE RECYCLED PET (RPET) MARKET, BY TYPE, 2022-2032 (KILOTON)
- TABLE 57. EUROPE RECYCLED PET (RPET) MARKET, BY SOURCE, 2022-2032 ($MILLION)
- TABLE 58. EUROPE RECYCLED PET (RPET) MARKET, BY SOURCE, 2022-2032 (KILOTON)
- TABLE 59. EUROPE RECYCLED PET (RPET) MARKET, BY APPLICATION, 2022-2032 ($MILLION)
- TABLE 60. EUROPE RECYCLED PET (RPET) MARKET, BY APPLICATION, 2022-2032 (KILOTON)
- TABLE 61. EUROPE RECYCLED PET (RPET) MARKET, BY COUNTRY, 2022-2032 ($MILLION)
- TABLE 62. EUROPE RECYCLED PET (RPET) MARKET, BY COUNTRY, 2022-2032 (KILOTON)
- TABLE 63. GERMANY RECYCLED PET (RPET) MARKET, BY TYPE, 2022-2032 ($MILLION)
- TABLE 64. GERMANY RECYCLED PET (RPET) MARKET, BY TYPE, 2022-2032 (KILOTON)
- TABLE 65. GERMANY RECYCLED PET (RPET) MARKET, BY SOURCE, 2022-2032 ($MILLION)
- TABLE 66. GERMANY RECYCLED PET (RPET) MARKET, BY SOURCE, 2022-2032 (KILOTON)
- TABLE 67. GERMANY RECYCLED PET (RPET) MARKET, BY APPLICATION, 2022-2032 ($MILLION)
- TABLE 68. GERMANY RECYCLED PET (RPET) MARKET, BY APPLICATION, 2022-2032 (KILOTON)
- TABLE 69. UK RECYCLED PET (RPET) MARKET, BY TYPE, 2022-2032 ($MILLION)
- TABLE 70. UK RECYCLED PET (RPET) MARKET, BY TYPE, 2022-2032 (KILOTON)
- TABLE 71. UK RECYCLED PET (RPET) MARKET, BY SOURCE, 2022-2032 ($MILLION)
- TABLE 72. UK RECYCLED PET (RPET) MARKET, BY SOURCE, 2022-2032 (KILOTON)
- TABLE 73. UK RECYCLED PET (RPET) MARKET, BY APPLICATION, 2022-2032 ($MILLION)
- TABLE 74. UK RECYCLED PET (RPET) MARKET, BY APPLICATION, 2022-2032 (KILOTON)
- TABLE 75. FRANCE RECYCLED PET (RPET) MARKET, BY TYPE, 2022-2032 ($MILLION)
- TABLE 76. FRANCE RECYCLED PET (RPET) MARKET, BY TYPE, 2022-2032 (KILOTON)
- TABLE 77. FRANCE RECYCLED PET (RPET) MARKET, BY SOURCE, 2022-2032 ($MILLION)
- TABLE 78. FRANCE RECYCLED PET (RPET) MARKET, BY SOURCE, 2022-2032 (KILOTON)
- TABLE 79. FRANCE RECYCLED PET (RPET) MARKET, BY APPLICATION, 2022-2032 ($MILLION)
- TABLE 80. FRANCE RECYCLED PET (RPET) MARKET, BY APPLICATION, 2022-2032 (KILOTON)
- TABLE 81. SPAIN RECYCLED PET (RPET) MARKET, BY TYPE, 2022-2032 ($MILLION)
- TABLE 82. SPAIN RECYCLED PET (RPET) MARKET, BY TYPE, 2022-2032 (KILOTON)
- TABLE 83. SPAIN RECYCLED PET (RPET) MARKET, BY SOURCE, 2022-2032 ($MILLION)
- TABLE 84. SPAIN RECYCLED PET (RPET) MARKET, BY SOURCE, 2022-2032 (KILOTON)
- TABLE 85. SPAIN RECYCLED PET (RPET) MARKET, BY APPLICATION, 2022-2032 ($MILLION)
- TABLE 86. SPAIN RECYCLED PET (RPET) MARKET, BY APPLICATION, 2022-2032 (KILOTON)
- TABLE 87. ITALY RECYCLED PET (RPET) MARKET, BY TYPE, 2022-2032 ($MILLION)
- TABLE 88. ITALY RECYCLED PET (RPET) MARKET, BY TYPE, 2022-2032 (KILOTON)
- TABLE 89. ITALY RECYCLED PET (RPET) MARKET, BY SOURCE, 2022-2032 ($MILLION)
- TABLE 90. ITALY RECYCLED PET (RPET) MARKET, BY SOURCE, 2022-2032 (KILOTON)
- TABLE 91. ITALY RECYCLED PET (RPET) MARKET, BY APPLICATION, 2022-2032 ($MILLION)
- TABLE 92. ITALY RECYCLED PET (RPET) MARKET, BY APPLICATION, 2022-2032 (KILOTON)
- TABLE 93. REST OF EUROPE RECYCLED PET (RPET) MARKET, BY TYPE, 2022-2032 ($MILLION)
- TABLE 94. REST OF EUROPE RECYCLED PET (RPET) MARKET, BY TYPE, 2022-2032 (KILOTON)
- TABLE 95. REST OF EUROPE RECYCLED PET (RPET) MARKET, BY SOURCE, 2022-2032 ($MILLION)
- TABLE 96. REST OF EUROPE RECYCLED PET (RPET) MARKET, BY SOURCE, 2022-2032 (KILOTON)
- TABLE 97. REST OF EUROPE RECYCLED PET (RPET) MARKET, BY APPLICATION, 2022-2032 ($MILLION)
- TABLE 98. REST OF EUROPE RECYCLED PET (RPET) MARKET, BY APPLICATION, 2022-2032 (KILOTON)
- TABLE 99. ASIA-PACIFIC RECYCLED PET (RPET) MARKET, BY TYPE, 2022-2032 ($MILLION)
- TABLE 100. ASIA-PACIFIC RECYCLED PET (RPET) MARKET, BY TYPE, 2022-2032 (KILOTON)
- TABLE 101. ASIA-PACIFIC RECYCLED PET (RPET) MARKET, BY SOURCE, 2022-2032 ($MILLION)
- TABLE 102. ASIA-PACIFIC RECYCLED PET (RPET) MARKET, BY SOURCE, 2022-2032 (KILOTON)
- TABLE 103. ASIA-PACIFIC RECYCLED PET (RPET) MARKET, BY APPLICATION, 2022-2032 ($MILLION)
- TABLE 104. ASIA-PACIFIC RECYCLED PET (RPET) MARKET, BY APPLICATION, 2022-2032 (KILOTON)
- TABLE 105. ASIA-PACIFIC RECYCLED PET (RPET) MARKET, BY COUNTRY, 2022-2032 ($MILLION)
- TABLE 106. ASIA-PACIFIC RECYCLED PET (RPET) MARKET, BY COUNTRY, 2022-2032 (KILOTON)
- TABLE 107. CHINA RECYCLED PET (RPET) MARKET, BY TYPE, 2022-2032 ($MILLION)
- TABLE 108. CHINA RECYCLED PET (RPET) MARKET, BY TYPE, 2022-2032 (KILOTON)
- TABLE 109. CHINA RECYCLED PET (RPET) MARKET, BY SOURCE, 2022-2032 ($MILLION)
- TABLE 110. CHINA RECYCLED PET (RPET) MARKET, BY SOURCE, 2022-2032 (KILOTON)
- TABLE 111. CHINA RECYCLED PET (RPET) MARKET, BY APPLICATION, 2022-2032 ($MILLION)
- TABLE 112. CHINA RECYCLED PET (RPET) MARKET, BY APPLICATION, 2022-2032 (KILOTON)
- TABLE 113. INDIA RECYCLED PET (RPET) MARKET, BY TYPE, 2022-2032 ($MILLION)
- TABLE 114. INDIA RECYCLED PET (RPET) MARKET, BY TYPE, 2022-2032 (KILOTON)
- TABLE 115. INDIA RECYCLED PET (RPET) MARKET, BY SOURCE, 2022-2032 ($MILLION)
- TABLE 116. INDIA RECYCLED PET (RPET) MARKET, BY SOURCE, 2022-2032 (KILOTON)
- TABLE 117. INDIA RECYCLED PET (RPET) MARKET, BY APPLICATION, 2022-2032 ($MILLION)
- TABLE 118. INDIA RECYCLED PET (RPET) MARKET, BY APPLICATION, 2022-2032 (KILOTON)
- TABLE 119. JAPAN RECYCLED PET (RPET) MARKET, BY TYPE, 2022-2032 ($MILLION)
- TABLE 120. JAPAN RECYCLED PET (RPET) MARKET, BY TYPE, 2022-2032 (KILOTON)
- TABLE 121. JAPAN RECYCLED PET (RPET) MARKET, BY SOURCE, 2022-2032 ($MILLION)
- TABLE 122. JAPAN RECYCLED PET (RPET) MARKET, BY SOURCE, 2022-2032 (KILOTON)
- TABLE 123. JAPAN RECYCLED PET (RPET) MARKET, BY APPLICATION, 2022-2032 ($MILLION)
- TABLE 124. JAPAN RECYCLED PET (RPET) MARKET, BY APPLICATION, 2022-2032 (KILOTON)
- TABLE 125. SOUTH KOREA RECYCLED PET (RPET) MARKET, BY TYPE, 2022-2032 ($MILLION)
- TABLE 126. SOUTH KOREA RECYCLED PET (RPET) MARKET, BY TYPE, 2022-2032 (KILOTON)
- TABLE 127. SOUTH KOREA RECYCLED PET (RPET) MARKET, BY SOURCE, 2022-2032 ($MILLION)
- TABLE 128. SOUTH KOREA RECYCLED PET (RPET) MARKET, BY SOURCE, 2022-2032 (KILOTON)
- TABLE 129. SOUTH KOREA RECYCLED PET (RPET) MARKET, BY APPLICATION, 2022-2032 ($MILLION)
- TABLE 130. SOUTH KOREA RECYCLED PET (RPET) MARKET, BY APPLICATION, 2022-2032 (KILOTON)
- TABLE 131. AUSTRALIA RECYCLED PET (RPET) MARKET, BY TYPE, 2022-2032 ($MILLION)
- TABLE 132. AUSTRALIA RECYCLED PET (RPET) MARKET, BY TYPE, 2022-2032 (KILOTON)
- TABLE 133. AUSTRALIA RECYCLED PET (RPET) MARKET, BY SOURCE, 2022-2032 ($MILLION)
- TABLE 134. AUSTRALIA RECYCLED PET (RPET) MARKET, BY SOURCE, 2022-2032 (KILOTON)
- TABLE 135. AUSTRALIA RECYCLED PET (RPET) MARKET, BY APPLICATION, 2022-2032 ($MILLION)
- TABLE 136. AUSTRALIA RECYCLED PET (RPET) MARKET, BY APPLICATION, 2022-2032 (KILOTON)
- TABLE 137. REST OF ASIA-PACIFIC RECYCLED PET (RPET) MARKET, BY TYPE, 2022-2032 ($MILLION)
- TABLE 138. REST OF ASIA-PACIFIC RECYCLED PET (RPET) MARKET, BY TYPE, 2022-2032 (KILOTON)
- TABLE 139. REST OF ASIA-PACIFIC RECYCLED PET (RPET) MARKET, BY SOURCE, 2022-2032 ($MILLION)
- TABLE 140. REST OF ASIA-PACIFIC RECYCLED PET (RPET) MARKET, BY SOURCE, 2022-2032 (KILOTON)
- TABLE 141. REST OF ASIA-PACIFIC RECYCLED PET (RPET) MARKET, BY APPLICATION, 2022-2032 ($MILLION)
- TABLE 142. REST OF ASIA-PACIFIC RECYCLED PET (RPET) MARKET, BY APPLICATION, 2022-2032 (KILOTON)
- TABLE 143. LAMEA RECYCLED PET (RPET) MARKET, BY TYPE, 2022-2032 ($MILLION)
- TABLE 144. LAMEA RECYCLED PET (RPET) MARKET, BY TYPE, 2022-2032 (KILOTON)
- TABLE 145. LAMEA RECYCLED PET (RPET) MARKET, BY SOURCE, 2022-2032 ($MILLION)
- TABLE 146. LAMEA RECYCLED PET (RPET) MARKET, BY SOURCE, 2022-2032 (KILOTON)
- TABLE 147. LAMEA RECYCLED PET (RPET) MARKET, BY APPLICATION, 2022-2032 ($MILLION)
- TABLE 148. LAMEA RECYCLED PET (RPET) MARKET, BY APPLICATION, 2022-2032 (KILOTON)
- TABLE 149. LAMEA RECYCLED PET (RPET) MARKET, BY COUNTRY, 2022-2032 ($MILLION)
- TABLE 150. LAMEA RECYCLED PET (RPET) MARKET, BY COUNTRY, 2022-2032 (KILOTON)
- TABLE 151. BRAZIL RECYCLED PET (RPET) MARKET, BY TYPE, 2022-2032 ($MILLION)
- TABLE 152. BRAZIL RECYCLED PET (RPET) MARKET, BY TYPE, 2022-2032 (KILOTON)
- TABLE 153. BRAZIL RECYCLED PET (RPET) MARKET, BY SOURCE, 2022-2032 ($MILLION)
- TABLE 154. BRAZIL RECYCLED PET (RPET) MARKET, BY SOURCE, 2022-2032 (KILOTON)
- TABLE 155. BRAZIL RECYCLED PET (RPET) MARKET, BY APPLICATION, 2022-2032 ($MILLION)
- TABLE 156. BRAZIL RECYCLED PET (RPET) MARKET, BY APPLICATION, 2022-2032 (KILOTON)
- TABLE 157. SAUDI ARABIA RECYCLED PET (RPET) MARKET, BY TYPE, 2022-2032 ($MILLION)
- TABLE 158. SAUDI ARABIA RECYCLED PET (RPET) MARKET, BY TYPE, 2022-2032 (KILOTON)
- TABLE 159. SAUDI ARABIA RECYCLED PET (RPET) MARKET, BY SOURCE, 2022-2032 ($MILLION)
- TABLE 160. SAUDI ARABIA RECYCLED PET (RPET) MARKET, BY SOURCE, 2022-2032 (KILOTON)
- TABLE 161. SAUDI ARABIA RECYCLED PET (RPET) MARKET, BY APPLICATION, 2022-2032 ($MILLION)
- TABLE 162. SAUDI ARABIA RECYCLED PET (RPET) MARKET, BY APPLICATION, 2022-2032 (KILOTON)
- TABLE 163. SOUTH AFRICA RECYCLED PET (RPET) MARKET, BY TYPE, 2022-2032 ($MILLION)
- TABLE 164. SOUTH AFRICA RECYCLED PET (RPET) MARKET, BY TYPE, 2022-2032 (KILOTON)
- TABLE 165. SOUTH AFRICA RECYCLED PET (RPET) MARKET, BY SOURCE, 2022-2032 ($MILLION)
- TABLE 166. SOUTH AFRICA RECYCLED PET (RPET) MARKET, BY SOURCE, 2022-2032 (KILOTON)
- TABLE 167. SOUTH AFRICA RECYCLED PET (RPET) MARKET, BY APPLICATION, 2022-2032 ($MILLION)
- TABLE 168. SOUTH AFRICA RECYCLED PET (RPET) MARKET, BY APPLICATION, 2022-2032 (KILOTON)
- TABLE 169. REST OF LAMEA RECYCLED PET (RPET) MARKET, BY TYPE, 2022-2032 ($MILLION)
- TABLE 170. REST OF LAMEA RECYCLED PET (RPET) MARKET, BY TYPE, 2022-2032 (KILOTON)
- TABLE 171. REST OF LAMEA RECYCLED PET (RPET) MARKET, BY SOURCE, 2022-2032 ($MILLION)
- TABLE 172. REST OF LAMEA RECYCLED PET (RPET) MARKET, BY SOURCE, 2022-2032 (KILOTON)
- TABLE 173. REST OF LAMEA RECYCLED PET (RPET) MARKET, BY APPLICATION, 2022-2032 ($MILLION)
- TABLE 174. REST OF LAMEA RECYCLED PET (RPET) MARKET, BY APPLICATION, 2022-2032 (KILOTON)
- TABLE 175. INDORAMA VENTURES PUBLIC COMPANY LIMITED: KEY EXECUTIVES
- TABLE 176. INDORAMA VENTURES PUBLIC COMPANY LIMITED: COMPANY SNAPSHOT
- TABLE 177. INDORAMA VENTURES PUBLIC COMPANY LIMITED: PRODUCT SEGMENTS
- TABLE 178. INDORAMA VENTURES PUBLIC COMPANY LIMITED: SERVICE SEGMENTS
- TABLE 179. INDORAMA VENTURES PUBLIC COMPANY LIMITED: PRODUCT PORTFOLIO
- TABLE 180. INDORAMA VENTURES PUBLIC COMPANY LIMITED: KEY STRATERGIES
- TABLE 181. PLASTIPAK HOLDINGS, INC.: KEY EXECUTIVES
- TABLE 182. PLASTIPAK HOLDINGS, INC.: COMPANY SNAPSHOT
- TABLE 183. PLASTIPAK HOLDINGS, INC.: PRODUCT SEGMENTS
- TABLE 184. PLASTIPAK HOLDINGS, INC.: SERVICE SEGMENTS
- TABLE 185. PLASTIPAK HOLDINGS, INC.: PRODUCT PORTFOLIO
- TABLE 186. PLASTIPAK HOLDINGS, INC.: KEY STRATERGIES
- TABLE 187. ALPEK SAB DE CV: KEY EXECUTIVES
- TABLE 188. ALPEK SAB DE CV: COMPANY SNAPSHOT
- TABLE 189. ALPEK SAB DE CV: PRODUCT SEGMENTS
- TABLE 190. ALPEK SAB DE CV: SERVICE SEGMENTS
- TABLE 191. ALPEK SAB DE CV: PRODUCT PORTFOLIO
- TABLE 192. ALPEK SAB DE CV: KEY STRATERGIES
- TABLE 193. CLEAR PATH RECYCLING, LLC: KEY EXECUTIVES
- TABLE 194. CLEAR PATH RECYCLING, LLC: COMPANY SNAPSHOT
- TABLE 195. CLEAR PATH RECYCLING, LLC: PRODUCT SEGMENTS
- TABLE 196. CLEAR PATH RECYCLING, LLC: SERVICE SEGMENTS
- TABLE 197. CLEAR PATH RECYCLING, LLC: PRODUCT PORTFOLIO
- TABLE 198. CLEAR PATH RECYCLING, LLC: KEY STRATERGIES
- TABLE 199. CARBONLITE INDUSTRIES, LLC: KEY EXECUTIVES
- TABLE 200. CARBONLITE INDUSTRIES, LLC: COMPANY SNAPSHOT
- TABLE 201. CARBONLITE INDUSTRIES, LLC: PRODUCT SEGMENTS
- TABLE 202. CARBONLITE INDUSTRIES, LLC: SERVICE SEGMENTS
- TABLE 203. CARBONLITE INDUSTRIES, LLC: PRODUCT PORTFOLIO
- TABLE 204. CARBONLITE INDUSTRIES, LLC: KEY STRATERGIES
- TABLE 205. EVERGREEN PLASTICS: KEY EXECUTIVES
- TABLE 206. EVERGREEN PLASTICS: COMPANY SNAPSHOT
- TABLE 207. EVERGREEN PLASTICS: PRODUCT SEGMENTS
- TABLE 208. EVERGREEN PLASTICS: SERVICE SEGMENTS
- TABLE 209. EVERGREEN PLASTICS: PRODUCT PORTFOLIO
- TABLE 210. EVERGREEN PLASTICS: KEY STRATERGIES
- TABLE 211. PHOENIX TECHNOLOGIES INTERNATIONAL LLC,: KEY EXECUTIVES
- TABLE 212. PHOENIX TECHNOLOGIES INTERNATIONAL LLC,: COMPANY SNAPSHOT
- TABLE 213. PHOENIX TECHNOLOGIES INTERNATIONAL LLC,: PRODUCT SEGMENTS
- TABLE 214. PHOENIX TECHNOLOGIES INTERNATIONAL LLC,: SERVICE SEGMENTS
- TABLE 215. PHOENIX TECHNOLOGIES INTERNATIONAL LLC,: PRODUCT PORTFOLIO
- TABLE 216. PHOENIX TECHNOLOGIES INTERNATIONAL LLC,: KEY STRATERGIES
- TABLE 217. M&G CHEMICALS: KEY EXECUTIVES
- TABLE 218. M&G CHEMICALS: COMPANY SNAPSHOT
- TABLE 219. M&G CHEMICALS: PRODUCT SEGMENTS
- TABLE 220. M&G CHEMICALS: SERVICE SEGMENTS
- TABLE 221. M&G CHEMICALS: PRODUCT PORTFOLIO
- TABLE 222. M&G CHEMICALS: KEY STRATERGIES
- TABLE 223. LOOP INDUSTRIES, INC.: KEY EXECUTIVES
- TABLE 224. LOOP INDUSTRIES, INC.: COMPANY SNAPSHOT
- TABLE 225. LOOP INDUSTRIES, INC.: PRODUCT SEGMENTS
- TABLE 226. LOOP INDUSTRIES, INC.: SERVICE SEGMENTS
- TABLE 227. LOOP INDUSTRIES, INC.: PRODUCT PORTFOLIO
- TABLE 228. LOOP INDUSTRIES, INC.: KEY STRATERGIES
- TABLE 229. PLACON: KEY EXECUTIVES
- TABLE 230. PLACON: COMPANY SNAPSHOT
- TABLE 231. PLACON: PRODUCT SEGMENTS
- TABLE 232. PLACON: SERVICE SEGMENTS
- TABLE 233. PLACON: PRODUCT PORTFOLIO
- TABLE 234. PLACON: KEY STRATERGIES
LIST OF FIGURES
- FIGURE 01. RECYCLED PET (RPET) MARKET, 2022-2032
- FIGURE 02. SEGMENTATION OF RECYCLED PET (RPET) MARKET,2022-2032
- FIGURE 03. TOP IMPACTING FACTORS IN RECYCLED PET (RPET) MARKET
- FIGURE 04. TOP INVESTMENT POCKETS IN RECYCLED PET (RPET) MARKET (2023-2032)
- FIGURE 05. BARGAINING POWER OF SUPPLIERS
- FIGURE 06. BARGAINING POWER OF BUYERS
- FIGURE 07. THREAT OF SUBSTITUTION
- FIGURE 08. THREAT OF SUBSTITUTION
- FIGURE 09. COMPETITIVE RIVALRY
- FIGURE 10. GLOBAL RECYCLED PET (RPET) MARKET:DRIVERS, RESTRAINTS AND OPPORTUNITIES
- FIGURE 11. PRICING ANALYSIS: RECYCLED PET (RPET) MARKET 2022 AND 2032
- FIGURE 12. IMPACT OF KEY REGULATION: RECYCLED PET (RPET) MARKET
- FIGURE 13. PATENT ANALYSIS BY COMPANY
- FIGURE 14. PATENT ANALYSIS BY COUNTRY
- FIGURE 15. RECYCLED PET (RPET) MARKET, BY TYPE, 2022 AND 2032(%)
- FIGURE 16. COMPARATIVE SHARE ANALYSIS OF RECYCLED PET (RPET) MARKET FOR FLAKES, BY COUNTRY 2022 AND 2032(%)
- FIGURE 17. COMPARATIVE SHARE ANALYSIS OF RECYCLED PET (RPET) MARKET FOR CHIPS, BY COUNTRY 2022 AND 2032(%)
- FIGURE 18. RECYCLED PET (RPET) MARKET, BY SOURCE, 2022 AND 2032(%)
- FIGURE 19. COMPARATIVE SHARE ANALYSIS OF RECYCLED PET (RPET) MARKET FOR BOTTLES AND CONTAINERS, BY COUNTRY 2022 AND 2032(%)
- FIGURE 20. COMPARATIVE SHARE ANALYSIS OF RECYCLED PET (RPET) MARKET FOR FILMS AND SHEETS, BY COUNTRY 2022 AND 2032(%)
- FIGURE 21. RECYCLED PET (RPET) MARKET, BY APPLICATION, 2022 AND 2032(%)
- FIGURE 22. COMPARATIVE SHARE ANALYSIS OF RECYCLED PET (RPET) MARKET FOR PACKAGING, BY COUNTRY 2022 AND 2032(%)
- FIGURE 23. COMPARATIVE SHARE ANALYSIS OF RECYCLED PET (RPET) MARKET FOR FIBER AND TEXTILES, BY COUNTRY 2022 AND 2032(%)
- FIGURE 24. COMPARATIVE SHARE ANALYSIS OF RECYCLED PET (RPET) MARKET FOR SHEETS AND THERMOFORMING, BY COUNTRY 2022 AND 2032(%)
- FIGURE 25. COMPARATIVE SHARE ANALYSIS OF RECYCLED PET (RPET) MARKET FOR CONSTRUCTION MATERIALS, BY COUNTRY 2022 AND 2032(%)
- FIGURE 26. COMPARATIVE SHARE ANALYSIS OF RECYCLED PET (RPET) MARKET FOR AUTOMOTIVE PARTS, BY COUNTRY 2022 AND 2032(%)
- FIGURE 27. COMPARATIVE SHARE ANALYSIS OF RECYCLED PET (RPET) MARKET FOR OTHERS, BY COUNTRY 2022 AND 2032(%)
- FIGURE 28. RECYCLED PET (RPET) MARKET BY REGION, 2022 AND 2032(%)
- FIGURE 29. U.S. RECYCLED PET (RPET) MARKET, 2022-2032 ($MILLION)
- FIGURE 30. CANADA RECYCLED PET (RPET) MARKET, 2022-2032 ($MILLION)
- FIGURE 31. MEXICO RECYCLED PET (RPET) MARKET, 2022-2032 ($MILLION)
- FIGURE 32. GERMANY RECYCLED PET (RPET) MARKET, 2022-2032 ($MILLION)
- FIGURE 33. UK RECYCLED PET (RPET) MARKET, 2022-2032 ($MILLION)
- FIGURE 34. FRANCE RECYCLED PET (RPET) MARKET, 2022-2032 ($MILLION)
- FIGURE 35. SPAIN RECYCLED PET (RPET) MARKET, 2022-2032 ($MILLION)
- FIGURE 36. ITALY RECYCLED PET (RPET) MARKET, 2022-2032 ($MILLION)
- FIGURE 37. REST OF EUROPE RECYCLED PET (RPET) MARKET, 2022-2032 ($MILLION)
- FIGURE 38. CHINA RECYCLED PET (RPET) MARKET, 2022-2032 ($MILLION)
- FIGURE 39. INDIA RECYCLED PET (RPET) MARKET, 2022-2032 ($MILLION)
- FIGURE 40. JAPAN RECYCLED PET (RPET) MARKET, 2022-2032 ($MILLION)
- FIGURE 41. SOUTH KOREA RECYCLED PET (RPET) MARKET, 2022-2032 ($MILLION)
- FIGURE 42. AUSTRALIA RECYCLED PET (RPET) MARKET, 2022-2032 ($MILLION)
- FIGURE 43. REST OF ASIA-PACIFIC RECYCLED PET (RPET) MARKET, 2022-2032 ($MILLION)
- FIGURE 44. BRAZIL RECYCLED PET (RPET) MARKET, 2022-2032 ($MILLION)
- FIGURE 45. SAUDI ARABIA RECYCLED PET (RPET) MARKET, 2022-2032 ($MILLION)
- FIGURE 46. SOUTH AFRICA RECYCLED PET (RPET) MARKET, 2022-2032 ($MILLION)
- FIGURE 47. REST OF LAMEA RECYCLED PET (RPET) MARKET, 2022-2032 ($MILLION)
- FIGURE 48. TOP WINNING STRATEGIES, BY YEAR
- FIGURE 49. TOP WINNING STRATEGIES, BY DEVELOPMENT
- FIGURE 50. TOP WINNING STRATEGIES, BY COMPANY
- FIGURE 51. PRODUCT MAPPING OF TOP 10 PLAYERS
- FIGURE 52. COMPETITIVE DASHBOARD
- FIGURE 53. COMPETITIVE HEATMAP: RECYCLED PET (RPET) MARKET
- FIGURE 54. TOP PLAYER POSITIONING, 2022
The global recycled PET (rPET) market was valued at $8.4 billion in 2022 and is estimated to reach $16.2 billion by 2032, exhibiting a CAGR of 6.7% from 2023 to 2032.
Recycled Polyethylene Terephthalate (PET) refers to the process of collecting, sorting, cleaning, and processing used PET plastic products to create new materials. PET is a common type of plastic found in items such as beverage bottles, food containers, and polyester fabrics due to its durability and versatility.
Recycling PET helps reduce the amount of plastic waste sent to landfills or incinerators, conserves natural resources, and decreases the environmental impact associated with producing new plastics. It also contributes to a more sustainable and circular economy by promoting the reuse of materials and minimizing the need for virgin plastic production.
One of the primary drivers of the recycled PET market is growing environmental awareness and concerns regarding plastic pollution. PET is a widely used material in packaging, textiles, and various consumer goods, but its disposal poses significant environmental challenges. Discarded PET products contribute to pollution in oceans, landfills, and ecosystems, harming wildlife and human health. Recycled PET offers a solution to mitigate these environmental impacts by reducing the demand for virgin PET, conserving resources, and diverting waste from landfills. The environmental benefits of recycled PET, including reduced energy consumption, greenhouse gas emissions, and resource depletion, drive its adoption by businesses, governments, and consumers alike.
Moreover, government regulations and policies play a crucial role in shaping the recycled PET market. Many countries have implemented legislation to address plastic waste and promote recycling. These regulations may include mandates for the use of recycled content in packaging, deposit-refund schemes, extended producer responsibility (EPR) programs, and bans or restrictions on single-use plastics. Furthermore, compliance with regulatory requirements incentivizes businesses to invest in recycling infrastructure, increase recycled content in their products, and adopt sustainable practices. Moreover, regulatory stability and enforcement ensure a level playing field for market participants and provide long-term certainty for investment in the recycled PET sector.
In addition, innovations in recycling technologies have significantly improved the efficiency, quality, and scalability of recycled PET processing. Advanced sorting, cleaning, and purification techniques enable the recycling of a broader range of PET waste streams, including post-consumer bottles, industrial scrap, and polyester textiles. Emerging technologies such as chemical recycling, depolymerization, and enzymatic degradation offer promising solutions to overcome the limitations of mechanical recycling and expand the scope of recycled PET applications. These technological advancements enhance the competitiveness and sustainability of recycled PET products, driving market growth and innovation.
However, regulatory frameworks play a crucial role in shaping the dynamics of the recycled PET market. However, inconsistent regulations, lack of enforcement, and varying standards across regions pose challenges for industry players operating in the recycled PET sector. Complex regulatory requirements related to food contact materials, product labeling, and quality standards create compliance burdens and increase operational costs for recycled PET manufacturers. Harmonizing regulations and establishing clear guidelines for recycled PET products can facilitate market growth and foster greater confidence among stakeholders.
On the contrary, the opportunities within the recycled PET market are vast and multifaceted, driven by environmental imperatives, regulatory mandates, and shift in consumer preferences. While challenges exist, including contamination issues, infrastructure limitations, and economic constraints, concerted efforts from stakeholders across the value chain can unlock the full potential of recycled PET. By investing in infrastructure development, technological innovation, product diversification, and collaborative initiatives, the recycled PET market can drive sustainable growth, create new economic opportunities, and contribute to a more circular and resource-efficient economy.
The recycled PET (rpET) market is segmented on the basis of type, source, application, and region. On the basis of source, the market is categorized into flakes and chips. By source, the market is divided into bottles & containers, and films & sheets. By application, the market is classified into packaging, fiber and textiles, sheets and thermoforming, construction materials, automotive parts, and others. Region-wise, the market is studied across North America, Europe, Asia-Pacific, and LAMEA.
The global recycled PET market profiles leading players that include Indorama Ventures Public Company Limited, Plastipak Holdings, Inc, Alpek SAB de CV, Clear Path Recycling, CarbonLite Industries, LLC, Evergreen Plastics, Phoenix Technologies International LLC, M&G Chemicals, Loop Industries, Inc., and Placon.
Other key players involved in the manufacturing of recycled PET includes Biffa, Far Eastern New Century Corporation, PolyQuest, OCTAL , and others. The global recycled PET market report provides in-depth competitive analysis as well as profiles of these major players.
Key Benefits For Stakeholders
- This report provides a quantitative analysis of the market segments, current trends, estimations, and dynamics of the recycled pet (rpet) market analysis from 2022 to 2032 to identify the prevailing recycled pet (rpet) market opportunities.
- The market research is offered along with information related to key drivers, restraints, and opportunities.
- Porter's five forces analysis highlights the potency of buyers and suppliers to enable stakeholders make profit-oriented business decisions and strengthen their supplier-buyer network.
- In-depth analysis of the recycled pet (rpet) market segmentation assists to determine the prevailing market opportunities.
- Major countries in each region are mapped according to their revenue contribution to the global market.
- Market player positioning facilitates benchmarking and provides a clear understanding of the present position of the market players.
- The report includes the analysis of the regional as well as global recycled pet (rpet) market trends, key players, market segments, application areas, and market growth strategies.
Additional benefits you will get with this purchase are:
- Quarterly Update and* (only available with a corporate license, on listed price)
- 5 additional Company Profile of client Choice pre- or Post-purchase, as a free update.
- Free Upcoming Version on the Purchase of Five and Enterprise User License.
- 16 analyst hours of support* (post-purchase, if you find additional data requirements upon review of the report, you may receive support amounting to 16 analyst hours to solve questions, and post-sale queries)
- 15% Free Customization* (in case the scope or segment of the report does not match your requirements, 15% is equivalent to 3 working days of free work, applicable once)
- Free data Pack on the Five and Enterprise User License. (Excel version of the report)
- Free Updated report if the report is 6-12 months old or older.
- 24-hour priority response*
- Free Industry updates and white papers.
Possible Customization with this report (with additional cost and timeline, please talk to the sales executive to know more)
- Analysis of raw material in a product (by %)
- Technology Trend Analysis
- Average Consumer Expenditure
- Patient/epidemiology data at country, region, global level
- Regulatory Guidelines
- Additional company profiles with specific to client's interest
- Additional country or region analysis- market size and forecast
- Average Selling Price Analysis / Price Point Analysis
- Expanded list for Company Profiles
- Historic market data
- Import Export Analysis/Data
- Key player details (including location, contact details, supplier/vendor network etc. in excel format)
- List of customers/consumers/raw material suppliers- value chain analysis
- Market share analysis of players at global/region/country level
- SWOT Analysis
- Volume Market Size and Forecast
Key Market Segments
By Application
- Packaging
- Fiber and Textiles
- Sheets and Thermoforming
- Construction Materials
- Automotive Parts
- Others
By Type
- Flakes
- Chips
By Source
- Bottles and Containers
- Films and Sheets
By Region
- North America
- U.S.
- Canada
- Mexico
- Europe
- Germany
- UK
- France
- Spain
- Italy
- Rest of Europe
- Asia-Pacific
- China
- India
- Japan
- South Korea
- Australia
- Rest of Asia-Pacific
- LAMEA
- Brazil
- Saudi Arabia
- South Africa
- Rest of LAMEA
Key Market Players:
- Indorama Ventures Public Company Limited
- PLASTIPAK HOLDINGS, INC.
- Alpek SAB de CV
- Clear Path Recycling, LLC
- CarbonLite Industries, LLC
- Evergreen Plastics
- Phoenix Technologies International LLC,
- M&G Chemicals
- Loop Industries, Inc.
- Placon
TABLE OF CONTENTS
CHAPTER 1: INTRODUCTION
- 1.1. Report description
- 1.2. Key market segments
- 1.3. Key benefits to the stakeholders
- 1.4. Research methodology
- 1.4.1. Primary research
- 1.4.2. Secondary research
- 1.4.3. Analyst tools and models
CHAPTER 2: EXECUTIVE SUMMARY
- 2.1. CXO perspective
CHAPTER 3: MARKET OVERVIEW
- 3.1. Market definition and scope
- 3.2. Key findings
- 3.2.1. Top impacting factors
- 3.2.2. Top investment pockets
- 3.3. Porter's five forces analysis
- 3.4. Market dynamics
- 3.4.1. Drivers
- 3.4.2. Restraints
- 3.4.3. Opportunities
- 3.5. Value Chain Analysis
- 3.6. Pricing Analysis
- 3.7. Key Regulation Analysis
- 3.8. Patent Landscape
CHAPTER 4: RECYCLED PET (RPET) MARKET, BY TYPE
- 4.1. Overview
- 4.1.1. Market size and forecast
- 4.2. Flakes
- 4.2.1. Key market trends, growth factors and opportunities
- 4.2.2. Market size and forecast, by region
- 4.2.3. Market share analysis by country
- 4.3. Chips
- 4.3.1. Key market trends, growth factors and opportunities
- 4.3.2. Market size and forecast, by region
- 4.3.3. Market share analysis by country
CHAPTER 5: RECYCLED PET (RPET) MARKET, BY SOURCE
- 5.1. Overview
- 5.1.1. Market size and forecast
- 5.2. Bottles and Containers
- 5.2.1. Key market trends, growth factors and opportunities
- 5.2.2. Market size and forecast, by region
- 5.2.3. Market share analysis by country
- 5.3. Films and Sheets
- 5.3.1. Key market trends, growth factors and opportunities
- 5.3.2. Market size and forecast, by region
- 5.3.3. Market share analysis by country
CHAPTER 6: RECYCLED PET (RPET) MARKET, BY APPLICATION
- 6.1. Overview
- 6.1.1. Market size and forecast
- 6.2. Packaging
- 6.2.1. Key market trends, growth factors and opportunities
- 6.2.2. Market size and forecast, by region
- 6.2.3. Market share analysis by country
- 6.3. Fiber and Textiles
- 6.3.1. Key market trends, growth factors and opportunities
- 6.3.2. Market size and forecast, by region
- 6.3.3. Market share analysis by country
- 6.4. Sheets and Thermoforming
- 6.4.1. Key market trends, growth factors and opportunities
- 6.4.2. Market size and forecast, by region
- 6.4.3. Market share analysis by country
- 6.5. Construction Materials
- 6.5.1. Key market trends, growth factors and opportunities
- 6.5.2. Market size and forecast, by region
- 6.5.3. Market share analysis by country
- 6.6. Automotive Parts
- 6.6.1. Key market trends, growth factors and opportunities
- 6.6.2. Market size and forecast, by region
- 6.6.3. Market share analysis by country
- 6.7. Others
- 6.7.1. Key market trends, growth factors and opportunities
- 6.7.2. Market size and forecast, by region
- 6.7.3. Market share analysis by country
CHAPTER 7: RECYCLED PET (RPET) MARKET, BY REGION
- 7.1. Overview
- 7.1.1. Market size and forecast By Region
- 7.2. North America
- 7.2.1. Key market trends, growth factors and opportunities
- 7.2.2. Market size and forecast, by Type
- 7.2.3. Market size and forecast, by Source
- 7.2.4. Market size and forecast, by Application
- 7.2.5. Market size and forecast, by country
- 7.2.5.1. U.S.
- 7.2.5.1.1. Market size and forecast, by Type
- 7.2.5.1.2. Market size and forecast, by Source
- 7.2.5.1.3. Market size and forecast, by Application
- 7.2.5.2. Canada
- 7.2.5.2.1. Market size and forecast, by Type
- 7.2.5.2.2. Market size and forecast, by Source
- 7.2.5.2.3. Market size and forecast, by Application
- 7.2.5.3. Mexico
- 7.2.5.3.1. Market size and forecast, by Type
- 7.2.5.3.2. Market size and forecast, by Source
- 7.2.5.3.3. Market size and forecast, by Application
- 7.3. Europe
- 7.3.1. Key market trends, growth factors and opportunities
- 7.3.2. Market size and forecast, by Type
- 7.3.3. Market size and forecast, by Source
- 7.3.4. Market size and forecast, by Application
- 7.3.5. Market size and forecast, by country
- 7.3.5.1. Germany
- 7.3.5.1.1. Market size and forecast, by Type
- 7.3.5.1.2. Market size and forecast, by Source
- 7.3.5.1.3. Market size and forecast, by Application
- 7.3.5.2. UK
- 7.3.5.2.1. Market size and forecast, by Type
- 7.3.5.2.2. Market size and forecast, by Source
- 7.3.5.2.3. Market size and forecast, by Application
- 7.3.5.3. France
- 7.3.5.3.1. Market size and forecast, by Type
- 7.3.5.3.2. Market size and forecast, by Source
- 7.3.5.3.3. Market size and forecast, by Application
- 7.3.5.4. Spain
- 7.3.5.4.1. Market size and forecast, by Type
- 7.3.5.4.2. Market size and forecast, by Source
- 7.3.5.4.3. Market size and forecast, by Application
- 7.3.5.5. Italy
- 7.3.5.5.1. Market size and forecast, by Type
- 7.3.5.5.2. Market size and forecast, by Source
- 7.3.5.5.3. Market size and forecast, by Application
- 7.3.5.6. Rest of Europe
- 7.3.5.6.1. Market size and forecast, by Type
- 7.3.5.6.2. Market size and forecast, by Source
- 7.3.5.6.3. Market size and forecast, by Application
- 7.4. Asia-Pacific
- 7.4.1. Key market trends, growth factors and opportunities
- 7.4.2. Market size and forecast, by Type
- 7.4.3. Market size and forecast, by Source
- 7.4.4. Market size and forecast, by Application
- 7.4.5. Market size and forecast, by country
- 7.4.5.1. China
- 7.4.5.1.1. Market size and forecast, by Type
- 7.4.5.1.2. Market size and forecast, by Source
- 7.4.5.1.3. Market size and forecast, by Application
- 7.4.5.2. India
- 7.4.5.2.1. Market size and forecast, by Type
- 7.4.5.2.2. Market size and forecast, by Source
- 7.4.5.2.3. Market size and forecast, by Application
- 7.4.5.3. Japan
- 7.4.5.3.1. Market size and forecast, by Type
- 7.4.5.3.2. Market size and forecast, by Source
- 7.4.5.3.3. Market size and forecast, by Application
- 7.4.5.4. South Korea
- 7.4.5.4.1. Market size and forecast, by Type
- 7.4.5.4.2. Market size and forecast, by Source
- 7.4.5.4.3. Market size and forecast, by Application
- 7.4.5.5. Australia
- 7.4.5.5.1. Market size and forecast, by Type
- 7.4.5.5.2. Market size and forecast, by Source
- 7.4.5.5.3. Market size and forecast, by Application
- 7.4.5.6. Rest of Asia-Pacific
- 7.4.5.6.1. Market size and forecast, by Type
- 7.4.5.6.2. Market size and forecast, by Source
- 7.4.5.6.3. Market size and forecast, by Application
- 7.5. LAMEA
- 7.5.1. Key market trends, growth factors and opportunities
- 7.5.2. Market size and forecast, by Type
- 7.5.3. Market size and forecast, by Source
- 7.5.4. Market size and forecast, by Application
- 7.5.5. Market size and forecast, by country
- 7.5.5.1. Brazil
- 7.5.5.1.1. Market size and forecast, by Type
- 7.5.5.1.2. Market size and forecast, by Source
- 7.5.5.1.3. Market size and forecast, by Application
- 7.5.5.2. Saudi Arabia
- 7.5.5.2.1. Market size and forecast, by Type
- 7.5.5.2.2. Market size and forecast, by Source
- 7.5.5.2.3. Market size and forecast, by Application
- 7.5.5.3. South Africa
- 7.5.5.3.1. Market size and forecast, by Type
- 7.5.5.3.2. Market size and forecast, by Source
- 7.5.5.3.3. Market size and forecast, by Application
- 7.5.5.4. Rest of LAMEA
- 7.5.5.4.1. Market size and forecast, by Type
- 7.5.5.4.2. Market size and forecast, by Source
- 7.5.5.4.3. Market size and forecast, by Application
CHAPTER 8: COMPETITIVE LANDSCAPE
- 8.1. Introduction
- 8.2. Top winning strategies
- 8.3. Product mapping of top 10 player
- 8.4. Competitive dashboard
- 8.5. Competitive heatmap
- 8.6. Top player positioning, 2022
CHAPTER 9: COMPANY PROFILES
- 9.1. Indorama Ventures Public Company Limited
- 9.1.1. Company overview
- 9.1.2. Key executives
- 9.1.3. Company snapshot
- 9.1.4. Operating business segments
- 9.1.5. Product portfolio
- 9.1.6. Business performance
- 9.1.7. Key strategic moves and developments
- 9.2. PLASTIPAK HOLDINGS, INC.
- 9.2.1. Company overview
- 9.2.2. Key executives
- 9.2.3. Company snapshot
- 9.2.4. Operating business segments
- 9.2.5. Product portfolio
- 9.2.6. Business performance
- 9.2.7. Key strategic moves and developments
- 9.3. Alpek SAB de CV
- 9.3.1. Company overview
- 9.3.2. Key executives
- 9.3.3. Company snapshot
- 9.3.4. Operating business segments
- 9.3.5. Product portfolio
- 9.3.6. Business performance
- 9.3.7. Key strategic moves and developments
- 9.4. Clear Path Recycling, LLC
- 9.4.1. Company overview
- 9.4.2. Key executives
- 9.4.3. Company snapshot
- 9.4.4. Operating business segments
- 9.4.5. Product portfolio
- 9.4.6. Business performance
- 9.4.7. Key strategic moves and developments
- 9.5. CarbonLite Industries, LLC
- 9.5.1. Company overview
- 9.5.2. Key executives
- 9.5.3. Company snapshot
- 9.5.4. Operating business segments
- 9.5.5. Product portfolio
- 9.5.6. Business performance
- 9.5.7. Key strategic moves and developments
- 9.6. Evergreen Plastics
- 9.6.1. Company overview
- 9.6.2. Key executives
- 9.6.3. Company snapshot
- 9.6.4. Operating business segments
- 9.6.5. Product portfolio
- 9.6.6. Business performance
- 9.6.7. Key strategic moves and developments
- 9.7. Phoenix Technologies International LLC,
- 9.7.1. Company overview
- 9.7.2. Key executives
- 9.7.3. Company snapshot
- 9.7.4. Operating business segments
- 9.7.5. Product portfolio
- 9.7.6. Business performance
- 9.7.7. Key strategic moves and developments
- 9.8. M&G Chemicals
- 9.8.1. Company overview
- 9.8.2. Key executives
- 9.8.3. Company snapshot
- 9.8.4. Operating business segments
- 9.8.5. Product portfolio
- 9.8.6. Business performance
- 9.8.7. Key strategic moves and developments
- 9.9. Loop Industries, Inc.
- 9.9.1. Company overview
- 9.9.2. Key executives
- 9.9.3. Company snapshot
- 9.9.4. Operating business segments
- 9.9.5. Product portfolio
- 9.9.6. Business performance
- 9.9.7. Key strategic moves and developments
- 9.10. Placon
- 9.10.1. Company overview
- 9.10.2. Key executives
- 9.10.3. Company snapshot
- 9.10.4. Operating business segments
- 9.10.5. Product portfolio
- 9.10.6. Business performance
- 9.10.7. Key strategic moves and developments
