
|
市場調査レポート
商品コード
1472273
抗炎症茶の世界市場:タイプ別、パッケージ別、流通チャネル別 - 機会分析と産業予測、2023~2032年Anti Inflammatory Tea Market By Type, By Packaging, By Distribution Channels : Global Opportunity Analysis and Industry Forecast, 2023-2032 |
||||||
|
|||||||

| 抗炎症茶の世界市場:タイプ別、パッケージ別、流通チャネル別 - 機会分析と産業予測、2023~2032年 |
|
出版日: 2024年02月01日
発行: Allied Market Research
ページ情報: 英文 300 Pages
納期: 2~3営業日
|

- 全表示
- 概要
- 図表
- 目次
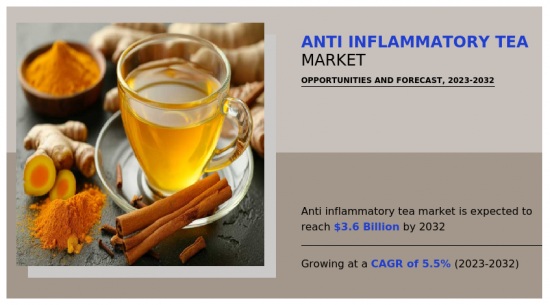
世界の抗炎症茶の市場規模は、2022年に21億1,510万米ドルに達し、2023~2032年にかけてCAGR 5.5%で成長し、2032年には35億9,240万米ドルに達すると予測されています。
抗炎症茶は、体内の炎症を抑え、全体的な健康とウェルネスを促進するために注意深く作られたハーブの輸液です。その成分には通常、生姜、ウコン、シナモン、緑茶など、抗炎症作用で有名な成分が含まれています。生姜には、強力な抗炎症作用と抗酸化作用で好まれるジンゲロールのような生理活性化合物があり、ウコンには、腫れや痛みを和らげることで知られる強力な抗炎症作用のあるクルクミンが含まれています。同様に、シナモンには抗酸化作用と抗炎症作用があり、炎症マーカーを低下させる可能性があります。一方、抗炎症作用で有名なポリフェノール、特にカテキンを含む緑茶は、炎症管理と免疫機能向上を助ける。これらの要素をバランスよくブレンドすることで、風味豊かで治療効果の高い混合物が得られ、関節炎、消化器系の病気、炎症による不快感など、さまざまな炎症状態に対処する自然療法として毎日の飲用に理想的であり、それによって健康的なライフスタイルが促進されます。
健康に役立つ機能性飲料への需要の高まりが、抗炎症茶市場の需要急増を促す主な要因となっています。消費者が健康とウェルネスを優先するにつれ、単なる水分補給以上の飲料を求めるようになっています。抗炎症茶は、多くの人にとって共通の健康上の懸念である炎症に対処するための自然で便利な方法を提供するため、この動向に完全に適合しています。機能性飲料に対するこのような需要は、消費者が全身の健康をサポートする製品を積極的に求める、予防ヘルスケアへの幅広いシフトを反映しています。
さらに、食生活の乱れやデスクワークの多いライフスタイルに起因する慢性炎症など、ライフスタイルに関連した健康問題の増加により、こうした懸念を和らげる飲料の需要が高まっています。抗炎症作用で知られるハーブや植物をブレンドした抗炎症茶は、積極的な健康管理を目指す消費者にアピールします。加えて、消費者が飲料の原材料にこだわるようになるにつれ、抗炎症茶に含まれる天然成分や植物由来成分に惹かれるようになり、市場の需要はさらに高まっています。
しかし、従来の医薬品や市販の鎮痛剤との競合が、抗炎症茶の市場需要を大きく抑制する要因となっています。多くの消費者が炎症や疼痛緩和の管理を従来の医薬品に頼っています。このように確立された市場プレゼンスが、特に迅速で強力な鎮痛効果を優先する消費者の間で、抗炎症茶ブランドが市場シェアを獲得することを困難にしています。
さらに、市販の鎮痛剤は抗炎症茶に比べ、より即効的で的を絞った解決策を提供することが多いです。このような利便性は、特に症状の迅速な緩和を求める消費者に、ハーブ療法を試すことを躊躇させる可能性があります。
さらに、ヘルスケア専門家との提携による推薦や流通は、抗炎症茶市場にとって貴重な機会となります。医師、栄養士、ホリスティック施術者などのヘルスケア専門家と提携することで、抗炎症茶ブランドに信頼性と権威を与えることができ、製品の有効性と安全性について消費者に信頼を与えることができます。信頼できるヘルスケア専門家による推薦は、抗炎症茶の健康効果について消費者を啓蒙し、これらの製品をウェルネスルーティンに取り入れるよう促すのに役立ちます。
さらに、ヘルスケア専門家とのコラボレーションは、クリニック、病院、ウェルネスセンターなどのヘルスケア環境への流通経路を促進することができます。抗炎症作用のあるお茶をヘルスケアに取り入れることで、ブランドは炎症に関連する問題の解決策を積極的に求めている多くの人々にリーチを広げることができます。この戦略的パートナーシップは製品の認知度を高めるだけでなく、抗炎症茶をヘルスケアの専門家が推奨するホリスティックな健康とウェルネスプランの不可欠な要素として位置づけることにもなります。
抗炎症茶市場は、タイプ、パッケージ、流通チャネル、地域に基づいて分析されます。タイプ別では、市場はターメリック、ジンジャー、緑茶、紅茶、カモミール、ペパーミント、レモングラス、シナモンに区分されます。パッケージ別では、ルースティー、板紙、アルミ缶、ティーバッグに分けられます。流通チャネル別では、スーパーマーケット・ハイパーマーケット、専門店、コンビニエンスストア、オンライン販売チャネル、その他に分類されます。地域別では、北米(米国、カナダ、メキシコ)、欧州(ドイツ、英国、フランス、イタリア、ロシア、その他の欧州)、アジア太平洋(中国、インド、日本、韓国、オーストラリア、その他のアジア太平洋)、中南米(ブラジル、コロンビア、アルゼンチン、その他のアジア太平洋)、中東・アフリカ(GCC、コロンビア、アルゼンチン、その他のアジア太平洋)で分析されます。
世界の抗炎症茶市場で事業を展開している主要企業は、The Hain Celestial Group、Tata Consumer Products、Dilmah Ceylon Tea Company、Bigelow Tea Company、Mountain Rose Herbs、Terra Teas Organic、Full Leaf Tea Co.、Davidson's Organics、ArtfulTea、Yogiです。
利害関係者にとっての主なメリット
- 当レポートは、2022~2032年までの抗炎症茶市場分析の市場セグメント、現在の動向、推定・動向分析、力学の定量的分析を提供し、優勢な抗炎症茶市場機会を特定します。
- 市場促進要因、市場抑制要因、市場機会に関連する情報とともに市場調査を提供します。
- ポーターのファイブフォース分析では、利害関係者が利益重視のビジネス決定を下し、サプライヤーとバイヤーのネットワークを強化できるように、バイヤーとサプライヤーの潜在力を強調します。
- 抗炎症茶市場のセグメンテーションを詳細に分析することで、市場機会を見極めることができます。
- 各地域の主要国は、世界市場への収益貢献度に応じてマッピングされています。
- 市場プレイヤーのポジショニングは、ベンチマーキングを容易にし、市場プレイヤーの現在のポジションの明確な理解を提供します。
- 本レポートには、地域および世界の抗炎症茶市場動向、主要企業、市場セグメント、応用分野、市場成長戦略の分析が含まれています。
- 消費者の購買行動分析
- エンドユーザーの嗜好とペインポイント
- 投資機会
- 製品ベンチマーク/製品仕様と用途
- 消費者の平均支出
- 消費者の嗜好と製品仕様
- ペインポイント分析
- クライアントの関心に特化した追加企業プロファイル
- 国別・地域別追加分析-市場規模と予測
- 企業プロファイルの拡張リスト
- 輸出入分析/データ
- 主要プレーヤーの詳細(所在地、連絡先、サプライヤー/ベンダーネットワークなどを含む、エクセル形式)
- 顧客/消費者/原料サプライヤーのリスト、バリューチェーン分析
- SWOT分析
目次
第1章 イントロダクション
第2章 エグゼクティブサマリー
第3章 市場概要
- 市場の定義と範囲
- 主な調査結果
- 影響要因
- 主な投資機会
- ポーターのファイブフォース分析
- 市場力学
- 促進要因
- 抑制要因
- 機会
第4章 抗炎症茶市場:タイプ別
- 概要
- ウコン
- 生姜
- 緑茶
- 紅茶
- カモミール
- ペパーミント
- レモングラス
- シナモン
第5章 抗炎症茶市場:パッケージ別
- 概要
- ルースティー
- 板紙
- アルミ缶
- ティーバッグ
第6章 抗炎症茶市場:流通チャネル別
- 概要
- スーパーマーケット/ハイパーマーケット
- 専門店
- コンビニエンスストア
- オンライン販売チャネル
- その他
第7章 抗炎症茶市場:地域別
- 概要
- 北米
- 米国
- カナダ
- メキシコ
- 欧州
- ドイツ
- 英国
- フランス
- イタリア
- ロシア
- その他の欧州
- アジア太平洋
- 中国
- インド
- 日本
- 韓国
- オーストラリア
- その他のアジア太平洋
- ラテンアメリカ
- ブラジル
- コロンビア
- アルゼンチン
- その他のラテンアメリカ
- 中東・アフリカ
- GCC
- 南アフリカ
- その他の中東・アフリカ
第8章 競争情勢
- イントロダクション
- 主要成功戦略
- 主要10社の製品マッピング
- 競合ダッシュボード
- 競合ヒートマップ
- 主要企業のポジショニング、2022年
第9章 企業プロファイル
- The Hain Celestial Group, Inc.
- Tata Consumer Products Limited
- Dilmah Ceylon Tea Company PLC
- Bigelow Tea Company
- Mountain Rose Herbs
- Terra Teas Organic
- Full Leaf Tea Co.
- Davidson's Organics
- ArtfulTea
- Yogi
LIST OF TABLES
- TABLE 01. GLOBAL ANTI INFLAMMATORY TEA MARKET, BY TYPE, 2022-2032 ($MILLION)
- TABLE 02. ANTI INFLAMMATORY TEA MARKET FOR TURMERIC, BY REGION, 2022-2032 ($MILLION)
- TABLE 03. ANTI INFLAMMATORY TEA MARKET FOR GINGER, BY REGION, 2022-2032 ($MILLION)
- TABLE 04. ANTI INFLAMMATORY TEA MARKET FOR GREEN TEA, BY REGION, 2022-2032 ($MILLION)
- TABLE 05. ANTI INFLAMMATORY TEA MARKET FOR BLACK TEA, BY REGION, 2022-2032 ($MILLION)
- TABLE 06. ANTI INFLAMMATORY TEA MARKET FOR CHAMOMILE, BY REGION, 2022-2032 ($MILLION)
- TABLE 07. ANTI INFLAMMATORY TEA MARKET FOR PEPPERMINT, BY REGION, 2022-2032 ($MILLION)
- TABLE 08. ANTI INFLAMMATORY TEA MARKET FOR LEMONGRASS, BY REGION, 2022-2032 ($MILLION)
- TABLE 09. ANTI INFLAMMATORY TEA MARKET FOR CINNAMON, BY REGION, 2022-2032 ($MILLION)
- TABLE 10. GLOBAL ANTI INFLAMMATORY TEA MARKET, BY PACKAGING, 2022-2032 ($MILLION)
- TABLE 11. ANTI INFLAMMATORY TEA MARKET FOR LOOSE TEA, BY REGION, 2022-2032 ($MILLION)
- TABLE 12. ANTI INFLAMMATORY TEA MARKET FOR PAPERBOARDS, BY REGION, 2022-2032 ($MILLION)
- TABLE 13. ANTI INFLAMMATORY TEA MARKET FOR ALUMINUM TINS, BY REGION, 2022-2032 ($MILLION)
- TABLE 14. ANTI INFLAMMATORY TEA MARKET FOR TEA BAGS, BY REGION, 2022-2032 ($MILLION)
- TABLE 15. GLOBAL ANTI INFLAMMATORY TEA MARKET, BY DISTRIBUTION CHANNELS, 2022-2032 ($MILLION)
- TABLE 16. ANTI INFLAMMATORY TEA MARKET FOR SUPERMARKET-HYPERMARKET, BY REGION, 2022-2032 ($MILLION)
- TABLE 17. ANTI INFLAMMATORY TEA MARKET FOR SPECIALTY STORES, BY REGION, 2022-2032 ($MILLION)
- TABLE 18. ANTI INFLAMMATORY TEA MARKET FOR CONVENIENCE STORES, BY REGION, 2022-2032 ($MILLION)
- TABLE 19. ANTI INFLAMMATORY TEA MARKET FOR ONLINE SALES CHANNEL, BY REGION, 2022-2032 ($MILLION)
- TABLE 20. ANTI INFLAMMATORY TEA MARKET FOR OTHERS, BY REGION, 2022-2032 ($MILLION)
- TABLE 21. ANTI INFLAMMATORY TEA MARKET, BY REGION, 2022-2032 ($MILLION)
- TABLE 22. NORTH AMERICA ANTI INFLAMMATORY TEA MARKET, BY TYPE, 2022-2032 ($MILLION)
- TABLE 23. NORTH AMERICA ANTI INFLAMMATORY TEA MARKET, BY PACKAGING, 2022-2032 ($MILLION)
- TABLE 24. NORTH AMERICA ANTI INFLAMMATORY TEA MARKET, BY DISTRIBUTION CHANNELS, 2022-2032 ($MILLION)
- TABLE 25. NORTH AMERICA ANTI INFLAMMATORY TEA MARKET, BY COUNTRY, 2022-2032 ($MILLION)
- TABLE 26. U.S. ANTI INFLAMMATORY TEA MARKET, BY TYPE, 2022-2032 ($MILLION)
- TABLE 27. U.S. ANTI INFLAMMATORY TEA MARKET, BY PACKAGING, 2022-2032 ($MILLION)
- TABLE 28. U.S. ANTI INFLAMMATORY TEA MARKET, BY DISTRIBUTION CHANNELS, 2022-2032 ($MILLION)
- TABLE 29. CANADA ANTI INFLAMMATORY TEA MARKET, BY TYPE, 2022-2032 ($MILLION)
- TABLE 30. CANADA ANTI INFLAMMATORY TEA MARKET, BY PACKAGING, 2022-2032 ($MILLION)
- TABLE 31. CANADA ANTI INFLAMMATORY TEA MARKET, BY DISTRIBUTION CHANNELS, 2022-2032 ($MILLION)
- TABLE 32. MEXICO ANTI INFLAMMATORY TEA MARKET, BY TYPE, 2022-2032 ($MILLION)
- TABLE 33. MEXICO ANTI INFLAMMATORY TEA MARKET, BY PACKAGING, 2022-2032 ($MILLION)
- TABLE 34. MEXICO ANTI INFLAMMATORY TEA MARKET, BY DISTRIBUTION CHANNELS, 2022-2032 ($MILLION)
- TABLE 35. EUROPE ANTI INFLAMMATORY TEA MARKET, BY TYPE, 2022-2032 ($MILLION)
- TABLE 36. EUROPE ANTI INFLAMMATORY TEA MARKET, BY PACKAGING, 2022-2032 ($MILLION)
- TABLE 37. EUROPE ANTI INFLAMMATORY TEA MARKET, BY DISTRIBUTION CHANNELS, 2022-2032 ($MILLION)
- TABLE 38. EUROPE ANTI INFLAMMATORY TEA MARKET, BY COUNTRY, 2022-2032 ($MILLION)
- TABLE 39. GERMANY ANTI INFLAMMATORY TEA MARKET, BY TYPE, 2022-2032 ($MILLION)
- TABLE 40. GERMANY ANTI INFLAMMATORY TEA MARKET, BY PACKAGING, 2022-2032 ($MILLION)
- TABLE 41. GERMANY ANTI INFLAMMATORY TEA MARKET, BY DISTRIBUTION CHANNELS, 2022-2032 ($MILLION)
- TABLE 42. UK ANTI INFLAMMATORY TEA MARKET, BY TYPE, 2022-2032 ($MILLION)
- TABLE 43. UK ANTI INFLAMMATORY TEA MARKET, BY PACKAGING, 2022-2032 ($MILLION)
- TABLE 44. UK ANTI INFLAMMATORY TEA MARKET, BY DISTRIBUTION CHANNELS, 2022-2032 ($MILLION)
- TABLE 45. FRANCE ANTI INFLAMMATORY TEA MARKET, BY TYPE, 2022-2032 ($MILLION)
- TABLE 46. FRANCE ANTI INFLAMMATORY TEA MARKET, BY PACKAGING, 2022-2032 ($MILLION)
- TABLE 47. FRANCE ANTI INFLAMMATORY TEA MARKET, BY DISTRIBUTION CHANNELS, 2022-2032 ($MILLION)
- TABLE 48. ITALY ANTI INFLAMMATORY TEA MARKET, BY TYPE, 2022-2032 ($MILLION)
- TABLE 49. ITALY ANTI INFLAMMATORY TEA MARKET, BY PACKAGING, 2022-2032 ($MILLION)
- TABLE 50. ITALY ANTI INFLAMMATORY TEA MARKET, BY DISTRIBUTION CHANNELS, 2022-2032 ($MILLION)
- TABLE 51. RUSSIA ANTI INFLAMMATORY TEA MARKET, BY TYPE, 2022-2032 ($MILLION)
- TABLE 52. RUSSIA ANTI INFLAMMATORY TEA MARKET, BY PACKAGING, 2022-2032 ($MILLION)
- TABLE 53. RUSSIA ANTI INFLAMMATORY TEA MARKET, BY DISTRIBUTION CHANNELS, 2022-2032 ($MILLION)
- TABLE 54. REST OF EUROPE ANTI INFLAMMATORY TEA MARKET, BY TYPE, 2022-2032 ($MILLION)
- TABLE 55. REST OF EUROPE ANTI INFLAMMATORY TEA MARKET, BY PACKAGING, 2022-2032 ($MILLION)
- TABLE 56. REST OF EUROPE ANTI INFLAMMATORY TEA MARKET, BY DISTRIBUTION CHANNELS, 2022-2032 ($MILLION)
- TABLE 57. ASIA-PACIFIC ANTI INFLAMMATORY TEA MARKET, BY TYPE, 2022-2032 ($MILLION)
- TABLE 58. ASIA-PACIFIC ANTI INFLAMMATORY TEA MARKET, BY PACKAGING, 2022-2032 ($MILLION)
- TABLE 59. ASIA-PACIFIC ANTI INFLAMMATORY TEA MARKET, BY DISTRIBUTION CHANNELS, 2022-2032 ($MILLION)
- TABLE 60. ASIA-PACIFIC ANTI INFLAMMATORY TEA MARKET, BY COUNTRY, 2022-2032 ($MILLION)
- TABLE 61. CHINA ANTI INFLAMMATORY TEA MARKET, BY TYPE, 2022-2032 ($MILLION)
- TABLE 62. CHINA ANTI INFLAMMATORY TEA MARKET, BY PACKAGING, 2022-2032 ($MILLION)
- TABLE 63. CHINA ANTI INFLAMMATORY TEA MARKET, BY DISTRIBUTION CHANNELS, 2022-2032 ($MILLION)
- TABLE 64. INDIA ANTI INFLAMMATORY TEA MARKET, BY TYPE, 2022-2032 ($MILLION)
- TABLE 65. INDIA ANTI INFLAMMATORY TEA MARKET, BY PACKAGING, 2022-2032 ($MILLION)
- TABLE 66. INDIA ANTI INFLAMMATORY TEA MARKET, BY DISTRIBUTION CHANNELS, 2022-2032 ($MILLION)
- TABLE 67. JAPAN ANTI INFLAMMATORY TEA MARKET, BY TYPE, 2022-2032 ($MILLION)
- TABLE 68. JAPAN ANTI INFLAMMATORY TEA MARKET, BY PACKAGING, 2022-2032 ($MILLION)
- TABLE 69. JAPAN ANTI INFLAMMATORY TEA MARKET, BY DISTRIBUTION CHANNELS, 2022-2032 ($MILLION)
- TABLE 70. SOUTH KOREA ANTI INFLAMMATORY TEA MARKET, BY TYPE, 2022-2032 ($MILLION)
- TABLE 71. SOUTH KOREA ANTI INFLAMMATORY TEA MARKET, BY PACKAGING, 2022-2032 ($MILLION)
- TABLE 72. SOUTH KOREA ANTI INFLAMMATORY TEA MARKET, BY DISTRIBUTION CHANNELS, 2022-2032 ($MILLION)
- TABLE 73. AUSTRALIA ANTI INFLAMMATORY TEA MARKET, BY TYPE, 2022-2032 ($MILLION)
- TABLE 74. AUSTRALIA ANTI INFLAMMATORY TEA MARKET, BY PACKAGING, 2022-2032 ($MILLION)
- TABLE 75. AUSTRALIA ANTI INFLAMMATORY TEA MARKET, BY DISTRIBUTION CHANNELS, 2022-2032 ($MILLION)
- TABLE 76. REST OF ASIA-PACIFIC ANTI INFLAMMATORY TEA MARKET, BY TYPE, 2022-2032 ($MILLION)
- TABLE 77. REST OF ASIA-PACIFIC ANTI INFLAMMATORY TEA MARKET, BY PACKAGING, 2022-2032 ($MILLION)
- TABLE 78. REST OF ASIA-PACIFIC ANTI INFLAMMATORY TEA MARKET, BY DISTRIBUTION CHANNELS, 2022-2032 ($MILLION)
- TABLE 79. LATIN AMERICA ANTI INFLAMMATORY TEA MARKET, BY TYPE, 2022-2032 ($MILLION)
- TABLE 80. LATIN AMERICA ANTI INFLAMMATORY TEA MARKET, BY PACKAGING, 2022-2032 ($MILLION)
- TABLE 81. LATIN AMERICA ANTI INFLAMMATORY TEA MARKET, BY DISTRIBUTION CHANNELS, 2022-2032 ($MILLION)
- TABLE 82. LATIN AMERICA ANTI INFLAMMATORY TEA MARKET, BY COUNTRY, 2022-2032 ($MILLION)
- TABLE 83. BRAZIL ANTI INFLAMMATORY TEA MARKET, BY TYPE, 2022-2032 ($MILLION)
- TABLE 84. BRAZIL ANTI INFLAMMATORY TEA MARKET, BY PACKAGING, 2022-2032 ($MILLION)
- TABLE 85. BRAZIL ANTI INFLAMMATORY TEA MARKET, BY DISTRIBUTION CHANNELS, 2022-2032 ($MILLION)
- TABLE 86. COLOMBIA ANTI INFLAMMATORY TEA MARKET, BY TYPE, 2022-2032 ($MILLION)
- TABLE 87. COLOMBIA ANTI INFLAMMATORY TEA MARKET, BY PACKAGING, 2022-2032 ($MILLION)
- TABLE 88. COLOMBIA ANTI INFLAMMATORY TEA MARKET, BY DISTRIBUTION CHANNELS, 2022-2032 ($MILLION)
- TABLE 89. ARGENTINA ANTI INFLAMMATORY TEA MARKET, BY TYPE, 2022-2032 ($MILLION)
- TABLE 90. ARGENTINA ANTI INFLAMMATORY TEA MARKET, BY PACKAGING, 2022-2032 ($MILLION)
- TABLE 91. ARGENTINA ANTI INFLAMMATORY TEA MARKET, BY DISTRIBUTION CHANNELS, 2022-2032 ($MILLION)
- TABLE 92. REST OF LATIN AMERICA ANTI INFLAMMATORY TEA MARKET, BY TYPE, 2022-2032 ($MILLION)
- TABLE 93. REST OF LATIN AMERICA ANTI INFLAMMATORY TEA MARKET, BY PACKAGING, 2022-2032 ($MILLION)
- TABLE 94. REST OF LATIN AMERICA ANTI INFLAMMATORY TEA MARKET, BY DISTRIBUTION CHANNELS, 2022-2032 ($MILLION)
- TABLE 95. MIDDLE EAST AND AFRICA ANTI INFLAMMATORY TEA MARKET, BY TYPE, 2022-2032 ($MILLION)
- TABLE 96. MIDDLE EAST AND AFRICA ANTI INFLAMMATORY TEA MARKET, BY PACKAGING, 2022-2032 ($MILLION)
- TABLE 97. MIDDLE EAST AND AFRICA ANTI INFLAMMATORY TEA MARKET, BY DISTRIBUTION CHANNELS, 2022-2032 ($MILLION)
- TABLE 98. MIDDLE EAST AND AFRICA ANTI INFLAMMATORY TEA MARKET, BY COUNTRY, 2022-2032 ($MILLION)
- TABLE 99. GCC ANTI INFLAMMATORY TEA MARKET, BY TYPE, 2022-2032 ($MILLION)
- TABLE 100. GCC ANTI INFLAMMATORY TEA MARKET, BY PACKAGING, 2022-2032 ($MILLION)
- TABLE 101. GCC ANTI INFLAMMATORY TEA MARKET, BY DISTRIBUTION CHANNELS, 2022-2032 ($MILLION)
- TABLE 102. SOUTH AFRICA ANTI INFLAMMATORY TEA MARKET, BY TYPE, 2022-2032 ($MILLION)
- TABLE 103. SOUTH AFRICA ANTI INFLAMMATORY TEA MARKET, BY PACKAGING, 2022-2032 ($MILLION)
- TABLE 104. SOUTH AFRICA ANTI INFLAMMATORY TEA MARKET, BY DISTRIBUTION CHANNELS, 2022-2032 ($MILLION)
- TABLE 105. REST OF MEA ANTI INFLAMMATORY TEA MARKET, BY TYPE, 2022-2032 ($MILLION)
- TABLE 106. REST OF MEA ANTI INFLAMMATORY TEA MARKET, BY PACKAGING, 2022-2032 ($MILLION)
- TABLE 107. REST OF MEA ANTI INFLAMMATORY TEA MARKET, BY DISTRIBUTION CHANNELS, 2022-2032 ($MILLION)
- TABLE 108. THE HAIN CELESTIAL GROUP, INC.: KEY EXECUTIVES
- TABLE 109. THE HAIN CELESTIAL GROUP, INC.: COMPANY SNAPSHOT
- TABLE 110. THE HAIN CELESTIAL GROUP, INC.: PRODUCT SEGMENTS
- TABLE 111. THE HAIN CELESTIAL GROUP, INC.: SERVICE SEGMENTS
- TABLE 112. THE HAIN CELESTIAL GROUP, INC.: PRODUCT PORTFOLIO
- TABLE 113. THE HAIN CELESTIAL GROUP, INC.: KEY STRATERGIES
- TABLE 114. TATA CONSUMER PRODUCTS LIMITED: KEY EXECUTIVES
- TABLE 115. TATA CONSUMER PRODUCTS LIMITED: COMPANY SNAPSHOT
- TABLE 116. TATA CONSUMER PRODUCTS LIMITED: PRODUCT SEGMENTS
- TABLE 117. TATA CONSUMER PRODUCTS LIMITED: SERVICE SEGMENTS
- TABLE 118. TATA CONSUMER PRODUCTS LIMITED: PRODUCT PORTFOLIO
- TABLE 119. TATA CONSUMER PRODUCTS LIMITED: KEY STRATERGIES
- TABLE 120. DILMAH CEYLON TEA COMPANY PLC: KEY EXECUTIVES
- TABLE 121. DILMAH CEYLON TEA COMPANY PLC: COMPANY SNAPSHOT
- TABLE 122. DILMAH CEYLON TEA COMPANY PLC: PRODUCT SEGMENTS
- TABLE 123. DILMAH CEYLON TEA COMPANY PLC: SERVICE SEGMENTS
- TABLE 124. DILMAH CEYLON TEA COMPANY PLC: PRODUCT PORTFOLIO
- TABLE 125. DILMAH CEYLON TEA COMPANY PLC: KEY STRATERGIES
- TABLE 126. BIGELOW TEA COMPANY: KEY EXECUTIVES
- TABLE 127. BIGELOW TEA COMPANY: COMPANY SNAPSHOT
- TABLE 128. BIGELOW TEA COMPANY: PRODUCT SEGMENTS
- TABLE 129. BIGELOW TEA COMPANY: SERVICE SEGMENTS
- TABLE 130. BIGELOW TEA COMPANY: PRODUCT PORTFOLIO
- TABLE 131. BIGELOW TEA COMPANY: KEY STRATERGIES
- TABLE 132. MOUNTAIN ROSE HERBS: KEY EXECUTIVES
- TABLE 133. MOUNTAIN ROSE HERBS: COMPANY SNAPSHOT
- TABLE 134. MOUNTAIN ROSE HERBS: PRODUCT SEGMENTS
- TABLE 135. MOUNTAIN ROSE HERBS: SERVICE SEGMENTS
- TABLE 136. MOUNTAIN ROSE HERBS: PRODUCT PORTFOLIO
- TABLE 137. MOUNTAIN ROSE HERBS: KEY STRATERGIES
- TABLE 138. TERRA TEAS ORGANIC: KEY EXECUTIVES
- TABLE 139. TERRA TEAS ORGANIC: COMPANY SNAPSHOT
- TABLE 140. TERRA TEAS ORGANIC: PRODUCT SEGMENTS
- TABLE 141. TERRA TEAS ORGANIC: SERVICE SEGMENTS
- TABLE 142. TERRA TEAS ORGANIC: PRODUCT PORTFOLIO
- TABLE 143. TERRA TEAS ORGANIC: KEY STRATERGIES
- TABLE 144. FULL LEAF TEA CO.: KEY EXECUTIVES
- TABLE 145. FULL LEAF TEA CO.: COMPANY SNAPSHOT
- TABLE 146. FULL LEAF TEA CO.: PRODUCT SEGMENTS
- TABLE 147. FULL LEAF TEA CO.: SERVICE SEGMENTS
- TABLE 148. FULL LEAF TEA CO.: PRODUCT PORTFOLIO
- TABLE 149. FULL LEAF TEA CO.: KEY STRATERGIES
- TABLE 150. DAVIDSON'S ORGANICS: KEY EXECUTIVES
- TABLE 151. DAVIDSON'S ORGANICS: COMPANY SNAPSHOT
- TABLE 152. DAVIDSON'S ORGANICS: PRODUCT SEGMENTS
- TABLE 153. DAVIDSON'S ORGANICS: SERVICE SEGMENTS
- TABLE 154. DAVIDSON'S ORGANICS: PRODUCT PORTFOLIO
- TABLE 155. DAVIDSON'S ORGANICS: KEY STRATERGIES
- TABLE 156. ARTFULTEA: KEY EXECUTIVES
- TABLE 157. ARTFULTEA: COMPANY SNAPSHOT
- TABLE 158. ARTFULTEA: PRODUCT SEGMENTS
- TABLE 159. ARTFULTEA: SERVICE SEGMENTS
- TABLE 160. ARTFULTEA: PRODUCT PORTFOLIO
- TABLE 161. ARTFULTEA: KEY STRATERGIES
- TABLE 162. YOGI: KEY EXECUTIVES
- TABLE 163. YOGI: COMPANY SNAPSHOT
- TABLE 164. YOGI: PRODUCT SEGMENTS
- TABLE 165. YOGI: SERVICE SEGMENTS
- TABLE 166. YOGI: PRODUCT PORTFOLIO
- TABLE 167. YOGI: KEY STRATERGIES
LIST OF FIGURES
- FIGURE 01. ANTI INFLAMMATORY TEA MARKET, 2022-2032
- FIGURE 02. SEGMENTATION OF ANTI INFLAMMATORY TEA MARKET,2022-2032
- FIGURE 03. TOP IMPACTING FACTORS IN ANTI INFLAMMATORY TEA MARKET
- FIGURE 04. TOP INVESTMENT POCKETS IN ANTI INFLAMMATORY TEA MARKET (2023-2032)
- FIGURE 05. BARGAINING POWER OF SUPPLIERS
- FIGURE 06. BARGAINING POWER OF BUYERS
- FIGURE 07. THREAT OF SUBSTITUTION
- FIGURE 08. THREAT OF SUBSTITUTION
- FIGURE 09. COMPETITIVE RIVALRY
- FIGURE 10. GLOBAL ANTI INFLAMMATORY TEA MARKET:DRIVERS, RESTRAINTS AND OPPORTUNITIES
- FIGURE 11. ANTI INFLAMMATORY TEA MARKET, BY TYPE, 2022 AND 2032(%)
- FIGURE 12. COMPARATIVE SHARE ANALYSIS OF ANTI INFLAMMATORY TEA MARKET FOR TURMERIC, BY COUNTRY 2022 AND 2032(%)
- FIGURE 13. COMPARATIVE SHARE ANALYSIS OF ANTI INFLAMMATORY TEA MARKET FOR GINGER, BY COUNTRY 2022 AND 2032(%)
- FIGURE 14. COMPARATIVE SHARE ANALYSIS OF ANTI INFLAMMATORY TEA MARKET FOR GREEN TEA, BY COUNTRY 2022 AND 2032(%)
- FIGURE 15. COMPARATIVE SHARE ANALYSIS OF ANTI INFLAMMATORY TEA MARKET FOR BLACK TEA, BY COUNTRY 2022 AND 2032(%)
- FIGURE 16. COMPARATIVE SHARE ANALYSIS OF ANTI INFLAMMATORY TEA MARKET FOR CHAMOMILE, BY COUNTRY 2022 AND 2032(%)
- FIGURE 17. COMPARATIVE SHARE ANALYSIS OF ANTI INFLAMMATORY TEA MARKET FOR PEPPERMINT, BY COUNTRY 2022 AND 2032(%)
- FIGURE 18. COMPARATIVE SHARE ANALYSIS OF ANTI INFLAMMATORY TEA MARKET FOR LEMONGRASS, BY COUNTRY 2022 AND 2032(%)
- FIGURE 19. COMPARATIVE SHARE ANALYSIS OF ANTI INFLAMMATORY TEA MARKET FOR CINNAMON, BY COUNTRY 2022 AND 2032(%)
- FIGURE 20. ANTI INFLAMMATORY TEA MARKET, BY PACKAGING, 2022 AND 2032(%)
- FIGURE 21. COMPARATIVE SHARE ANALYSIS OF ANTI INFLAMMATORY TEA MARKET FOR LOOSE TEA, BY COUNTRY 2022 AND 2032(%)
- FIGURE 22. COMPARATIVE SHARE ANALYSIS OF ANTI INFLAMMATORY TEA MARKET FOR PAPERBOARDS, BY COUNTRY 2022 AND 2032(%)
- FIGURE 23. COMPARATIVE SHARE ANALYSIS OF ANTI INFLAMMATORY TEA MARKET FOR ALUMINUM TINS, BY COUNTRY 2022 AND 2032(%)
- FIGURE 24. COMPARATIVE SHARE ANALYSIS OF ANTI INFLAMMATORY TEA MARKET FOR TEA BAGS, BY COUNTRY 2022 AND 2032(%)
- FIGURE 25. ANTI INFLAMMATORY TEA MARKET, BY DISTRIBUTION CHANNELS, 2022 AND 2032(%)
- FIGURE 26. COMPARATIVE SHARE ANALYSIS OF ANTI INFLAMMATORY TEA MARKET FOR SUPERMARKET-HYPERMARKET, BY COUNTRY 2022 AND 2032(%)
- FIGURE 27. COMPARATIVE SHARE ANALYSIS OF ANTI INFLAMMATORY TEA MARKET FOR SPECIALTY STORES, BY COUNTRY 2022 AND 2032(%)
- FIGURE 28. COMPARATIVE SHARE ANALYSIS OF ANTI INFLAMMATORY TEA MARKET FOR CONVENIENCE STORES, BY COUNTRY 2022 AND 2032(%)
- FIGURE 29. COMPARATIVE SHARE ANALYSIS OF ANTI INFLAMMATORY TEA MARKET FOR ONLINE SALES CHANNEL, BY COUNTRY 2022 AND 2032(%)
- FIGURE 30. COMPARATIVE SHARE ANALYSIS OF ANTI INFLAMMATORY TEA MARKET FOR OTHERS, BY COUNTRY 2022 AND 2032(%)
- FIGURE 31. ANTI INFLAMMATORY TEA MARKET BY REGION, 2022 AND 2032(%)
- FIGURE 32. U.S. ANTI INFLAMMATORY TEA MARKET, 2022-2032 ($MILLION)
- FIGURE 33. CANADA ANTI INFLAMMATORY TEA MARKET, 2022-2032 ($MILLION)
- FIGURE 34. MEXICO ANTI INFLAMMATORY TEA MARKET, 2022-2032 ($MILLION)
- FIGURE 35. GERMANY ANTI INFLAMMATORY TEA MARKET, 2022-2032 ($MILLION)
- FIGURE 36. UK ANTI INFLAMMATORY TEA MARKET, 2022-2032 ($MILLION)
- FIGURE 37. FRANCE ANTI INFLAMMATORY TEA MARKET, 2022-2032 ($MILLION)
- FIGURE 38. ITALY ANTI INFLAMMATORY TEA MARKET, 2022-2032 ($MILLION)
- FIGURE 39. RUSSIA ANTI INFLAMMATORY TEA MARKET, 2022-2032 ($MILLION)
- FIGURE 40. REST OF EUROPE ANTI INFLAMMATORY TEA MARKET, 2022-2032 ($MILLION)
- FIGURE 41. CHINA ANTI INFLAMMATORY TEA MARKET, 2022-2032 ($MILLION)
- FIGURE 42. INDIA ANTI INFLAMMATORY TEA MARKET, 2022-2032 ($MILLION)
- FIGURE 43. JAPAN ANTI INFLAMMATORY TEA MARKET, 2022-2032 ($MILLION)
- FIGURE 44. SOUTH KOREA ANTI INFLAMMATORY TEA MARKET, 2022-2032 ($MILLION)
- FIGURE 45. AUSTRALIA ANTI INFLAMMATORY TEA MARKET, 2022-2032 ($MILLION)
- FIGURE 46. REST OF ASIA-PACIFIC ANTI INFLAMMATORY TEA MARKET, 2022-2032 ($MILLION)
- FIGURE 47. BRAZIL ANTI INFLAMMATORY TEA MARKET, 2022-2032 ($MILLION)
- FIGURE 48. COLOMBIA ANTI INFLAMMATORY TEA MARKET, 2022-2032 ($MILLION)
- FIGURE 49. ARGENTINA ANTI INFLAMMATORY TEA MARKET, 2022-2032 ($MILLION)
- FIGURE 50. REST OF LATIN AMERICA ANTI INFLAMMATORY TEA MARKET, 2022-2032 ($MILLION)
- FIGURE 51. GCC ANTI INFLAMMATORY TEA MARKET, 2022-2032 ($MILLION)
- FIGURE 52. SOUTH AFRICA ANTI INFLAMMATORY TEA MARKET, 2022-2032 ($MILLION)
- FIGURE 53. REST OF MEA ANTI INFLAMMATORY TEA MARKET, 2022-2032 ($MILLION)
- FIGURE 54. TOP WINNING STRATEGIES, BY YEAR
- FIGURE 55. TOP WINNING STRATEGIES, BY DEVELOPMENT
- FIGURE 56. TOP WINNING STRATEGIES, BY COMPANY
- FIGURE 57. PRODUCT MAPPING OF TOP 10 PLAYERS
- FIGURE 58. COMPETITIVE DASHBOARD
- FIGURE 59. COMPETITIVE HEATMAP: ANTI INFLAMMATORY TEA MARKET
- FIGURE 60. TOP PLAYER POSITIONING, 2022
The global anti-inflammatory tea market was valued at $2,115.1 million in 2022, and is projected to reach $3,592.4 million by 2032, registering a CAGR of 5.5% from 2023 to 2032.
Anti-inflammatory tea is an herbal infusion carefully crafted to reduce inflammation within the body, thereby fostering overall health and wellness. Its composition typically includes ingredients renowned for their anti-inflammatory properties, such as ginger, turmeric, cinnamon, and green tea. Ginger has bioactive compounds like gingerol, preferred for their potent anti-inflammatory and antioxidant effects, while turmeric harbors curcumin, a powerful anti-inflammatory agent known to mitigate swelling and pain. Similarly, cinnamon has antioxidants and anti-inflammatory properties, which have the potential to reduce inflammation markers. Meanwhile, green tea packed with polyphenols, notably catechins, renowned for their anti-inflammatory properties, aids in inflammation management and immune function enhancement. The balanced blending of these elements yields a flavorsome and therapeutic mixture, ideal for daily consumption as a natural remedy to address various inflammatory conditions, such as arthritis, digestive ailments, and inflammation-induced discomfort, thereby promoting a healthier lifestyle.
The increasing demand for functional beverages with health benefits is a key factor driving the surge in the market demand for anti-inflammatory tea. As consumers prioritize health and wellness, they are seeking beverages that offer more than just hydration-they want products that provide tangible health benefits. Anti-inflammatory tea fits perfectly into this trend as it offers a natural and convenient way to address inflammation, a common health concern for many individuals. This demand for functional beverages reflects a broader shift toward preventive healthcare, where consumers actively seek products that support their overall well-being.
Furthermore, the rise of lifestyle-related health issues, such as chronic inflammation stemming from poor dietary choices and desk-bound lifestyles, has increased the demand for beverages that can help mitigate these concerns. Anti-inflammatory tea, with its blend of herbs and botanicals known for their anti-inflammatory properties, appeals to consumers looking to proactively manage their health. Additionally, as consumers become more discerning about the ingredients in their beverages, they are drawn to the natural and plant-based ingredients found in anti-inflammatory teas, further fueling market demand.
However, the competition from conventional pharmaceuticals and over-the-counter pain relievers presents a significant restraint on the market demand for anti-inflammatory tea. Many consumers still rely on traditional medications for managing inflammation and pain relief, often due to perceived efficacy and trust in established pharmaceutical brands. This established market presence makes it challenging for anti-inflammatory tea brands to capture market share, especially among consumers who prioritize quick and potent relief.
Moreover, over-the-counter pain relievers often offer a more immediate and targeted solution compared to anti-inflammatory teas, which may require regular consumption over time to see noticeable effects. This convenience factor can warn consumers from exploring herbal remedies, particularly if they seek rapid relief from symptoms.
Additionally, collaborations with healthcare professionals for endorsement and distribution present valuable opportunities for the anti-inflammatory tea market. Partnering with healthcare professionals such as physicians, nutritionists, and holistic practitioners can lend credibility and authority to anti-inflammatory tea brands, instilling confidence in consumers about the efficacy and safety of their products. Endorsements from trusted healthcare professionals can help educate consumers about the health benefits of anti-inflammatory teas and encourage them to incorporate these products into their wellness routines.
Furthermore, collaborations with healthcare professionals can facilitate distribution channels into healthcare settings such as clinics, hospitals, and wellness centers. By integrating anti-inflammatory teas into healthcare practices, brands can expand their reach to a captive audience actively seeking solutions for inflammation-related issues. This strategic partnership not only increases product visibility but also positions anti-inflammatory teas as integral components of holistic health and wellness plans endorsed by healthcare experts.
The anti-inflammatory tea market is analyzed on the basis of type, packaging, distribution channel, and region. By type, the market is segmented into turmeric, ginger, green tea, black tea, chamomile, peppermint, lemongrass, and cinnamon. By packaging, the market is divided into loose tea, paperboards, aluminum tins, and tea bags. Depending on distribution channel, it is classified into supermarket-hypermarket, specialty stores, convenience stores, online sales channels, and others. Region-wise, the market is analyzed across North America (the U.S., Canada, and Mexico), Europe (Germany, the UK, France, Italy, Russia, and the rest of Europe), Asia-Pacific (China, India, Japan, South Korea, Australia, and the rest of Asia-Pacific), Latin America (Brazil, Colombia, Argentina, and the rest of Latin America), and Middle East and Africa (GCC, South Africa, and the rest of MEA).
The major players operating in the global anti-inflammatory tea market are The Hain Celestial Group, Tata Consumer Products, Dilmah Ceylon Tea Company, Bigelow Tea Company, Mountain Rose Herbs, Terra Teas Organic, Full Leaf Tea Co., Davidson's Organics, ArtfulTea, and Yogi.
Key Benefits For Stakeholders
- This report provides a quantitative analysis of the market segments, current trends, estimations, and dynamics of the anti inflammatory tea market analysis from 2022 to 2032 to identify the prevailing anti inflammatory tea market opportunities.
- The market research is offered along with information related to key drivers, restraints, and opportunities.
- Porter's five forces analysis highlights the potency of buyers and suppliers to enable stakeholders make profit-oriented business decisions and strengthen their supplier-buyer network.
- In-depth analysis of the anti inflammatory tea market segmentation assists to determine the prevailing market opportunities.
- Major countries in each region are mapped according to their revenue contribution to the global market.
- Market player positioning facilitates benchmarking and provides a clear understanding of the present position of the market players.
- The report includes the analysis of the regional as well as global anti inflammatory tea market trends, key players, market segments, application areas, and market growth strategies.
Additional benefits you will get with this purchase are:
- Quarterly Update and* (only available with a corporate license, on listed price)
- 5 additional Company Profile of client Choice pre- or Post-purchase, as a free update.
- Free Upcoming Version on the Purchase of Five and Enterprise User License.
- 16 analyst hours of support* (post-purchase, if you find additional data requirements upon review of the report, you may receive support amounting to 16 analyst hours to solve questions, and post-sale queries)
- 15% Free Customization* (in case the scope or segment of the report does not match your requirements, 15% is equivalent to 3 working days of free work, applicable once)
- Free data Pack on the Five and Enterprise User License. (Excel version of the report)
- Free Updated report if the report is 6-12 months old or older.
- 24-hour priority response*
- Free Industry updates and white papers.
Possible Customization with this report (with additional cost and timeline, please talk to the sales executive to know more)
- Consumer Buying Behavior Analysis
- End user preferences and pain points
- Investment Opportunities
- Product Benchmarking / Product specification and applications
- Average Consumer Expenditure
- Consumer Preference and Product Specifications
- Pain Point Analysis
- Additional company profiles with specific to client's interest
- Additional country or region analysis- market size and forecast
- Expanded list for Company Profiles
- Import Export Analysis/Data
- Key player details (including location, contact details, supplier/vendor network etc. in excel format)
- List of customers/consumers/raw material suppliers- value chain analysis
- SWOT Analysis
Key Market Segments
By Type
- Turmeric
- Ginger
- Green tea
- Black tea
- Chamomile
- Peppermint
- Lemongrass
- Cinnamon
By Packaging
- Loose Tea
- Paperboards
- Aluminum Tins
- Tea Bags
By Distribution Channels
- Supermarket-Hypermarket
- Specialty Stores
- Convenience Stores
- Online Sales Channel
- Others
By Region
- North America
- U.S.
- Canada
- Mexico
- Europe
- Germany
- UK
- France
- Italy
- Russia
- Rest of Europe
- Asia-Pacific
- China
- India
- Japan
- South Korea
- Australia
- Rest of Asia-Pacific
- Latin America
- Brazil
- Colombia
- Argentina
- Rest of Latin America
- Middle East and Africa
- Gcc
- South Africa
- Rest Of Mea
Key Market Players:
- The Hain Celestial Group, Inc.
- Tata Consumer Products Limited
- Dilmah Ceylon Tea Company PLC
- Bigelow Tea Company
- Mountain Rose Herbs
- Terra Teas Organic
- Full Leaf Tea Co.
- Davidson's Organics
- ArtfulTea
- Yogi
TABLE OF CONTENTS
CHAPTER 1: INTRODUCTION
- 1.1. Report description
- 1.2. Key market segments
- 1.3. Key benefits to the stakeholders
- 1.4. Research methodology
- 1.4.1. Primary research
- 1.4.2. Secondary research
- 1.4.3. Analyst tools and models
CHAPTER 2: EXECUTIVE SUMMARY
- 2.1. CXO perspective
CHAPTER 3: MARKET OVERVIEW
- 3.1. Market definition and scope
- 3.2. Key findings
- 3.2.1. Top impacting factors
- 3.2.2. Top investment pockets
- 3.3. Porter's five forces analysis
- 3.4. Market dynamics
- 3.4.1. Drivers
- 3.4.2. Restraints
- 3.4.3. Opportunities
CHAPTER 4: ANTI INFLAMMATORY TEA MARKET, BY TYPE
- 4.1. Overview
- 4.1.1. Market size and forecast
- 4.2. Turmeric
- 4.2.1. Key market trends, growth factors and opportunities
- 4.2.2. Market size and forecast, by region
- 4.2.3. Market share analysis by country
- 4.3. Ginger
- 4.3.1. Key market trends, growth factors and opportunities
- 4.3.2. Market size and forecast, by region
- 4.3.3. Market share analysis by country
- 4.4. Green tea
- 4.4.1. Key market trends, growth factors and opportunities
- 4.4.2. Market size and forecast, by region
- 4.4.3. Market share analysis by country
- 4.5. Black tea
- 4.5.1. Key market trends, growth factors and opportunities
- 4.5.2. Market size and forecast, by region
- 4.5.3. Market share analysis by country
- 4.6. Chamomile
- 4.6.1. Key market trends, growth factors and opportunities
- 4.6.2. Market size and forecast, by region
- 4.6.3. Market share analysis by country
- 4.7. Peppermint
- 4.7.1. Key market trends, growth factors and opportunities
- 4.7.2. Market size and forecast, by region
- 4.7.3. Market share analysis by country
- 4.8. Lemongrass
- 4.8.1. Key market trends, growth factors and opportunities
- 4.8.2. Market size and forecast, by region
- 4.8.3. Market share analysis by country
- 4.9. Cinnamon
- 4.9.1. Key market trends, growth factors and opportunities
- 4.9.2. Market size and forecast, by region
- 4.9.3. Market share analysis by country
CHAPTER 5: ANTI INFLAMMATORY TEA MARKET, BY PACKAGING
- 5.1. Overview
- 5.1.1. Market size and forecast
- 5.2. Loose Tea
- 5.2.1. Key market trends, growth factors and opportunities
- 5.2.2. Market size and forecast, by region
- 5.2.3. Market share analysis by country
- 5.3. Paperboards
- 5.3.1. Key market trends, growth factors and opportunities
- 5.3.2. Market size and forecast, by region
- 5.3.3. Market share analysis by country
- 5.4. Aluminum Tins
- 5.4.1. Key market trends, growth factors and opportunities
- 5.4.2. Market size and forecast, by region
- 5.4.3. Market share analysis by country
- 5.5. Tea Bags
- 5.5.1. Key market trends, growth factors and opportunities
- 5.5.2. Market size and forecast, by region
- 5.5.3. Market share analysis by country
CHAPTER 6: ANTI INFLAMMATORY TEA MARKET, BY DISTRIBUTION CHANNELS
- 6.1. Overview
- 6.1.1. Market size and forecast
- 6.2. Supermarket-Hypermarket
- 6.2.1. Key market trends, growth factors and opportunities
- 6.2.2. Market size and forecast, by region
- 6.2.3. Market share analysis by country
- 6.3. Specialty Stores
- 6.3.1. Key market trends, growth factors and opportunities
- 6.3.2. Market size and forecast, by region
- 6.3.3. Market share analysis by country
- 6.4. Convenience Stores
- 6.4.1. Key market trends, growth factors and opportunities
- 6.4.2. Market size and forecast, by region
- 6.4.3. Market share analysis by country
- 6.5. Online Sales Channel
- 6.5.1. Key market trends, growth factors and opportunities
- 6.5.2. Market size and forecast, by region
- 6.5.3. Market share analysis by country
- 6.6. Others
- 6.6.1. Key market trends, growth factors and opportunities
- 6.6.2. Market size and forecast, by region
- 6.6.3. Market share analysis by country
CHAPTER 7: ANTI INFLAMMATORY TEA MARKET, BY REGION
- 7.1. Overview
- 7.1.1. Market size and forecast By Region
- 7.2. North America
- 7.2.1. Key market trends, growth factors and opportunities
- 7.2.2. Market size and forecast, by Type
- 7.2.3. Market size and forecast, by Packaging
- 7.2.4. Market size and forecast, by Distribution Channels
- 7.2.5. Market size and forecast, by country
- 7.2.5.1. U.S.
- 7.2.5.1.1. Market size and forecast, by Type
- 7.2.5.1.2. Market size and forecast, by Packaging
- 7.2.5.1.3. Market size and forecast, by Distribution Channels
- 7.2.5.2. Canada
- 7.2.5.2.1. Market size and forecast, by Type
- 7.2.5.2.2. Market size and forecast, by Packaging
- 7.2.5.2.3. Market size and forecast, by Distribution Channels
- 7.2.5.3. Mexico
- 7.2.5.3.1. Market size and forecast, by Type
- 7.2.5.3.2. Market size and forecast, by Packaging
- 7.2.5.3.3. Market size and forecast, by Distribution Channels
- 7.3. Europe
- 7.3.1. Key market trends, growth factors and opportunities
- 7.3.2. Market size and forecast, by Type
- 7.3.3. Market size and forecast, by Packaging
- 7.3.4. Market size and forecast, by Distribution Channels
- 7.3.5. Market size and forecast, by country
- 7.3.5.1. Germany
- 7.3.5.1.1. Market size and forecast, by Type
- 7.3.5.1.2. Market size and forecast, by Packaging
- 7.3.5.1.3. Market size and forecast, by Distribution Channels
- 7.3.5.2. UK
- 7.3.5.2.1. Market size and forecast, by Type
- 7.3.5.2.2. Market size and forecast, by Packaging
- 7.3.5.2.3. Market size and forecast, by Distribution Channels
- 7.3.5.3. France
- 7.3.5.3.1. Market size and forecast, by Type
- 7.3.5.3.2. Market size and forecast, by Packaging
- 7.3.5.3.3. Market size and forecast, by Distribution Channels
- 7.3.5.4. Italy
- 7.3.5.4.1. Market size and forecast, by Type
- 7.3.5.4.2. Market size and forecast, by Packaging
- 7.3.5.4.3. Market size and forecast, by Distribution Channels
- 7.3.5.5. Russia
- 7.3.5.5.1. Market size and forecast, by Type
- 7.3.5.5.2. Market size and forecast, by Packaging
- 7.3.5.5.3. Market size and forecast, by Distribution Channels
- 7.3.5.6. Rest of Europe
- 7.3.5.6.1. Market size and forecast, by Type
- 7.3.5.6.2. Market size and forecast, by Packaging
- 7.3.5.6.3. Market size and forecast, by Distribution Channels
- 7.4. Asia-Pacific
- 7.4.1. Key market trends, growth factors and opportunities
- 7.4.2. Market size and forecast, by Type
- 7.4.3. Market size and forecast, by Packaging
- 7.4.4. Market size and forecast, by Distribution Channels
- 7.4.5. Market size and forecast, by country
- 7.4.5.1. China
- 7.4.5.1.1. Market size and forecast, by Type
- 7.4.5.1.2. Market size and forecast, by Packaging
- 7.4.5.1.3. Market size and forecast, by Distribution Channels
- 7.4.5.2. India
- 7.4.5.2.1. Market size and forecast, by Type
- 7.4.5.2.2. Market size and forecast, by Packaging
- 7.4.5.2.3. Market size and forecast, by Distribution Channels
- 7.4.5.3. Japan
- 7.4.5.3.1. Market size and forecast, by Type
- 7.4.5.3.2. Market size and forecast, by Packaging
- 7.4.5.3.3. Market size and forecast, by Distribution Channels
- 7.4.5.4. South Korea
- 7.4.5.4.1. Market size and forecast, by Type
- 7.4.5.4.2. Market size and forecast, by Packaging
- 7.4.5.4.3. Market size and forecast, by Distribution Channels
- 7.4.5.5. Australia
- 7.4.5.5.1. Market size and forecast, by Type
- 7.4.5.5.2. Market size and forecast, by Packaging
- 7.4.5.5.3. Market size and forecast, by Distribution Channels
- 7.4.5.6. Rest of Asia-Pacific
- 7.4.5.6.1. Market size and forecast, by Type
- 7.4.5.6.2. Market size and forecast, by Packaging
- 7.4.5.6.3. Market size and forecast, by Distribution Channels
- 7.5. Latin America
- 7.5.1. Key market trends, growth factors and opportunities
- 7.5.2. Market size and forecast, by Type
- 7.5.3. Market size and forecast, by Packaging
- 7.5.4. Market size and forecast, by Distribution Channels
- 7.5.5. Market size and forecast, by country
- 7.5.5.1. Brazil
- 7.5.5.1.1. Market size and forecast, by Type
- 7.5.5.1.2. Market size and forecast, by Packaging
- 7.5.5.1.3. Market size and forecast, by Distribution Channels
- 7.5.5.2. Colombia
- 7.5.5.2.1. Market size and forecast, by Type
- 7.5.5.2.2. Market size and forecast, by Packaging
- 7.5.5.2.3. Market size and forecast, by Distribution Channels
- 7.5.5.3. Argentina
- 7.5.5.3.1. Market size and forecast, by Type
- 7.5.5.3.2. Market size and forecast, by Packaging
- 7.5.5.3.3. Market size and forecast, by Distribution Channels
- 7.5.5.4. Rest of Latin America
- 7.5.5.4.1. Market size and forecast, by Type
- 7.5.5.4.2. Market size and forecast, by Packaging
- 7.5.5.4.3. Market size and forecast, by Distribution Channels
- 7.6. Middle East and Africa
- 7.6.1. Key market trends, growth factors and opportunities
- 7.6.2. Market size and forecast, by Type
- 7.6.3. Market size and forecast, by Packaging
- 7.6.4. Market size and forecast, by Distribution Channels
- 7.6.5. Market size and forecast, by country
- 7.6.5.1. Gcc
- 7.6.5.1.1. Market size and forecast, by Type
- 7.6.5.1.2. Market size and forecast, by Packaging
- 7.6.5.1.3. Market size and forecast, by Distribution Channels
- 7.6.5.2. South Africa
- 7.6.5.2.1. Market size and forecast, by Type
- 7.6.5.2.2. Market size and forecast, by Packaging
- 7.6.5.2.3. Market size and forecast, by Distribution Channels
- 7.6.5.3. Rest Of Mea
- 7.6.5.3.1. Market size and forecast, by Type
- 7.6.5.3.2. Market size and forecast, by Packaging
- 7.6.5.3.3. Market size and forecast, by Distribution Channels
CHAPTER 8: COMPETITIVE LANDSCAPE
- 8.1. Introduction
- 8.2. Top winning strategies
- 8.3. Product mapping of top 10 player
- 8.4. Competitive dashboard
- 8.5. Competitive heatmap
- 8.6. Top player positioning, 2022
CHAPTER 9: COMPANY PROFILES
- 9.1. The Hain Celestial Group, Inc.
- 9.1.1. Company overview
- 9.1.2. Key executives
- 9.1.3. Company snapshot
- 9.1.4. Operating business segments
- 9.1.5. Product portfolio
- 9.1.6. Business performance
- 9.1.7. Key strategic moves and developments
- 9.2. Tata Consumer Products Limited
- 9.2.1. Company overview
- 9.2.2. Key executives
- 9.2.3. Company snapshot
- 9.2.4. Operating business segments
- 9.2.5. Product portfolio
- 9.2.6. Business performance
- 9.2.7. Key strategic moves and developments
- 9.3. Dilmah Ceylon Tea Company PLC
- 9.3.1. Company overview
- 9.3.2. Key executives
- 9.3.3. Company snapshot
- 9.3.4. Operating business segments
- 9.3.5. Product portfolio
- 9.3.6. Business performance
- 9.3.7. Key strategic moves and developments
- 9.4. Bigelow Tea Company
- 9.4.1. Company overview
- 9.4.2. Key executives
- 9.4.3. Company snapshot
- 9.4.4. Operating business segments
- 9.4.5. Product portfolio
- 9.4.6. Business performance
- 9.4.7. Key strategic moves and developments
- 9.5. Mountain Rose Herbs
- 9.5.1. Company overview
- 9.5.2. Key executives
- 9.5.3. Company snapshot
- 9.5.4. Operating business segments
- 9.5.5. Product portfolio
- 9.5.6. Business performance
- 9.5.7. Key strategic moves and developments
- 9.6. Terra Teas Organic
- 9.6.1. Company overview
- 9.6.2. Key executives
- 9.6.3. Company snapshot
- 9.6.4. Operating business segments
- 9.6.5. Product portfolio
- 9.6.6. Business performance
- 9.6.7. Key strategic moves and developments
- 9.7. Full Leaf Tea Co.
- 9.7.1. Company overview
- 9.7.2. Key executives
- 9.7.3. Company snapshot
- 9.7.4. Operating business segments
- 9.7.5. Product portfolio
- 9.7.6. Business performance
- 9.7.7. Key strategic moves and developments
- 9.8. Davidson's Organics
- 9.8.1. Company overview
- 9.8.2. Key executives
- 9.8.3. Company snapshot
- 9.8.4. Operating business segments
- 9.8.5. Product portfolio
- 9.8.6. Business performance
- 9.8.7. Key strategic moves and developments
- 9.9. ArtfulTea
- 9.9.1. Company overview
- 9.9.2. Key executives
- 9.9.3. Company snapshot
- 9.9.4. Operating business segments
- 9.9.5. Product portfolio
- 9.9.6. Business performance
- 9.9.7. Key strategic moves and developments
- 9.10. Yogi
- 9.10.1. Company overview
- 9.10.2. Key executives
- 9.10.3. Company snapshot
- 9.10.4. Operating business segments
- 9.10.5. Product portfolio
- 9.10.6. Business performance
- 9.10.7. Key strategic moves and developments
