
|
市場調査レポート
商品コード
1472230
クッキングスプレー市場:最終用途別、タイプ別、流通チャネル別:世界の機会分析と産業予測、2023~2032年Cooking Spray Market By End Use, By Type, By Distribution Channel : Global Opportunity Analysis and Industry Forecast, 2023-2032 |
||||||
|
|||||||

| クッキングスプレー市場:最終用途別、タイプ別、流通チャネル別:世界の機会分析と産業予測、2023~2032年 |
|
出版日: 2024年02月01日
発行: Allied Market Research
ページ情報: 英文 346 Pages
納期: 2~3営業日
|

- 全表示
- 概要
- 図表
- 目次
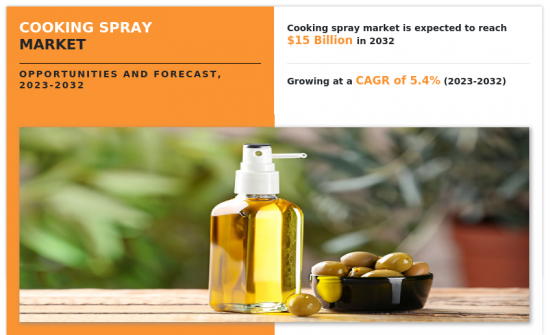
世界のクッキングスプレーの市場規模は、2022年に90億米ドルとなり、2023年から2032年にかけてCAGR5.4%で成長し、2032年までには150億米ドルに達すると予測されます。
クッキングスプレーは、調理中に食材が調理面に付着するのを防ぐために設計された便利な台所用品です。一般的にスプレー缶入りで、キャノーラ油、オリーブ油、植物油など様々な油にレシチンなどの乳化剤を加えて作られます。フライパンやグリル、焼き皿にスプレーすると、薄く均一な層ができ、表面がコーティングされるため、食材がこびりつく可能性が低くなります。これは調理や後片付けを簡単にするだけでなく、レシピに必要な油の量を減らすのに役立ち、従来の油脂を使う方法に代わる健康的な方法となります。
体重管理に関する関心の高まりは、市場におけるクッキングスプレーの需要を大幅に高めています。クッキングスプレーは、分量を正確に管理し、全体的なカロリー摂取量を減らすことで、体重管理を目指す個人に実用的なソリューションを提供します。従来の食用油やバターとは異なり、クッキングスプレーは薄く均一な油層を塗ることができるため、食事中の余分な脂肪分を最小限に抑えることができます。そのため、好きな料理の風味や食感を損なうことなく、ダイエット目標を達成することができます。さらに、クッキングスプレーは従来の油に比べて1食あたりのカロリーが低いことが多く、健康的な体重を維持したい人にとって魅力的な選択肢となります。さらに、クッキングスプレーは、味に妥協することなく、より健康的な調理法を優先する現代の食生活動向に合致しています。体重管理におけるバランスの取れた栄養と分量管理の重要性に対する認識が高まるにつれ、消費者は料理のレパートリーの中で便利で効果的なツールとしてクッキングスプレーを利用するようになっています。その結果、体重管理の急増がクッキングスプレー市場の拡大に拍車をかけ、健康志向の消費者の進化するニーズに応えるべく、製品の革新と多様化が推進されています。
さらに、専門家の推薦は、製品に信頼性と信用を与えることによって、クッキングスプレー業界の市場需要を急増させる上で極めて重要な役割を果たしています。著名なシェフ、栄養士、健康専門家が特定のクッキングスプレーブランドを推奨する場合、消費者はより優れた選択肢として認識する傾向があります。お墨付きは、脂肪摂取を減らし、調理効率を高め、料理の味を引き立てるなど、クッキングスプレーを使うメリットを強調することが多いです。さらに、専門家による推奨は、消費者が製品の品質と有効性を再確認するための一種の証明として機能します。料理番組、ソーシャル・メディア・プラットフォーム、ブランド・パートナーシップのいずれを通じてであれ、業界の専門家による推奨は、クッキングスプレーの知名度を高め、より多くの人々にリーチを広げるのに役立ちます。その結果、消費者はクッキングスプレーを料理のルーチンに取り入れる可能性が高くなり、業界全体の売上増加と市場成長を促進します。
クッキングスプレーの世界市場は、タイプ、最終用途、流通チャネル、地域に区分されます。タイプ別では、市場は植物性オイルスプレー、オリーブオイルスプレー、ココナッツオイルスプレー、バター風味スプレー、ベーキングスプレー、その他に区分されます。最終用途別では、市場は業務用と個人用に区分されます。流通チャネル別では、市場はハイパーマーケット/スーパーマーケット、独立小売店、企業間取引、オンライン販売チャネルに区分されます。地域別では、北米、欧州、アジア太平洋、ラテンアメリカ、中東・アフリカで分析されます。
同市場で事業を展開する主要企業は、合併、製品投入、買収、提携、パートナーシップなどの主要市場戦略に注力しています。また、競争の激しい市場において営業権を維持するため、市場リーチの強化にも注力しています。クッキングスプレーの世界市場における主要企業には、Baker's Joy、Crisco、Frylight、Mazola、PAM、Pompeian、Smart Balance、Spectrum、Vegalene、Wessonなどがあります。
利害関係者にとっての主なメリット
- 当レポートは、2022年から2032年までのクッキングスプレー市場分析の市場セグメント、現在の動向、推定・動向、力学の定量分析を提供し、クッキングスプレー市場の有力な機会を特定します。
- 市場促進要因、市場抑制要因、市場機会に関連する情報とともに市場調査を提供します。
- ポーターのファイブフォース分析は、利害関係者が利益指向のビジネス上の意思決定を行い、サプライヤーとバイヤーのネットワークを強化できるように、バイヤーとサプライヤーの効力を強調します。
- クッキングスプレー市場のセグメンテーションの詳細な分析は、一般的な市場機会を決定するのに役立ちます。
- 各地域の主要国は、世界市場への収益貢献度に応じてマッピングされています。
- 市場プレイヤーのポジショニングは、ベンチマークを容易にし、市場プレイヤーの現在の位置の明確な理解を提供します。
- 本レポートには、地域および世界のクッキングスプレー市場動向、主要企業、市場セグメント、応用分野、市場成長戦略の分析が含まれています。
本レポートで可能なカスタマイズ(追加費用とタイムラインに関しましては販売担当へご連絡ください)
- エンドユーザーの選好と問題点
- 消費者の平均支出
- 消費者の選好と製品仕様
- ディストリビューターのマージン分析
- 平均販売価格分析 / プライスポイント分析
- ブランドシェア分析
- クリスクロスセグメント分析 - 市場規模と予測
目次
第1章 イントロダクション
第2章 エグゼクティブサマリー
第3章 市場概要
- 市場の定義と範囲
- 主な調査結果
- 主要な影響要因
- 主要な投資機会
- ポーターのファイブフォース分析
- 市場力学
- 促進要因
- 抑制要因
- 機会
- バリューチェーン分析
- 価格分析
- 主要規制分析
第4章 クッキングスプレー市場:最終用途別
- 概要
- 業務用
- 家庭用
第5章 クッキングスプレー市場:タイプ別
- 概要
- 植物油スプレー
- オリーブオイルスプレー
- ココナッツオイルスプレー
- バター風味スプレー
- ベーキングスプレー
- その他
第6章 クッキングスプレー市場:流通チャネル別
- 概要
- B2B
- B2C
第7章 クッキングスプレー市場:地域別
- 概要
- 北米
- 米国
- カナダ
- メキシコ
- 欧州
- 英国
- イタリア
- ドイツ
- フランス
- スペイン
- その他欧州
- アジア太平洋
- 中国
- 日本
- インド
- 韓国
- オーストラリア
- インドネシア
- タイ
- その他アジア太平洋
- ラテンアメリカ
- ブラジル
- アルゼンチン
- その他ラテンアメリカ
- 中東・アフリカ
- 南アフリカ
- サウジアラビア
- その他中東・アフリカ
第8章 競合情勢
- イントロダクション
- 主要成功戦略
- 主要10社の製品マッピング
- 競合ダッシュボード
- 競合ヒートマップ
- 主要企業のポジショニング、2022年
第9章 企業プロファイル
- Baker's Joy
- Crisco
- Frylight
- mazola
- PAM
- pompeian
- Smart Balance
- Spectrum
- Vegalene
- Wesson
LIST OF TABLES
- TABLE 01. GLOBAL COOKING SPRAY MARKET, BY END USE, 2022-2032 ($MILLION)
- TABLE 02. COOKING SPRAY MARKET FOR COMMERCIAL USE, BY REGION, 2022-2032 ($MILLION)
- TABLE 03. COOKING SPRAY MARKET FOR HOME USE, BY REGION, 2022-2032 ($MILLION)
- TABLE 04. GLOBAL COOKING SPRAY MARKET, BY TYPE, 2022-2032 ($MILLION)
- TABLE 05. COOKING SPRAY MARKET FOR VEGETABLE OIL SPRAY, BY REGION, 2022-2032 ($MILLION)
- TABLE 06. COOKING SPRAY MARKET FOR OLIVE OIL SPRAY, BY REGION, 2022-2032 ($MILLION)
- TABLE 07. COOKING SPRAY MARKET FOR COCONUT OIL SPRAY, BY REGION, 2022-2032 ($MILLION)
- TABLE 08. COOKING SPRAY MARKET FOR BUTTER FLAVORED SPRAY, BY REGION, 2022-2032 ($MILLION)
- TABLE 09. COOKING SPRAY MARKET FOR BAKING SPRAY, BY REGION, 2022-2032 ($MILLION)
- TABLE 10. COOKING SPRAY MARKET FOR OTHERS, BY REGION, 2022-2032 ($MILLION)
- TABLE 11. GLOBAL COOKING SPRAY MARKET, BY DISTRIBUTION CHANNEL, 2022-2032 ($MILLION)
- TABLE 12. COOKING SPRAY MARKET FOR B2B, BY REGION, 2022-2032 ($MILLION)
- TABLE 13. COOKING SPRAY MARKET FOR B2C, BY REGION, 2022-2032 ($MILLION)
- TABLE 14. COOKING SPRAY MARKET, BY REGION, 2022-2032 ($MILLION)
- TABLE 15. NORTH AMERICA COOKING SPRAY MARKET, BY END USE, 2022-2032 ($MILLION)
- TABLE 16. NORTH AMERICA COOKING SPRAY MARKET, BY TYPE, 2022-2032 ($MILLION)
- TABLE 17. NORTH AMERICA COOKING SPRAY MARKET, BY DISTRIBUTION CHANNEL, 2022-2032 ($MILLION)
- TABLE 18. NORTH AMERICA COOKING SPRAY MARKET, BY COUNTRY, 2022-2032 ($MILLION)
- TABLE 19. U.S. COOKING SPRAY MARKET, BY END USE, 2022-2032 ($MILLION)
- TABLE 20. U.S. COOKING SPRAY MARKET, BY TYPE, 2022-2032 ($MILLION)
- TABLE 21. U.S. COOKING SPRAY MARKET, BY DISTRIBUTION CHANNEL, 2022-2032 ($MILLION)
- TABLE 22. CANADA COOKING SPRAY MARKET, BY END USE, 2022-2032 ($MILLION)
- TABLE 23. CANADA COOKING SPRAY MARKET, BY TYPE, 2022-2032 ($MILLION)
- TABLE 24. CANADA COOKING SPRAY MARKET, BY DISTRIBUTION CHANNEL, 2022-2032 ($MILLION)
- TABLE 25. MEXICO COOKING SPRAY MARKET, BY END USE, 2022-2032 ($MILLION)
- TABLE 26. MEXICO COOKING SPRAY MARKET, BY TYPE, 2022-2032 ($MILLION)
- TABLE 27. MEXICO COOKING SPRAY MARKET, BY DISTRIBUTION CHANNEL, 2022-2032 ($MILLION)
- TABLE 28. EUROPE COOKING SPRAY MARKET, BY END USE, 2022-2032 ($MILLION)
- TABLE 29. EUROPE COOKING SPRAY MARKET, BY TYPE, 2022-2032 ($MILLION)
- TABLE 30. EUROPE COOKING SPRAY MARKET, BY DISTRIBUTION CHANNEL, 2022-2032 ($MILLION)
- TABLE 31. EUROPE COOKING SPRAY MARKET, BY COUNTRY, 2022-2032 ($MILLION)
- TABLE 32. UK COOKING SPRAY MARKET, BY END USE, 2022-2032 ($MILLION)
- TABLE 33. UK COOKING SPRAY MARKET, BY TYPE, 2022-2032 ($MILLION)
- TABLE 34. UK COOKING SPRAY MARKET, BY DISTRIBUTION CHANNEL, 2022-2032 ($MILLION)
- TABLE 35. ITALY COOKING SPRAY MARKET, BY END USE, 2022-2032 ($MILLION)
- TABLE 36. ITALY COOKING SPRAY MARKET, BY TYPE, 2022-2032 ($MILLION)
- TABLE 37. ITALY COOKING SPRAY MARKET, BY DISTRIBUTION CHANNEL, 2022-2032 ($MILLION)
- TABLE 38. GERMANY COOKING SPRAY MARKET, BY END USE, 2022-2032 ($MILLION)
- TABLE 39. GERMANY COOKING SPRAY MARKET, BY TYPE, 2022-2032 ($MILLION)
- TABLE 40. GERMANY COOKING SPRAY MARKET, BY DISTRIBUTION CHANNEL, 2022-2032 ($MILLION)
- TABLE 41. FRANCE COOKING SPRAY MARKET, BY END USE, 2022-2032 ($MILLION)
- TABLE 42. FRANCE COOKING SPRAY MARKET, BY TYPE, 2022-2032 ($MILLION)
- TABLE 43. FRANCE COOKING SPRAY MARKET, BY DISTRIBUTION CHANNEL, 2022-2032 ($MILLION)
- TABLE 44. SPAIN COOKING SPRAY MARKET, BY END USE, 2022-2032 ($MILLION)
- TABLE 45. SPAIN COOKING SPRAY MARKET, BY TYPE, 2022-2032 ($MILLION)
- TABLE 46. SPAIN COOKING SPRAY MARKET, BY DISTRIBUTION CHANNEL, 2022-2032 ($MILLION)
- TABLE 47. REST OF EUROPE COOKING SPRAY MARKET, BY END USE, 2022-2032 ($MILLION)
- TABLE 48. REST OF EUROPE COOKING SPRAY MARKET, BY TYPE, 2022-2032 ($MILLION)
- TABLE 49. REST OF EUROPE COOKING SPRAY MARKET, BY DISTRIBUTION CHANNEL, 2022-2032 ($MILLION)
- TABLE 50. ASIA-PACIFIC COOKING SPRAY MARKET, BY END USE, 2022-2032 ($MILLION)
- TABLE 51. ASIA-PACIFIC COOKING SPRAY MARKET, BY TYPE, 2022-2032 ($MILLION)
- TABLE 52. ASIA-PACIFIC COOKING SPRAY MARKET, BY DISTRIBUTION CHANNEL, 2022-2032 ($MILLION)
- TABLE 53. ASIA-PACIFIC COOKING SPRAY MARKET, BY COUNTRY, 2022-2032 ($MILLION)
- TABLE 54. CHINA COOKING SPRAY MARKET, BY END USE, 2022-2032 ($MILLION)
- TABLE 55. CHINA COOKING SPRAY MARKET, BY TYPE, 2022-2032 ($MILLION)
- TABLE 56. CHINA COOKING SPRAY MARKET, BY DISTRIBUTION CHANNEL, 2022-2032 ($MILLION)
- TABLE 57. JAPAN COOKING SPRAY MARKET, BY END USE, 2022-2032 ($MILLION)
- TABLE 58. JAPAN COOKING SPRAY MARKET, BY TYPE, 2022-2032 ($MILLION)
- TABLE 59. JAPAN COOKING SPRAY MARKET, BY DISTRIBUTION CHANNEL, 2022-2032 ($MILLION)
- TABLE 60. INDIA COOKING SPRAY MARKET, BY END USE, 2022-2032 ($MILLION)
- TABLE 61. INDIA COOKING SPRAY MARKET, BY TYPE, 2022-2032 ($MILLION)
- TABLE 62. INDIA COOKING SPRAY MARKET, BY DISTRIBUTION CHANNEL, 2022-2032 ($MILLION)
- TABLE 63. SOUTH KOREA COOKING SPRAY MARKET, BY END USE, 2022-2032 ($MILLION)
- TABLE 64. SOUTH KOREA COOKING SPRAY MARKET, BY TYPE, 2022-2032 ($MILLION)
- TABLE 65. SOUTH KOREA COOKING SPRAY MARKET, BY DISTRIBUTION CHANNEL, 2022-2032 ($MILLION)
- TABLE 66. AUSTRALIA COOKING SPRAY MARKET, BY END USE, 2022-2032 ($MILLION)
- TABLE 67. AUSTRALIA COOKING SPRAY MARKET, BY TYPE, 2022-2032 ($MILLION)
- TABLE 68. AUSTRALIA COOKING SPRAY MARKET, BY DISTRIBUTION CHANNEL, 2022-2032 ($MILLION)
- TABLE 69. INDONESIA COOKING SPRAY MARKET, BY END USE, 2022-2032 ($MILLION)
- TABLE 70. INDONESIA COOKING SPRAY MARKET, BY TYPE, 2022-2032 ($MILLION)
- TABLE 71. INDONESIA COOKING SPRAY MARKET, BY DISTRIBUTION CHANNEL, 2022-2032 ($MILLION)
- TABLE 72. THAILAND COOKING SPRAY MARKET, BY END USE, 2022-2032 ($MILLION)
- TABLE 73. THAILAND COOKING SPRAY MARKET, BY TYPE, 2022-2032 ($MILLION)
- TABLE 74. THAILAND COOKING SPRAY MARKET, BY DISTRIBUTION CHANNEL, 2022-2032 ($MILLION)
- TABLE 75. REST OF ASIA-PACIFIC COOKING SPRAY MARKET, BY END USE, 2022-2032 ($MILLION)
- TABLE 76. REST OF ASIA-PACIFIC COOKING SPRAY MARKET, BY TYPE, 2022-2032 ($MILLION)
- TABLE 77. REST OF ASIA-PACIFIC COOKING SPRAY MARKET, BY DISTRIBUTION CHANNEL, 2022-2032 ($MILLION)
- TABLE 78. LATIN AMERICA COOKING SPRAY MARKET, BY END USE, 2022-2032 ($MILLION)
- TABLE 79. LATIN AMERICA COOKING SPRAY MARKET, BY TYPE, 2022-2032 ($MILLION)
- TABLE 80. LATIN AMERICA COOKING SPRAY MARKET, BY DISTRIBUTION CHANNEL, 2022-2032 ($MILLION)
- TABLE 81. LATIN AMERICA COOKING SPRAY MARKET, BY COUNTRY, 2022-2032 ($MILLION)
- TABLE 82. BRAZIL COOKING SPRAY MARKET, BY END USE, 2022-2032 ($MILLION)
- TABLE 83. BRAZIL COOKING SPRAY MARKET, BY TYPE, 2022-2032 ($MILLION)
- TABLE 84. BRAZIL COOKING SPRAY MARKET, BY DISTRIBUTION CHANNEL, 2022-2032 ($MILLION)
- TABLE 85. ARGENTINA COOKING SPRAY MARKET, BY END USE, 2022-2032 ($MILLION)
- TABLE 86. ARGENTINA COOKING SPRAY MARKET, BY TYPE, 2022-2032 ($MILLION)
- TABLE 87. ARGENTINA COOKING SPRAY MARKET, BY DISTRIBUTION CHANNEL, 2022-2032 ($MILLION)
- TABLE 88. REST OF LATIN AMERICA COOKING SPRAY MARKET, BY END USE, 2022-2032 ($MILLION)
- TABLE 89. REST OF LATIN AMERICA COOKING SPRAY MARKET, BY TYPE, 2022-2032 ($MILLION)
- TABLE 90. REST OF LATIN AMERICA COOKING SPRAY MARKET, BY DISTRIBUTION CHANNEL, 2022-2032 ($MILLION)
- TABLE 91. MIDDLE EAST AND AFRICA COOKING SPRAY MARKET, BY END USE, 2022-2032 ($MILLION)
- TABLE 92. MIDDLE EAST AND AFRICA COOKING SPRAY MARKET, BY TYPE, 2022-2032 ($MILLION)
- TABLE 93. MIDDLE EAST AND AFRICA COOKING SPRAY MARKET, BY DISTRIBUTION CHANNEL, 2022-2032 ($MILLION)
- TABLE 94. MIDDLE EAST AND AFRICA COOKING SPRAY MARKET, BY COUNTRY, 2022-2032 ($MILLION)
- TABLE 95. SOUTH AFRICA COOKING SPRAY MARKET, BY END USE, 2022-2032 ($MILLION)
- TABLE 96. SOUTH AFRICA COOKING SPRAY MARKET, BY TYPE, 2022-2032 ($MILLION)
- TABLE 97. SOUTH AFRICA COOKING SPRAY MARKET, BY DISTRIBUTION CHANNEL, 2022-2032 ($MILLION)
- TABLE 98. SAUDI ARABIA COOKING SPRAY MARKET, BY END USE, 2022-2032 ($MILLION)
- TABLE 99. SAUDI ARABIA COOKING SPRAY MARKET, BY TYPE, 2022-2032 ($MILLION)
- TABLE 100. SAUDI ARABIA COOKING SPRAY MARKET, BY DISTRIBUTION CHANNEL, 2022-2032 ($MILLION)
- TABLE 101. REST OF MEA COOKING SPRAY MARKET, BY END USE, 2022-2032 ($MILLION)
- TABLE 102. REST OF MEA COOKING SPRAY MARKET, BY TYPE, 2022-2032 ($MILLION)
- TABLE 103. REST OF MEA COOKING SPRAY MARKET, BY DISTRIBUTION CHANNEL, 2022-2032 ($MILLION)
- TABLE 104. BAKER'S JOY: KEY EXECUTIVES
- TABLE 105. BAKER'S JOY: COMPANY SNAPSHOT
- TABLE 106. BAKER'S JOY: PRODUCT SEGMENTS
- TABLE 107. BAKER'S JOY: SERVICE SEGMENTS
- TABLE 108. BAKER'S JOY: PRODUCT PORTFOLIO
- TABLE 109. BAKER'S JOY: KEY STRATERGIES
- TABLE 110. CRISCO: KEY EXECUTIVES
- TABLE 111. CRISCO: COMPANY SNAPSHOT
- TABLE 112. CRISCO: PRODUCT SEGMENTS
- TABLE 113. CRISCO: SERVICE SEGMENTS
- TABLE 114. CRISCO: PRODUCT PORTFOLIO
- TABLE 115. CRISCO: KEY STRATERGIES
- TABLE 116. FRYLIGHT: KEY EXECUTIVES
- TABLE 117. FRYLIGHT: COMPANY SNAPSHOT
- TABLE 118. FRYLIGHT: PRODUCT SEGMENTS
- TABLE 119. FRYLIGHT: SERVICE SEGMENTS
- TABLE 120. FRYLIGHT: PRODUCT PORTFOLIO
- TABLE 121. FRYLIGHT: KEY STRATERGIES
- TABLE 122. MAZOLA: KEY EXECUTIVES
- TABLE 123. MAZOLA: COMPANY SNAPSHOT
- TABLE 124. MAZOLA: PRODUCT SEGMENTS
- TABLE 125. MAZOLA: SERVICE SEGMENTS
- TABLE 126. MAZOLA: PRODUCT PORTFOLIO
- TABLE 127. MAZOLA: KEY STRATERGIES
- TABLE 128. PAM: KEY EXECUTIVES
- TABLE 129. PAM: COMPANY SNAPSHOT
- TABLE 130. PAM: PRODUCT SEGMENTS
- TABLE 131. PAM: SERVICE SEGMENTS
- TABLE 132. PAM: PRODUCT PORTFOLIO
- TABLE 133. PAM: KEY STRATERGIES
- TABLE 134. POMPEIAN: KEY EXECUTIVES
- TABLE 135. POMPEIAN: COMPANY SNAPSHOT
- TABLE 136. POMPEIAN: PRODUCT SEGMENTS
- TABLE 137. POMPEIAN: SERVICE SEGMENTS
- TABLE 138. POMPEIAN: PRODUCT PORTFOLIO
- TABLE 139. POMPEIAN: KEY STRATERGIES
- TABLE 140. SMART BALANCE: KEY EXECUTIVES
- TABLE 141. SMART BALANCE: COMPANY SNAPSHOT
- TABLE 142. SMART BALANCE: PRODUCT SEGMENTS
- TABLE 143. SMART BALANCE: SERVICE SEGMENTS
- TABLE 144. SMART BALANCE: PRODUCT PORTFOLIO
- TABLE 145. SMART BALANCE: KEY STRATERGIES
- TABLE 146. SPECTRUM: KEY EXECUTIVES
- TABLE 147. SPECTRUM: COMPANY SNAPSHOT
- TABLE 148. SPECTRUM: PRODUCT SEGMENTS
- TABLE 149. SPECTRUM: SERVICE SEGMENTS
- TABLE 150. SPECTRUM: PRODUCT PORTFOLIO
- TABLE 151. SPECTRUM: KEY STRATERGIES
- TABLE 152. VEGALENE: KEY EXECUTIVES
- TABLE 153. VEGALENE: COMPANY SNAPSHOT
- TABLE 154. VEGALENE: PRODUCT SEGMENTS
- TABLE 155. VEGALENE: SERVICE SEGMENTS
- TABLE 156. VEGALENE: PRODUCT PORTFOLIO
- TABLE 157. VEGALENE: KEY STRATERGIES
- TABLE 158. WESSON: KEY EXECUTIVES
- TABLE 159. WESSON: COMPANY SNAPSHOT
- TABLE 160. WESSON: PRODUCT SEGMENTS
- TABLE 161. WESSON: SERVICE SEGMENTS
- TABLE 162. WESSON: PRODUCT PORTFOLIO
- TABLE 163. WESSON: KEY STRATERGIES
LIST OF FIGURES
- FIGURE 01. COOKING SPRAY MARKET, 2022-2032
- FIGURE 02. SEGMENTATION OF COOKING SPRAY MARKET,2022-2032
- FIGURE 03. TOP IMPACTING FACTORS IN COOKING SPRAY MARKET
- FIGURE 04. TOP INVESTMENT POCKETS IN COOKING SPRAY MARKET (2023-2032)
- FIGURE 05. BARGAINING POWER OF SUPPLIERS
- FIGURE 06. BARGAINING POWER OF BUYERS
- FIGURE 07. THREAT OF SUBSTITUTION
- FIGURE 08. THREAT OF SUBSTITUTION
- FIGURE 09. COMPETITIVE RIVALRY
- FIGURE 10. GLOBAL COOKING SPRAY MARKET:DRIVERS, RESTRAINTS AND OPPORTUNITIES
- FIGURE 11. PRICING ANALYSIS: COOKING SPRAY MARKET 2022 AND 2032
- FIGURE 12. IMPACT OF KEY REGULATION: COOKING SPRAY MARKET
- FIGURE 13. COOKING SPRAY MARKET, BY END USE, 2022 AND 2032(%)
- FIGURE 14. COMPARATIVE SHARE ANALYSIS OF COOKING SPRAY MARKET FOR COMMERCIAL USE, BY COUNTRY 2022 AND 2032(%)
- FIGURE 15. COMPARATIVE SHARE ANALYSIS OF COOKING SPRAY MARKET FOR HOME USE, BY COUNTRY 2022 AND 2032(%)
- FIGURE 16. COOKING SPRAY MARKET, BY TYPE, 2022 AND 2032(%)
- FIGURE 17. COMPARATIVE SHARE ANALYSIS OF COOKING SPRAY MARKET FOR VEGETABLE OIL SPRAY, BY COUNTRY 2022 AND 2032(%)
- FIGURE 18. COMPARATIVE SHARE ANALYSIS OF COOKING SPRAY MARKET FOR OLIVE OIL SPRAY, BY COUNTRY 2022 AND 2032(%)
- FIGURE 19. COMPARATIVE SHARE ANALYSIS OF COOKING SPRAY MARKET FOR COCONUT OIL SPRAY, BY COUNTRY 2022 AND 2032(%)
- FIGURE 20. COMPARATIVE SHARE ANALYSIS OF COOKING SPRAY MARKET FOR BUTTER FLAVORED SPRAY, BY COUNTRY 2022 AND 2032(%)
- FIGURE 21. COMPARATIVE SHARE ANALYSIS OF COOKING SPRAY MARKET FOR BAKING SPRAY, BY COUNTRY 2022 AND 2032(%)
- FIGURE 22. COMPARATIVE SHARE ANALYSIS OF COOKING SPRAY MARKET FOR OTHERS, BY COUNTRY 2022 AND 2032(%)
- FIGURE 23. COOKING SPRAY MARKET, BY DISTRIBUTION CHANNEL, 2022 AND 2032(%)
- FIGURE 24. COMPARATIVE SHARE ANALYSIS OF COOKING SPRAY MARKET FOR B2B, BY COUNTRY 2022 AND 2032(%)
- FIGURE 25. COMPARATIVE SHARE ANALYSIS OF COOKING SPRAY MARKET FOR B2C, BY COUNTRY 2022 AND 2032(%)
- FIGURE 26. COOKING SPRAY MARKET BY REGION, 2022 AND 2032(%)
- FIGURE 27. U.S. COOKING SPRAY MARKET, 2022-2032 ($MILLION)
- FIGURE 28. CANADA COOKING SPRAY MARKET, 2022-2032 ($MILLION)
- FIGURE 29. MEXICO COOKING SPRAY MARKET, 2022-2032 ($MILLION)
- FIGURE 30. UK COOKING SPRAY MARKET, 2022-2032 ($MILLION)
- FIGURE 31. ITALY COOKING SPRAY MARKET, 2022-2032 ($MILLION)
- FIGURE 32. GERMANY COOKING SPRAY MARKET, 2022-2032 ($MILLION)
- FIGURE 33. FRANCE COOKING SPRAY MARKET, 2022-2032 ($MILLION)
- FIGURE 34. SPAIN COOKING SPRAY MARKET, 2022-2032 ($MILLION)
- FIGURE 35. REST OF EUROPE COOKING SPRAY MARKET, 2022-2032 ($MILLION)
- FIGURE 36. CHINA COOKING SPRAY MARKET, 2022-2032 ($MILLION)
- FIGURE 37. JAPAN COOKING SPRAY MARKET, 2022-2032 ($MILLION)
- FIGURE 38. INDIA COOKING SPRAY MARKET, 2022-2032 ($MILLION)
- FIGURE 39. SOUTH KOREA COOKING SPRAY MARKET, 2022-2032 ($MILLION)
- FIGURE 40. AUSTRALIA COOKING SPRAY MARKET, 2022-2032 ($MILLION)
- FIGURE 41. INDONESIA COOKING SPRAY MARKET, 2022-2032 ($MILLION)
- FIGURE 42. THAILAND COOKING SPRAY MARKET, 2022-2032 ($MILLION)
- FIGURE 43. REST OF ASIA-PACIFIC COOKING SPRAY MARKET, 2022-2032 ($MILLION)
- FIGURE 44. BRAZIL COOKING SPRAY MARKET, 2022-2032 ($MILLION)
- FIGURE 45. ARGENTINA COOKING SPRAY MARKET, 2022-2032 ($MILLION)
- FIGURE 46. REST OF LATIN AMERICA COOKING SPRAY MARKET, 2022-2032 ($MILLION)
- FIGURE 47. SOUTH AFRICA COOKING SPRAY MARKET, 2022-2032 ($MILLION)
- FIGURE 48. SAUDI ARABIA COOKING SPRAY MARKET, 2022-2032 ($MILLION)
- FIGURE 49. REST OF MEA COOKING SPRAY MARKET, 2022-2032 ($MILLION)
- FIGURE 50. TOP WINNING STRATEGIES, BY YEAR
- FIGURE 51. TOP WINNING STRATEGIES, BY DEVELOPMENT
- FIGURE 52. TOP WINNING STRATEGIES, BY COMPANY
- FIGURE 53. PRODUCT MAPPING OF TOP 10 PLAYERS
- FIGURE 54. COMPETITIVE DASHBOARD
- FIGURE 55. COMPETITIVE HEATMAP: COOKING SPRAY MARKET
- FIGURE 56. TOP PLAYER POSITIONING, 2022
The global cooking spray market size was valued at $9 billion in 2022, and is projected to reach $15 billion by 2032, growing at a CAGR of 5.4% from 2023 to 2032
Cooking spray is a convenient kitchen product designed to prevent food from sticking to cooking surfaces during food preparation. It typically comes in a spray can and is made from various oils, such as canola, olive, or vegetable oil, combined with lecithin or other emulsifiers. When sprayed onto pans, grills, or baking dishes, it creates a thin, even layer that helps to coat the surface, reducing the likelihood of food sticking. This not only makes cooking and cleanup easier but also helps to reduce the amount of oil needed in recipes, making it a healthier alternative to traditional greasing methods.
The surge in weight management concerns has significantly increased the demand for cooking spray in the market. Cooking sprays offer a practical solution for individuals aiming to manage their weight by providing precise portion control and reducing overall calorie intake. Unlike traditional cooking oils or butter, cooking sprays allow users to apply a thin, even layer of oil, minimizing excess fat in their meals. This helps individuals adhere to their dietary goals without sacrificing flavor or texture in their favorite dishes. Additionally, cooking sprays often contain fewer calories per serving compared to conventional oils, making them an attractive option for those looking to maintain a healthy weight. Moreover, cooking sprays align with modern dietary trends that prioritize healthier cooking methods without compromising on taste. With growing awareness of the importance of balanced nutrition and portion management in weight management, consumers are increasingly turning to cooking sprays as a convenient and effective tool in their culinary repertoire. As a result, the weight management surge has fueled the expansion of the cooking spray market, driving innovation and diversification in product offerings to cater to the evolving needs of health-conscious consumers.
Furthermore, professional endorsements play a pivotal role in surging market demand for the cooking spray industry by lending credibility and trustworthiness to the product. When renowned chefs, nutritionists, or health professionals recommend a specific cooking spray brand, consumers are more inclined to perceive it as a superior choice. Endorsements often highlight the benefits of using cooking sprays, such as their ability to reduce fat intake, improve cooking efficiency, and enhance the flavor of dishes. Moreover, professional endorsements serve as a form of validation for consumers, reassuring them of the quality and efficacy of the product. Whether through cooking shows, social media platforms, or brand partnerships, endorsements from industry experts help to elevate the profile of cooking sprays and expand their reach to a broader audience. As a result, consumers are more likely to incorporate cooking sprays into their culinary routines, driving increased sales and market growth for the industry as a whole.
The global cooking spray market is segmented into type, end use, distribution channel, and region. Based on type, the market is segmented into vegetable oil spray, olive oil spray, coconut oil spray, butter flavored spray, baking spray, and others. As per end use, the market is segmented into commercial use and personal use. Based on distribution channel, the market is segmented into hypermarket/supermarket, independent retail store, business to business, and online sales channel. Region wise, it is analyzed across North America, Europe, Asia-Pacific, LA, and MEA.
The major players operating in the market focus on key market strategies, such as mergers, product launches, acquisitions, collaborations, and partnerships. They have been also focusing on strengthening their market reach to maintain their goodwill in the ever-competitive market. Some of the key players in the global cooking spray market include Baker's Joy, Crisco, Frylight, Mazola, PAM, Pompeian, Smart Balance, Spectrum, Vegalene, and Wesson.
Key Benefits For Stakeholders
- This report provides a quantitative analysis of the market segments, current trends, estimations, and dynamics of the cooking spray market analysis from 2022 to 2032 to identify the prevailing cooking spray market opportunities.
- The market research is offered along with information related to key drivers, restraints, and opportunities.
- Porter's five forces analysis highlights the potency of buyers and suppliers to enable stakeholders make profit-oriented business decisions and strengthen their supplier-buyer network.
- In-depth analysis of the cooking spray market segmentation assists to determine the prevailing market opportunities.
- Major countries in each region are mapped according to their revenue contribution to the global market.
- Market player positioning facilitates benchmarking and provides a clear understanding of the present position of the market players.
- The report includes the analysis of the regional as well as global cooking spray market trends, key players, market segments, application areas, and market growth strategies.
Additional benefits you will get with this purchase are:
- Quarterly Update and* (only available with a corporate license, on listed price)
- 5 additional Company Profile of client Choice pre- or Post-purchase, as a free update.
- Free Upcoming Version on the Purchase of Five and Enterprise User License.
- 16 analyst hours of support* (post-purchase, if you find additional data requirements upon review of the report, you may receive support amounting to 16 analyst hours to solve questions, and post-sale queries)
- 15% Free Customization* (in case the scope or segment of the report does not match your requirements, 15% is equivalent to 3 working days of free work, applicable once)
- Free data Pack on the Five and Enterprise User License. (Excel version of the report)
- Free Updated report if the report is 6-12 months old or older.
- 24-hour priority response*
- Free Industry updates and white papers.
Possible Customization with this report (with additional cost and timeline, please talk to the sales executive to know more)
- End user preferences and pain points
- Average Consumer Expenditure
- Consumer Preference and Product Specifications
- Distributor margin Analysis
- Average Selling Price Analysis / Price Point Analysis
- Brands Share Analysis
- Criss-cross segment analysis- market size and forecast
Key Market Segments
By End Use
- Commercial Use
- Home Use
By Type
- Vegetable Oil Spray
- Olive Oil Spray
- Coconut Oil Spray
- Butter Flavored Spray
- Baking Spray
- Others
By Distribution Channel
- B2B
- B2C
By Region
- North America
- U.S.
- Canada
- Mexico
- Europe
- Uk
- Italy
- Germany
- France
- Spain
- Rest Of Europe
- Asia-Pacific
- China
- Japan
- India
- South Korea
- Australia
- Indonesia
- Thailand
- Rest of Asia-Pacific
- Latin America
- Brazil
- Argentina
- Rest of Latin America
- Middle East and Africa
- South Africa
- Saudi Arabia
- Rest Of Mea
Key Market Players:
- Baker's Joy
- Crisco
- Frylight
- mazola
- PAM
- pompeian
- Smart Balance
- Spectrum
- Vegalene
- Wesson
TABLE OF CONTENTS
CHAPTER 1: INTRODUCTION
- 1.1. Report description
- 1.2. Key market segments
- 1.3. Key benefits to the stakeholders
- 1.4. Research methodology
- 1.4.1. Primary research
- 1.4.2. Secondary research
- 1.4.3. Analyst tools and models
CHAPTER 2: EXECUTIVE SUMMARY
- 2.1. CXO perspective
CHAPTER 3: MARKET OVERVIEW
- 3.1. Market definition and scope
- 3.2. Key findings
- 3.2.1. Top impacting factors
- 3.2.2. Top investment pockets
- 3.3. Porter's five forces analysis
- 3.4. Market dynamics
- 3.4.1. Drivers
- 3.4.2. Restraints
- 3.4.3. Opportunities
- 3.5. Value Chain Analysis
- 3.6. Pricing Analysis
- 3.7. Key Regulation Analysis
CHAPTER 4: COOKING SPRAY MARKET, BY END USE
- 4.1. Overview
- 4.1.1. Market size and forecast
- 4.2. Commercial Use
- 4.2.1. Key market trends, growth factors and opportunities
- 4.2.2. Market size and forecast, by region
- 4.2.3. Market share analysis by country
- 4.3. Home Use
- 4.3.1. Key market trends, growth factors and opportunities
- 4.3.2. Market size and forecast, by region
- 4.3.3. Market share analysis by country
CHAPTER 5: COOKING SPRAY MARKET, BY TYPE
- 5.1. Overview
- 5.1.1. Market size and forecast
- 5.2. Vegetable Oil Spray
- 5.2.1. Key market trends, growth factors and opportunities
- 5.2.2. Market size and forecast, by region
- 5.2.3. Market share analysis by country
- 5.3. Olive Oil Spray
- 5.3.1. Key market trends, growth factors and opportunities
- 5.3.2. Market size and forecast, by region
- 5.3.3. Market share analysis by country
- 5.4. Coconut Oil Spray
- 5.4.1. Key market trends, growth factors and opportunities
- 5.4.2. Market size and forecast, by region
- 5.4.3. Market share analysis by country
- 5.5. Butter Flavored Spray
- 5.5.1. Key market trends, growth factors and opportunities
- 5.5.2. Market size and forecast, by region
- 5.5.3. Market share analysis by country
- 5.6. Baking Spray
- 5.6.1. Key market trends, growth factors and opportunities
- 5.6.2. Market size and forecast, by region
- 5.6.3. Market share analysis by country
- 5.7. Others
- 5.7.1. Key market trends, growth factors and opportunities
- 5.7.2. Market size and forecast, by region
- 5.7.3. Market share analysis by country
CHAPTER 6: COOKING SPRAY MARKET, BY DISTRIBUTION CHANNEL
- 6.1. Overview
- 6.1.1. Market size and forecast
- 6.2. B2B
- 6.2.1. Key market trends, growth factors and opportunities
- 6.2.2. Market size and forecast, by region
- 6.2.3. Market share analysis by country
- 6.3. B2C
- 6.3.1. Key market trends, growth factors and opportunities
- 6.3.2. Market size and forecast, by region
- 6.3.3. Market share analysis by country
CHAPTER 7: COOKING SPRAY MARKET, BY REGION
- 7.1. Overview
- 7.1.1. Market size and forecast By Region
- 7.2. North America
- 7.2.1. Key market trends, growth factors and opportunities
- 7.2.2. Market size and forecast, by End Use
- 7.2.3. Market size and forecast, by Type
- 7.2.4. Market size and forecast, by Distribution Channel
- 7.2.5. Market size and forecast, by country
- 7.2.5.1. U.S.
- 7.2.5.1.1. Market size and forecast, by End Use
- 7.2.5.1.2. Market size and forecast, by Type
- 7.2.5.1.3. Market size and forecast, by Distribution Channel
- 7.2.5.2. Canada
- 7.2.5.2.1. Market size and forecast, by End Use
- 7.2.5.2.2. Market size and forecast, by Type
- 7.2.5.2.3. Market size and forecast, by Distribution Channel
- 7.2.5.3. Mexico
- 7.2.5.3.1. Market size and forecast, by End Use
- 7.2.5.3.2. Market size and forecast, by Type
- 7.2.5.3.3. Market size and forecast, by Distribution Channel
- 7.3. Europe
- 7.3.1. Key market trends, growth factors and opportunities
- 7.3.2. Market size and forecast, by End Use
- 7.3.3. Market size and forecast, by Type
- 7.3.4. Market size and forecast, by Distribution Channel
- 7.3.5. Market size and forecast, by country
- 7.3.5.1. Uk
- 7.3.5.1.1. Market size and forecast, by End Use
- 7.3.5.1.2. Market size and forecast, by Type
- 7.3.5.1.3. Market size and forecast, by Distribution Channel
- 7.3.5.2. Italy
- 7.3.5.2.1. Market size and forecast, by End Use
- 7.3.5.2.2. Market size and forecast, by Type
- 7.3.5.2.3. Market size and forecast, by Distribution Channel
- 7.3.5.3. Germany
- 7.3.5.3.1. Market size and forecast, by End Use
- 7.3.5.3.2. Market size and forecast, by Type
- 7.3.5.3.3. Market size and forecast, by Distribution Channel
- 7.3.5.4. France
- 7.3.5.4.1. Market size and forecast, by End Use
- 7.3.5.4.2. Market size and forecast, by Type
- 7.3.5.4.3. Market size and forecast, by Distribution Channel
- 7.3.5.5. Spain
- 7.3.5.5.1. Market size and forecast, by End Use
- 7.3.5.5.2. Market size and forecast, by Type
- 7.3.5.5.3. Market size and forecast, by Distribution Channel
- 7.3.5.6. Rest Of Europe
- 7.3.5.6.1. Market size and forecast, by End Use
- 7.3.5.6.2. Market size and forecast, by Type
- 7.3.5.6.3. Market size and forecast, by Distribution Channel
- 7.4. Asia-Pacific
- 7.4.1. Key market trends, growth factors and opportunities
- 7.4.2. Market size and forecast, by End Use
- 7.4.3. Market size and forecast, by Type
- 7.4.4. Market size and forecast, by Distribution Channel
- 7.4.5. Market size and forecast, by country
- 7.4.5.1. China
- 7.4.5.1.1. Market size and forecast, by End Use
- 7.4.5.1.2. Market size and forecast, by Type
- 7.4.5.1.3. Market size and forecast, by Distribution Channel
- 7.4.5.2. Japan
- 7.4.5.2.1. Market size and forecast, by End Use
- 7.4.5.2.2. Market size and forecast, by Type
- 7.4.5.2.3. Market size and forecast, by Distribution Channel
- 7.4.5.3. India
- 7.4.5.3.1. Market size and forecast, by End Use
- 7.4.5.3.2. Market size and forecast, by Type
- 7.4.5.3.3. Market size and forecast, by Distribution Channel
- 7.4.5.4. South Korea
- 7.4.5.4.1. Market size and forecast, by End Use
- 7.4.5.4.2. Market size and forecast, by Type
- 7.4.5.4.3. Market size and forecast, by Distribution Channel
- 7.4.5.5. Australia
- 7.4.5.5.1. Market size and forecast, by End Use
- 7.4.5.5.2. Market size and forecast, by Type
- 7.4.5.5.3. Market size and forecast, by Distribution Channel
- 7.4.5.6. Indonesia
- 7.4.5.6.1. Market size and forecast, by End Use
- 7.4.5.6.2. Market size and forecast, by Type
- 7.4.5.6.3. Market size and forecast, by Distribution Channel
- 7.4.5.7. Thailand
- 7.4.5.7.1. Market size and forecast, by End Use
- 7.4.5.7.2. Market size and forecast, by Type
- 7.4.5.7.3. Market size and forecast, by Distribution Channel
- 7.4.5.8. Rest of Asia-Pacific
- 7.4.5.8.1. Market size and forecast, by End Use
- 7.4.5.8.2. Market size and forecast, by Type
- 7.4.5.8.3. Market size and forecast, by Distribution Channel
- 7.5. Latin America
- 7.5.1. Key market trends, growth factors and opportunities
- 7.5.2. Market size and forecast, by End Use
- 7.5.3. Market size and forecast, by Type
- 7.5.4. Market size and forecast, by Distribution Channel
- 7.5.5. Market size and forecast, by country
- 7.5.5.1. Brazil
- 7.5.5.1.1. Market size and forecast, by End Use
- 7.5.5.1.2. Market size and forecast, by Type
- 7.5.5.1.3. Market size and forecast, by Distribution Channel
- 7.5.5.2. Argentina
- 7.5.5.2.1. Market size and forecast, by End Use
- 7.5.5.2.2. Market size and forecast, by Type
- 7.5.5.2.3. Market size and forecast, by Distribution Channel
- 7.5.5.3. Rest of Latin America
- 7.5.5.3.1. Market size and forecast, by End Use
- 7.5.5.3.2. Market size and forecast, by Type
- 7.5.5.3.3. Market size and forecast, by Distribution Channel
- 7.6. Middle East and Africa
- 7.6.1. Key market trends, growth factors and opportunities
- 7.6.2. Market size and forecast, by End Use
- 7.6.3. Market size and forecast, by Type
- 7.6.4. Market size and forecast, by Distribution Channel
- 7.6.5. Market size and forecast, by country
- 7.6.5.1. South Africa
- 7.6.5.1.1. Market size and forecast, by End Use
- 7.6.5.1.2. Market size and forecast, by Type
- 7.6.5.1.3. Market size and forecast, by Distribution Channel
- 7.6.5.2. Saudi Arabia
- 7.6.5.2.1. Market size and forecast, by End Use
- 7.6.5.2.2. Market size and forecast, by Type
- 7.6.5.2.3. Market size and forecast, by Distribution Channel
- 7.6.5.3. Rest Of Mea
- 7.6.5.3.1. Market size and forecast, by End Use
- 7.6.5.3.2. Market size and forecast, by Type
- 7.6.5.3.3. Market size and forecast, by Distribution Channel
CHAPTER 8: COMPETITIVE LANDSCAPE
- 8.1. Introduction
- 8.2. Top winning strategies
- 8.3. Product mapping of top 10 player
- 8.4. Competitive dashboard
- 8.5. Competitive heatmap
- 8.6. Top player positioning, 2022
CHAPTER 9: COMPANY PROFILES
- 9.1. Baker's Joy
- 9.1.1. Company overview
- 9.1.2. Key executives
- 9.1.3. Company snapshot
- 9.1.4. Operating business segments
- 9.1.5. Product portfolio
- 9.1.6. Business performance
- 9.1.7. Key strategic moves and developments
- 9.2. Crisco
- 9.2.1. Company overview
- 9.2.2. Key executives
- 9.2.3. Company snapshot
- 9.2.4. Operating business segments
- 9.2.5. Product portfolio
- 9.2.6. Business performance
- 9.2.7. Key strategic moves and developments
- 9.3. Frylight
- 9.3.1. Company overview
- 9.3.2. Key executives
- 9.3.3. Company snapshot
- 9.3.4. Operating business segments
- 9.3.5. Product portfolio
- 9.3.6. Business performance
- 9.3.7. Key strategic moves and developments
- 9.4. mazola
- 9.4.1. Company overview
- 9.4.2. Key executives
- 9.4.3. Company snapshot
- 9.4.4. Operating business segments
- 9.4.5. Product portfolio
- 9.4.6. Business performance
- 9.4.7. Key strategic moves and developments
- 9.5. PAM
- 9.5.1. Company overview
- 9.5.2. Key executives
- 9.5.3. Company snapshot
- 9.5.4. Operating business segments
- 9.5.5. Product portfolio
- 9.5.6. Business performance
- 9.5.7. Key strategic moves and developments
- 9.6. pompeian
- 9.6.1. Company overview
- 9.6.2. Key executives
- 9.6.3. Company snapshot
- 9.6.4. Operating business segments
- 9.6.5. Product portfolio
- 9.6.6. Business performance
- 9.6.7. Key strategic moves and developments
- 9.7. Smart Balance
- 9.7.1. Company overview
- 9.7.2. Key executives
- 9.7.3. Company snapshot
- 9.7.4. Operating business segments
- 9.7.5. Product portfolio
- 9.7.6. Business performance
- 9.7.7. Key strategic moves and developments
- 9.8. Spectrum
- 9.8.1. Company overview
- 9.8.2. Key executives
- 9.8.3. Company snapshot
- 9.8.4. Operating business segments
- 9.8.5. Product portfolio
- 9.8.6. Business performance
- 9.8.7. Key strategic moves and developments
- 9.9. Vegalene
- 9.9.1. Company overview
- 9.9.2. Key executives
- 9.9.3. Company snapshot
- 9.9.4. Operating business segments
- 9.9.5. Product portfolio
- 9.9.6. Business performance
- 9.9.7. Key strategic moves and developments
- 9.10. Wesson
- 9.10.1. Company overview
- 9.10.2. Key executives
- 9.10.3. Company snapshot
- 9.10.4. Operating business segments
- 9.10.5. Product portfolio
- 9.10.6. Business performance
- 9.10.7. Key strategic moves and developments
