
|
市場調査レポート
商品コード
1472205
プレスブレーキ市場:製品タイプ別、動力源別、軸別:2023~2032年の世界機会分析と産業予測Press Brakes Market By Product Type (Hydraulic, Hybrid, Servo-electric, Others), By Power Source (Electric, Hydraulic), By Axis (2 to 4 Axis, 4 to 6 Axis, 6 to 8 Axis): Global Opportunity Analysis and Industry Forecast, 2023-2032 |
||||||
|
|||||||

| プレスブレーキ市場:製品タイプ別、動力源別、軸別:2023~2032年の世界機会分析と産業予測 |
|
出版日: 2024年02月01日
発行: Allied Market Research
ページ情報: 英文 220 Pages
納期: 2~3営業日
|

- 全表示
- 概要
- 図表
- 目次
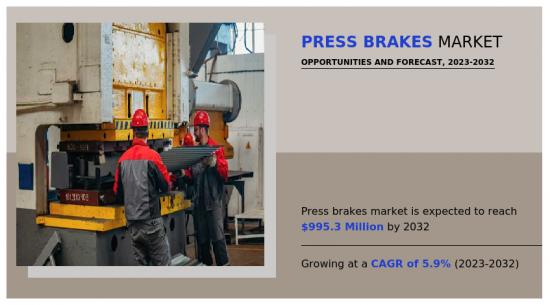
世界のプレスブレーキ市場は、2022年には5億6,810万米ドルと評価され、2023年から2032年までのCAGRは5.88%を記録し、2032年には9億9,530万米ドルに達すると予測されています。
金属加工において、プレスブレーキは板金を正確に曲げ、成形するために設計された極めて重要な機械です。油圧または機械的な力を利用して、プレスブレーキは金型に対して金属に圧力をかけ、ワークピースの最終的な形状を決定します。この多目的な装置は、電子機器から家具製造まで幅広い産業で重要な、正確な曲げと角度を持つ部品を作成するために広く使用されています。プレスブレーキの調整可能なバックゲージは、一貫性と再現性を保証し、金属加工工程の効率と品質に貢献します。
高度な自動化機能を備えたプレスブレーキは、板金曲げ作業に革命をもたらす最前線にあります。プレスブレーキの自動化には、マテリアルハンドリング、工具交換、さらには複雑な曲げシーケンスの実行のためのロボットシステムの統合が含まれます。ロボットアームの導入は、手作業の介入を減らし、生産速度を向上させ、エラーのリスクを最小限に抑えることで、全体的な効率を高めます。さらに、自動プレスブレーキは、重量のあるマテリアルハンドリングや繰り返し作業を行う人間の必要性を軽減することで、職場の安全性向上に貢献します。自動化とプレスブレーキ技術の相乗効果は、正確なプログラミングと曲げシーケンスの実行を可能にするコンピュータ数値制御(CNC)システムの活用に顕著に表れています。これは、一貫した高品質の出力を保証するだけでなく、様々な製造要件へのプレスブレーキのシームレスな適合を容易にします。このような要因がプレスブレーキ市場の成長を促進すると予想されます。
プレスブレーキシステムを操作するための熟練労働力の需要は、市場の成長を抑制します。最新のプレスブレーキには、コンピュータ数値制御(CNC)システムや自動化機能などの洗練された技術が搭載されているが、その効果的な操作には熟練した知識のあるオペレーターが依然として必要です。CNC制御のプログラミング、技術図面の解釈、プレスブレーキの複雑なセットアップの理解に精通した有資格者の不足は、メーカーにとって課題となっています。熟練オペレーターの育成には時間と資源が必要で、学習曲線は生産効率に影響を与えかねないです。こうした要因が市場の成長を抑制すると予想されます。
さらに、インダストリー4.0技術の統合は、メーカーにスマート製造の原則を取り入れ、全体的な業務効率を高めるチャンスを与えています。モノのインターネット(IoT)デバイス、データ分析、接続機能をプレスブレーキシステムに組み込むことで、リアルタイム監視、予知保全、プロセス最適化の道が開ける。IoTセンサーと接続性を活用することで、プレスブレーキは機械の性能に関する貴重な洞察を提供することができ、メーカーは曲げ力、工具摩耗、エネルギー消費などのパラメーターを監視することができます。例えば、HUI Manufacturingは2022年3月、待望のTrumpf TruBend 5130プレスブレーキの納入を受けた。これにより、同社の生産能力が向上します。このような要因は、予測期間中に市場プレーヤーに有利な成長機会を提供すると期待されています。
プレスブレーキ市場は、製品タイプ、動力源、軸、地域によって区分されます。製品タイプ別では、市場は油圧、ハイブリッド、サーボ電動、その他に分類されます。動力源ベースでは、電気式と油圧式に二分されます。軸別では、市場は2~4軸、4~6軸、6~8軸に分類されます。地域別では、北米(米国、カナダ、メキシコ)、欧州(ドイツ、英国、イタリア、フランス、その他欧州地域)、アジア太平洋地域(中国、日本、インド、韓国、その他アジア太平洋地域)、その他アジア太平洋地域(中南米、中東・アフリカ)で分析されます。
利害関係者にとっての主なメリット
- 当レポートは、2022年から2032年までのプレスブレーキ市場分析の市場セグメント、現在の動向、推定・動向分析、力学の定量分析を提供し、プレスブレーキ市場の有力な市場機会を特定します。
- 市場促進要因、市場抑制要因、市場機会に関連する情報とともに市場調査を提供します。
- ポーターのファイブフォース分析では、利害関係者が利益重視のビジネス決定を下し、サプライヤーとバイヤーのネットワークを強化できるように、バイヤーとサプライヤーの潜在力を強調します。
- プレスブレーキ市場のセグメンテーションの詳細な分析は、市場機会を決定するのに役立ちます。
- 各地域の主要国は、世界市場への収益貢献度に応じてマッピングされています。
- 市場プレイヤーのポジショニングは、ベンチマーキングを容易にし、市場プレイヤーの現在のポジションの明確な理解を提供します。
- 本レポートには、地域および世界のプレスブレーキ市場動向、主要企業、市場セグメント、応用分野、市場成長戦略の分析が含まれています。
本レポートで可能なカスタマイズ(追加費用とスケジュールが必要です。)
- 顧客の関心に応じた企業プロファイルの追加
- 国別または地域別の追加分析-市場規模と予測
- 企業プロファイルの拡張リスト
- 過去の市場データ
目次
第1章 イントロダクション
第2章 エグゼクティブサマリー
第3章 市場概要
- 市場の定義と範囲
- 主な調査結果
- 影響要因
- 主な投資機会
- ポーターのファイブフォース分析
- 市場力学
- 促進要因
- 抑制要因
- 機会
第4章 プレスブレーキ市場:製品タイプ別
- 概要
- 油圧式
- ハイブリッド
- サーボ電動
- その他
第5章 プレスブレーキ市場:動力源別
- 概要
- 電動
- 油圧
第6章 プレスブレーキ市場:軸別
- 概要
- 2~4軸
- 4~6軸
- 6~8軸
第7章 プレスブレーキ市場:地域別
- 概要
- 北米
- 米国
- カナダ
- メキシコ
- 欧州
- ドイツ
- フランス
- イタリア
- 英国
- その他
- アジア太平洋
- 中国
- 日本
- インド
- 韓国
- その他
- ラテンアメリカ
- ブラジル
- チリ
- その他ラテンアメリカ
- 中東・アフリカ
- サウジアラビア
- アラブ首長国連邦
- ナイジェリア
- 南アフリカ
- その他中東とアフリカ
第8章 競争情勢
- イントロダクション
- 主要成功戦略
- 主要10社の製品マッピング
- 競合ダッシュボード
- 競合ヒートマップ
- 主要企業のポジショニング、2022年
第9章 企業プロファイル
- Durmazlar Machinery Inc.
- Accurl CNC Machine Anhui Manufactory Co., Ltd.
- Amada Company, Ltd.
- Baykal Makina Sanayi ve Ticaret A.S.
- ADH Machine Tool
- Cincinnati Incorporated
- Dener Makina
- ERMAKSAN
- LVD Company NV
- Prima Industrie SpA
LIST OF TABLES
- TABLE 01. GLOBAL PRESS BRAKES MARKET, BY PRODUCT TYPE, 2022-2032 ($MILLION)
- TABLE 02. PRESS BRAKES MARKET FOR HYDRAULIC, BY REGION, 2022-2032 ($MILLION)
- TABLE 03. PRESS BRAKES MARKET FOR HYBRID, BY REGION, 2022-2032 ($MILLION)
- TABLE 04. PRESS BRAKES MARKET FOR SERVO-ELECTRIC, BY REGION, 2022-2032 ($MILLION)
- TABLE 05. PRESS BRAKES MARKET FOR OTHERS, BY REGION, 2022-2032 ($MILLION)
- TABLE 06. GLOBAL PRESS BRAKES MARKET, BY POWER SOURCE, 2022-2032 ($MILLION)
- TABLE 07. PRESS BRAKES MARKET FOR ELECTRIC, BY REGION, 2022-2032 ($MILLION)
- TABLE 08. PRESS BRAKES MARKET FOR HYDRAULIC, BY REGION, 2022-2032 ($MILLION)
- TABLE 09. GLOBAL PRESS BRAKES MARKET, BY AXIS, 2022-2032 ($MILLION)
- TABLE 10. PRESS BRAKES MARKET FOR 2 TO 4 AXIS, BY REGION, 2022-2032 ($MILLION)
- TABLE 11. PRESS BRAKES MARKET FOR 4 TO 6 AXIS, BY REGION, 2022-2032 ($MILLION)
- TABLE 12. PRESS BRAKES MARKET FOR 6 TO 8 AXIS, BY REGION, 2022-2032 ($MILLION)
- TABLE 13. PRESS BRAKES MARKET, BY REGION, 2022-2032 ($MILLION)
- TABLE 14. NORTH AMERICA PRESS BRAKES MARKET, BY PRODUCT TYPE, 2022-2032 ($MILLION)
- TABLE 15. NORTH AMERICA PRESS BRAKES MARKET, BY POWER SOURCE, 2022-2032 ($MILLION)
- TABLE 16. NORTH AMERICA PRESS BRAKES MARKET, BY AXIS, 2022-2032 ($MILLION)
- TABLE 17. NORTH AMERICA PRESS BRAKES MARKET, BY COUNTRY, 2022-2032 ($MILLION)
- TABLE 18. U.S. PRESS BRAKES MARKET, BY PRODUCT TYPE, 2022-2032 ($MILLION)
- TABLE 19. U.S. PRESS BRAKES MARKET, BY POWER SOURCE, 2022-2032 ($MILLION)
- TABLE 20. U.S. PRESS BRAKES MARKET, BY AXIS, 2022-2032 ($MILLION)
- TABLE 21. CANADA PRESS BRAKES MARKET, BY PRODUCT TYPE, 2022-2032 ($MILLION)
- TABLE 22. CANADA PRESS BRAKES MARKET, BY POWER SOURCE, 2022-2032 ($MILLION)
- TABLE 23. CANADA PRESS BRAKES MARKET, BY AXIS, 2022-2032 ($MILLION)
- TABLE 24. MEXICO PRESS BRAKES MARKET, BY PRODUCT TYPE, 2022-2032 ($MILLION)
- TABLE 25. MEXICO PRESS BRAKES MARKET, BY POWER SOURCE, 2022-2032 ($MILLION)
- TABLE 26. MEXICO PRESS BRAKES MARKET, BY AXIS, 2022-2032 ($MILLION)
- TABLE 27. EUROPE PRESS BRAKES MARKET, BY PRODUCT TYPE, 2022-2032 ($MILLION)
- TABLE 28. EUROPE PRESS BRAKES MARKET, BY POWER SOURCE, 2022-2032 ($MILLION)
- TABLE 29. EUROPE PRESS BRAKES MARKET, BY AXIS, 2022-2032 ($MILLION)
- TABLE 30. EUROPE PRESS BRAKES MARKET, BY COUNTRY, 2022-2032 ($MILLION)
- TABLE 31. GERMANY PRESS BRAKES MARKET, BY PRODUCT TYPE, 2022-2032 ($MILLION)
- TABLE 32. GERMANY PRESS BRAKES MARKET, BY POWER SOURCE, 2022-2032 ($MILLION)
- TABLE 33. GERMANY PRESS BRAKES MARKET, BY AXIS, 2022-2032 ($MILLION)
- TABLE 34. FRANCE PRESS BRAKES MARKET, BY PRODUCT TYPE, 2022-2032 ($MILLION)
- TABLE 35. FRANCE PRESS BRAKES MARKET, BY POWER SOURCE, 2022-2032 ($MILLION)
- TABLE 36. FRANCE PRESS BRAKES MARKET, BY AXIS, 2022-2032 ($MILLION)
- TABLE 37. ITALY PRESS BRAKES MARKET, BY PRODUCT TYPE, 2022-2032 ($MILLION)
- TABLE 38. ITALY PRESS BRAKES MARKET, BY POWER SOURCE, 2022-2032 ($MILLION)
- TABLE 39. ITALY PRESS BRAKES MARKET, BY AXIS, 2022-2032 ($MILLION)
- TABLE 40. UK PRESS BRAKES MARKET, BY PRODUCT TYPE, 2022-2032 ($MILLION)
- TABLE 41. UK PRESS BRAKES MARKET, BY POWER SOURCE, 2022-2032 ($MILLION)
- TABLE 42. UK PRESS BRAKES MARKET, BY AXIS, 2022-2032 ($MILLION)
- TABLE 43. REST OF EUROPE PRESS BRAKES MARKET, BY PRODUCT TYPE, 2022-2032 ($MILLION)
- TABLE 44. REST OF EUROPE PRESS BRAKES MARKET, BY POWER SOURCE, 2022-2032 ($MILLION)
- TABLE 45. REST OF EUROPE PRESS BRAKES MARKET, BY AXIS, 2022-2032 ($MILLION)
- TABLE 46. ASIA-PACIFIC PRESS BRAKES MARKET, BY PRODUCT TYPE, 2022-2032 ($MILLION)
- TABLE 47. ASIA-PACIFIC PRESS BRAKES MARKET, BY POWER SOURCE, 2022-2032 ($MILLION)
- TABLE 48. ASIA-PACIFIC PRESS BRAKES MARKET, BY AXIS, 2022-2032 ($MILLION)
- TABLE 49. ASIA-PACIFIC PRESS BRAKES MARKET, BY COUNTRY, 2022-2032 ($MILLION)
- TABLE 50. CHINA PRESS BRAKES MARKET, BY PRODUCT TYPE, 2022-2032 ($MILLION)
- TABLE 51. CHINA PRESS BRAKES MARKET, BY POWER SOURCE, 2022-2032 ($MILLION)
- TABLE 52. CHINA PRESS BRAKES MARKET, BY AXIS, 2022-2032 ($MILLION)
- TABLE 53. JAPAN PRESS BRAKES MARKET, BY PRODUCT TYPE, 2022-2032 ($MILLION)
- TABLE 54. JAPAN PRESS BRAKES MARKET, BY POWER SOURCE, 2022-2032 ($MILLION)
- TABLE 55. JAPAN PRESS BRAKES MARKET, BY AXIS, 2022-2032 ($MILLION)
- TABLE 56. INDIA PRESS BRAKES MARKET, BY PRODUCT TYPE, 2022-2032 ($MILLION)
- TABLE 57. INDIA PRESS BRAKES MARKET, BY POWER SOURCE, 2022-2032 ($MILLION)
- TABLE 58. INDIA PRESS BRAKES MARKET, BY AXIS, 2022-2032 ($MILLION)
- TABLE 59. SOUTH KOREA PRESS BRAKES MARKET, BY PRODUCT TYPE, 2022-2032 ($MILLION)
- TABLE 60. SOUTH KOREA PRESS BRAKES MARKET, BY POWER SOURCE, 2022-2032 ($MILLION)
- TABLE 61. SOUTH KOREA PRESS BRAKES MARKET, BY AXIS, 2022-2032 ($MILLION)
- TABLE 62. REST OF ASIA-PACIFIC PRESS BRAKES MARKET, BY PRODUCT TYPE, 2022-2032 ($MILLION)
- TABLE 63. REST OF ASIA-PACIFIC PRESS BRAKES MARKET, BY POWER SOURCE, 2022-2032 ($MILLION)
- TABLE 64. REST OF ASIA-PACIFIC PRESS BRAKES MARKET, BY AXIS, 2022-2032 ($MILLION)
- TABLE 65. LATIN AMERICA PRESS BRAKES MARKET, BY PRODUCT TYPE, 2022-2032 ($MILLION)
- TABLE 66. LATIN AMERICA PRESS BRAKES MARKET, BY POWER SOURCE, 2022-2032 ($MILLION)
- TABLE 67. LATIN AMERICA PRESS BRAKES MARKET, BY AXIS, 2022-2032 ($MILLION)
- TABLE 68. LATIN AMERICA PRESS BRAKES MARKET, BY COUNTRY, 2022-2032 ($MILLION)
- TABLE 69. BRAZIL PRESS BRAKES MARKET, BY PRODUCT TYPE, 2022-2032 ($MILLION)
- TABLE 70. BRAZIL PRESS BRAKES MARKET, BY POWER SOURCE, 2022-2032 ($MILLION)
- TABLE 71. BRAZIL PRESS BRAKES MARKET, BY AXIS, 2022-2032 ($MILLION)
- TABLE 72. CHILE PRESS BRAKES MARKET, BY PRODUCT TYPE, 2022-2032 ($MILLION)
- TABLE 73. CHILE PRESS BRAKES MARKET, BY POWER SOURCE, 2022-2032 ($MILLION)
- TABLE 74. CHILE PRESS BRAKES MARKET, BY AXIS, 2022-2032 ($MILLION)
- TABLE 75. REST OF LATIN AMERICA PRESS BRAKES MARKET, BY PRODUCT TYPE, 2022-2032 ($MILLION)
- TABLE 76. REST OF LATIN AMERICA PRESS BRAKES MARKET, BY POWER SOURCE, 2022-2032 ($MILLION)
- TABLE 77. REST OF LATIN AMERICA PRESS BRAKES MARKET, BY AXIS, 2022-2032 ($MILLION)
- TABLE 78. MIDDLE EAST AND AFRICA PRESS BRAKES MARKET, BY PRODUCT TYPE, 2022-2032 ($MILLION)
- TABLE 79. MIDDLE EAST AND AFRICA PRESS BRAKES MARKET, BY POWER SOURCE, 2022-2032 ($MILLION)
- TABLE 80. MIDDLE EAST AND AFRICA PRESS BRAKES MARKET, BY AXIS, 2022-2032 ($MILLION)
- TABLE 81. MIDDLE EAST AND AFRICA PRESS BRAKES MARKET, BY COUNTRY, 2022-2032 ($MILLION)
- TABLE 82. SAUDI ARABIA PRESS BRAKES MARKET, BY PRODUCT TYPE, 2022-2032 ($MILLION)
- TABLE 83. SAUDI ARABIA PRESS BRAKES MARKET, BY POWER SOURCE, 2022-2032 ($MILLION)
- TABLE 84. SAUDI ARABIA PRESS BRAKES MARKET, BY AXIS, 2022-2032 ($MILLION)
- TABLE 85. UAE PRESS BRAKES MARKET, BY PRODUCT TYPE, 2022-2032 ($MILLION)
- TABLE 86. UAE PRESS BRAKES MARKET, BY POWER SOURCE, 2022-2032 ($MILLION)
- TABLE 87. UAE PRESS BRAKES MARKET, BY AXIS, 2022-2032 ($MILLION)
- TABLE 88. NIGERIA PRESS BRAKES MARKET, BY PRODUCT TYPE, 2022-2032 ($MILLION)
- TABLE 89. NIGERIA PRESS BRAKES MARKET, BY POWER SOURCE, 2022-2032 ($MILLION)
- TABLE 90. NIGERIA PRESS BRAKES MARKET, BY AXIS, 2022-2032 ($MILLION)
- TABLE 91. SOUTH AFRICA PRESS BRAKES MARKET, BY PRODUCT TYPE, 2022-2032 ($MILLION)
- TABLE 92. SOUTH AFRICA PRESS BRAKES MARKET, BY POWER SOURCE, 2022-2032 ($MILLION)
- TABLE 93. SOUTH AFRICA PRESS BRAKES MARKET, BY AXIS, 2022-2032 ($MILLION)
- TABLE 94. REST OF MIDDLE EAST AND AFRICA PRESS BRAKES MARKET, BY PRODUCT TYPE, 2022-2032 ($MILLION)
- TABLE 95. REST OF MIDDLE EAST AND AFRICA PRESS BRAKES MARKET, BY POWER SOURCE, 2022-2032 ($MILLION)
- TABLE 96. REST OF MIDDLE EAST AND AFRICA PRESS BRAKES MARKET, BY AXIS, 2022-2032 ($MILLION)
- TABLE 97. DURMAZLAR MACHINERY INC.: KEY EXECUTIVES
- TABLE 98. DURMAZLAR MACHINERY INC.: COMPANY SNAPSHOT
- TABLE 99. DURMAZLAR MACHINERY INC.: PRODUCT SEGMENTS
- TABLE 100. DURMAZLAR MACHINERY INC.: SERVICE SEGMENTS
- TABLE 101. DURMAZLAR MACHINERY INC.: PRODUCT PORTFOLIO
- TABLE 102. DURMAZLAR MACHINERY INC.: KEY STRATERGIES
- TABLE 103. ACCURL CNC MACHINE ANHUI MANUFACTORY CO., LTD.: KEY EXECUTIVES
- TABLE 104. ACCURL CNC MACHINE ANHUI MANUFACTORY CO., LTD.: COMPANY SNAPSHOT
- TABLE 105. ACCURL CNC MACHINE ANHUI MANUFACTORY CO., LTD.: PRODUCT SEGMENTS
- TABLE 106. ACCURL CNC MACHINE ANHUI MANUFACTORY CO., LTD.: SERVICE SEGMENTS
- TABLE 107. ACCURL CNC MACHINE ANHUI MANUFACTORY CO., LTD.: PRODUCT PORTFOLIO
- TABLE 108. ACCURL CNC MACHINE ANHUI MANUFACTORY CO., LTD.: KEY STRATERGIES
- TABLE 109. AMADA COMPANY, LTD.: KEY EXECUTIVES
- TABLE 110. AMADA COMPANY, LTD.: COMPANY SNAPSHOT
- TABLE 111. AMADA COMPANY, LTD.: PRODUCT SEGMENTS
- TABLE 112. AMADA COMPANY, LTD.: SERVICE SEGMENTS
- TABLE 113. AMADA COMPANY, LTD.: PRODUCT PORTFOLIO
- TABLE 114. AMADA COMPANY, LTD.: KEY STRATERGIES
- TABLE 115. BAYKAL MAKINA SANAYI VE TICARET A.S.: KEY EXECUTIVES
- TABLE 116. BAYKAL MAKINA SANAYI VE TICARET A.S.: COMPANY SNAPSHOT
- TABLE 117. BAYKAL MAKINA SANAYI VE TICARET A.S.: PRODUCT SEGMENTS
- TABLE 118. BAYKAL MAKINA SANAYI VE TICARET A.S.: SERVICE SEGMENTS
- TABLE 119. BAYKAL MAKINA SANAYI VE TICARET A.S.: PRODUCT PORTFOLIO
- TABLE 120. BAYKAL MAKINA SANAYI VE TICARET A.S.: KEY STRATERGIES
- TABLE 121. ADH MACHINE TOOL: KEY EXECUTIVES
- TABLE 122. ADH MACHINE TOOL: COMPANY SNAPSHOT
- TABLE 123. ADH MACHINE TOOL: PRODUCT SEGMENTS
- TABLE 124. ADH MACHINE TOOL: SERVICE SEGMENTS
- TABLE 125. ADH MACHINE TOOL: PRODUCT PORTFOLIO
- TABLE 126. ADH MACHINE TOOL: KEY STRATERGIES
- TABLE 127. CINCINNATI INCORPORATED: KEY EXECUTIVES
- TABLE 128. CINCINNATI INCORPORATED: COMPANY SNAPSHOT
- TABLE 129. CINCINNATI INCORPORATED: PRODUCT SEGMENTS
- TABLE 130. CINCINNATI INCORPORATED: SERVICE SEGMENTS
- TABLE 131. CINCINNATI INCORPORATED: PRODUCT PORTFOLIO
- TABLE 132. CINCINNATI INCORPORATED: KEY STRATERGIES
- TABLE 133. DENER MAKINA: KEY EXECUTIVES
- TABLE 134. DENER MAKINA: COMPANY SNAPSHOT
- TABLE 135. DENER MAKINA: PRODUCT SEGMENTS
- TABLE 136. DENER MAKINA: SERVICE SEGMENTS
- TABLE 137. DENER MAKINA: PRODUCT PORTFOLIO
- TABLE 138. DENER MAKINA: KEY STRATERGIES
- TABLE 139. ERMAKSAN: KEY EXECUTIVES
- TABLE 140. ERMAKSAN: COMPANY SNAPSHOT
- TABLE 141. ERMAKSAN: PRODUCT SEGMENTS
- TABLE 142. ERMAKSAN: SERVICE SEGMENTS
- TABLE 143. ERMAKSAN: PRODUCT PORTFOLIO
- TABLE 144. ERMAKSAN: KEY STRATERGIES
- TABLE 145. LVD COMPANY NV: KEY EXECUTIVES
- TABLE 146. LVD COMPANY NV: COMPANY SNAPSHOT
- TABLE 147. LVD COMPANY NV: PRODUCT SEGMENTS
- TABLE 148. LVD COMPANY NV: SERVICE SEGMENTS
- TABLE 149. LVD COMPANY NV: PRODUCT PORTFOLIO
- TABLE 150. LVD COMPANY NV: KEY STRATERGIES
- TABLE 151. PRIMA INDUSTRIE SPA: KEY EXECUTIVES
- TABLE 152. PRIMA INDUSTRIE SPA: COMPANY SNAPSHOT
- TABLE 153. PRIMA INDUSTRIE SPA: PRODUCT SEGMENTS
- TABLE 154. PRIMA INDUSTRIE SPA: SERVICE SEGMENTS
- TABLE 155. PRIMA INDUSTRIE SPA: PRODUCT PORTFOLIO
- TABLE 156. PRIMA INDUSTRIE SPA: KEY STRATERGIES
LIST OF FIGURES
- FIGURE 01. PRESS BRAKES MARKET, 2022-2032
- FIGURE 02. SEGMENTATION OF PRESS BRAKES MARKET,2022-2032
- FIGURE 03. TOP IMPACTING FACTORS IN PRESS BRAKES MARKET
- FIGURE 04. TOP INVESTMENT POCKETS IN PRESS BRAKES MARKET (2023-2032)
- FIGURE 05. BARGAINING POWER OF SUPPLIERS
- FIGURE 06. BARGAINING POWER OF BUYERS
- FIGURE 07. THREAT OF SUBSTITUTION
- FIGURE 08. THREAT OF SUBSTITUTION
- FIGURE 09. COMPETITIVE RIVALRY
- FIGURE 10. GLOBAL PRESS BRAKES MARKET:DRIVERS, RESTRAINTS AND OPPORTUNITIES
- FIGURE 11. PRESS BRAKES MARKET, BY PRODUCT TYPE, 2022 AND 2032(%)
- FIGURE 12. COMPARATIVE SHARE ANALYSIS OF PRESS BRAKES MARKET FOR HYDRAULIC, BY COUNTRY 2022 AND 2032(%)
- FIGURE 13. COMPARATIVE SHARE ANALYSIS OF PRESS BRAKES MARKET FOR HYBRID, BY COUNTRY 2022 AND 2032(%)
- FIGURE 14. COMPARATIVE SHARE ANALYSIS OF PRESS BRAKES MARKET FOR SERVO-ELECTRIC, BY COUNTRY 2022 AND 2032(%)
- FIGURE 15. COMPARATIVE SHARE ANALYSIS OF PRESS BRAKES MARKET FOR OTHERS, BY COUNTRY 2022 AND 2032(%)
- FIGURE 16. PRESS BRAKES MARKET, BY POWER SOURCE, 2022 AND 2032(%)
- FIGURE 17. COMPARATIVE SHARE ANALYSIS OF PRESS BRAKES MARKET FOR ELECTRIC, BY COUNTRY 2022 AND 2032(%)
- FIGURE 18. COMPARATIVE SHARE ANALYSIS OF PRESS BRAKES MARKET FOR HYDRAULIC, BY COUNTRY 2022 AND 2032(%)
- FIGURE 19. PRESS BRAKES MARKET, BY AXIS, 2022 AND 2032(%)
- FIGURE 20. COMPARATIVE SHARE ANALYSIS OF PRESS BRAKES MARKET FOR 2 TO 4 AXIS, BY COUNTRY 2022 AND 2032(%)
- FIGURE 21. COMPARATIVE SHARE ANALYSIS OF PRESS BRAKES MARKET FOR 4 TO 6 AXIS, BY COUNTRY 2022 AND 2032(%)
- FIGURE 22. COMPARATIVE SHARE ANALYSIS OF PRESS BRAKES MARKET FOR 6 TO 8 AXIS, BY COUNTRY 2022 AND 2032(%)
- FIGURE 23. PRESS BRAKES MARKET BY REGION, 2022 AND 2032(%)
- FIGURE 24. U.S. PRESS BRAKES MARKET, 2022-2032 ($MILLION)
- FIGURE 25. CANADA PRESS BRAKES MARKET, 2022-2032 ($MILLION)
- FIGURE 26. MEXICO PRESS BRAKES MARKET, 2022-2032 ($MILLION)
- FIGURE 27. GERMANY PRESS BRAKES MARKET, 2022-2032 ($MILLION)
- FIGURE 28. FRANCE PRESS BRAKES MARKET, 2022-2032 ($MILLION)
- FIGURE 29. ITALY PRESS BRAKES MARKET, 2022-2032 ($MILLION)
- FIGURE 30. UK PRESS BRAKES MARKET, 2022-2032 ($MILLION)
- FIGURE 31. REST OF EUROPE PRESS BRAKES MARKET, 2022-2032 ($MILLION)
- FIGURE 32. CHINA PRESS BRAKES MARKET, 2022-2032 ($MILLION)
- FIGURE 33. JAPAN PRESS BRAKES MARKET, 2022-2032 ($MILLION)
- FIGURE 34. INDIA PRESS BRAKES MARKET, 2022-2032 ($MILLION)
- FIGURE 35. SOUTH KOREA PRESS BRAKES MARKET, 2022-2032 ($MILLION)
- FIGURE 36. REST OF ASIA-PACIFIC PRESS BRAKES MARKET, 2022-2032 ($MILLION)
- FIGURE 37. BRAZIL PRESS BRAKES MARKET, 2022-2032 ($MILLION)
- FIGURE 38. CHILE PRESS BRAKES MARKET, 2022-2032 ($MILLION)
- FIGURE 39. REST OF LATIN AMERICA PRESS BRAKES MARKET, 2022-2032 ($MILLION)
- FIGURE 40. SAUDI ARABIA PRESS BRAKES MARKET, 2022-2032 ($MILLION)
- FIGURE 41. UAE PRESS BRAKES MARKET, 2022-2032 ($MILLION)
- FIGURE 42. NIGERIA PRESS BRAKES MARKET, 2022-2032 ($MILLION)
- FIGURE 43. SOUTH AFRICA PRESS BRAKES MARKET, 2022-2032 ($MILLION)
- FIGURE 44. REST OF MIDDLE EAST AND AFRICA PRESS BRAKES MARKET, 2022-2032 ($MILLION)
- FIGURE 45. TOP WINNING STRATEGIES, BY YEAR
- FIGURE 46. TOP WINNING STRATEGIES, BY DEVELOPMENT
- FIGURE 47. TOP WINNING STRATEGIES, BY COMPANY
- FIGURE 48. PRODUCT MAPPING OF TOP 10 PLAYERS
- FIGURE 49. COMPETITIVE DASHBOARD
- FIGURE 50. COMPETITIVE HEATMAP: PRESS BRAKES MARKET
- FIGURE 51. TOP PLAYER POSITIONING, 2022
The global press brakes market was valued at $568.1 million in 2022, and is projected to reach $995.3 million by 2032, registering a CAGR of 5.88% from 2023 to 2032. In metal fabrication, a press brake is a pivotal machine designed for bending and shaping sheet metal with precision. Employing hydraulic or mechanical force, the press brake exerts pressure on the metal against a die, determining the final form of the workpiece. This versatile equipment is widely used for creating components with accurate bends and angles, crucial in industries ranging from electronics to furniture manufacturing. The adjustable back gauge on press brakes ensures consistency and repeatability, contributing to the efficiency and quality of metalworking processes.
Press brakes equipped with advanced automation features are at the forefront of revolutionizing sheet metal bending operations. Automation in press brakes involves the integration of robotic systems for material handling, tool changing, and even the execution of complex bending sequences. The implementation of robotic arms enhances overall efficiency by reducing manual intervention, increasing production speed, and minimizing the risk of errors. Additionally, automated press brakes contribute to improved workplace safety by mitigating the need for human operators to handle heavy materials and repetitive tasks. The synergy of automation and press brake technology is evident in the utilization of Computer Numerical Control (CNC) systems, allowing for precise programming and execution of bending sequences. This not only ensures consistent and high-quality output but also facilitates the seamless adaptation of press brakes to various manufacturing requirements. Such factors are expected to drive the growth of press brake market.
Demand for skilled labor for operating press brake system restrains the market growth. While modern press brakes are equipped with sophisticated technologies, including Computer Numerical Control (CNC) systems and automation features, their effective operation still necessitates skilled and knowledgeable operators. The shortage of qualified personnel with expertise in programming CNC controls, interpreting technical drawings, and understanding the intricacies of press brake setups poses a challenge for manufacturers. Training skilled operators requires time and resources, and the learning curve can impact production efficiency. Such factors are expected to restrain market growth.
Furthermore, the integration of Industry 4.0 technologies, presenting manufacturers with the chance to embrace smart manufacturing principles and enhance overall operational efficiency. The incorporation of Internet of Things (IoT) devices, data analytics, and connectivity features into press brake systems opens up avenues for real-time monitoring, predictive maintenance, and process optimization. By leveraging IoT sensors and connectivity, press brakes can provide valuable insights into machine performance, enabling manufacturers to monitor parameters such as bending force, tool wear, and energy consumption. For instance, in March 2022, HUI Manufacturing company has received a long-awaited delivery of Trumpf TruBend 5130 press brake. This will enhance the company's production capacity. Such factors are expected to offer lucrative growth opportunities for the market players during the forecast period.
The press brake market is segmented on the basis of product type, power source, and axis and region. By product type, the market is categorized into hydraulic, hybrid, servo-electric, and others. On the basis of power source, it is bifurcated into electric and hydraulic. As per axis, the market is categorized into 2 to 4 axis, 4 to 6 axis, 6 to 8 axis. On the basis of region, the market is analyzed across North America (the U.S., Canada, and Mexico), Europe (Germany, the UK, Italy, France, and rest of Europe), Asia-Pacific (China, Japan, India, South Korea, and rest of Asia-Pacific), LAMEA (Latin America, Middle East, Africa).
The major players that operate in the global market have adopted key strategies such as product launch, acquisition, and others to strengthen their market outreach, product portfolio and sustain the stiff competition in the market.The key players profiled in the study include Durmazlar Machinery Inc., Accurl CNC Machine Anhui Manufactory Co., Ltd., Amada Company, Ltd., Baykal Makina Sanayi ve Ticaret A.S., ADH Machine Tool, Cincinnati Incorporated, Dener Makina, Ermaksan, and LVD Company NV.
Key Benefits For Stakeholders
- This report provides a quantitative analysis of the market segments, current trends, estimations, and dynamics of the press brakes market analysis from 2022 to 2032 to identify the prevailing press brakes market opportunities.
- The market research is offered along with information related to key drivers, restraints, and opportunities.
- Porter's five forces analysis highlights the potency of buyers and suppliers to enable stakeholders make profit-oriented business decisions and strengthen their supplier-buyer network.
- In-depth analysis of the press brakes market segmentation assists to determine the prevailing market opportunities.
- Major countries in each region are mapped according to their revenue contribution to the global market.
- Market player positioning facilitates benchmarking and provides a clear understanding of the present position of the market players.
- The report includes the analysis of the regional as well as global press brakes market trends, key players, market segments, application areas, and market growth strategies.
Additional benefits you will get with this purchase are:
- Quarterly Update and* (only available with a corporate license, on listed price)
- 5 additional Company Profile of client Choice pre- or Post-purchase, as a free update.
- Free Upcoming Version on the Purchase of Five and Enterprise User License.
- 16 analyst hours of support* (post-purchase, if you find additional data requirements upon review of the report, you may receive support amounting to 16 analyst hours to solve questions, and post-sale queries)
- 15% Free Customization* (in case the scope or segment of the report does not match your requirements, 15% is equivalent to 3 working days of free work, applicable once)
- Free data Pack on the Five and Enterprise User License. (Excel version of the report)
- Free Updated report if the report is 6-12 months old or older.
- 24-hour priority response*
- Free Industry updates and white papers.
Possible Customization with this report (with additional cost and timeline, please talk to the sales executive to know more)
- Additional company profiles with specific to client's interest
- Additional country or region analysis- market size and forecast
- Expanded list for Company Profiles
- Historic market data
Key Market Segments
By Product Type
- Hydraulic
- Hybrid
- Servo-electric
- Others
By Power Source
- Electric
- Hydraulic
By Axis
- 2 to 4 Axis
- 4 to 6 Axis
- 6 to 8 Axis
By Region
- North America
- U.S.
- Canada
- Mexico
- Europe
- Germany
- France
- Italy
- UK
- Rest of Europe
- Asia-Pacific
- China
- Japan
- India
- South Korea
- Rest of Asia-Pacific
- Latin America
- Brazil
- Chile
- Rest of Latin America
- Middle East and Africa
- Saudi Arabia
- UAE
- Nigeria
- South Africa
- Rest of Middle East And Africa
Key Market Players:
- Durmazlar Machinery Inc.
- Accurl CNC Machine Anhui Manufactory Co., Ltd.
- Amada Company, Ltd.
- Baykal Makina Sanayi ve Ticaret A.S.
- ADH Machine Tool
- Cincinnati Incorporated
- Dener Makina
- ERMAKSAN
- LVD Company NV
- Prima Industrie SpA
TABLE OF CONTENTS
CHAPTER 1: INTRODUCTION
- 1.1. Report description
- 1.2. Key market segments
- 1.3. Key benefits to the stakeholders
- 1.4. Research methodology
- 1.4.1. Primary research
- 1.4.2. Secondary research
- 1.4.3. Analyst tools and models
CHAPTER 2: EXECUTIVE SUMMARY
- 2.1. CXO perspective
CHAPTER 3: MARKET OVERVIEW
- 3.1. Market definition and scope
- 3.2. Key findings
- 3.2.1. Top impacting factors
- 3.2.2. Top investment pockets
- 3.3. Porter's five forces analysis
- 3.4. Market dynamics
- 3.4.1. Drivers
- 3.4.2. Restraints
- 3.4.3. Opportunities
CHAPTER 4: PRESS BRAKES MARKET, BY PRODUCT TYPE
- 4.1. Overview
- 4.1.1. Market size and forecast
- 4.2. Hydraulic
- 4.2.1. Key market trends, growth factors and opportunities
- 4.2.2. Market size and forecast, by region
- 4.2.3. Market share analysis by country
- 4.3. Hybrid
- 4.3.1. Key market trends, growth factors and opportunities
- 4.3.2. Market size and forecast, by region
- 4.3.3. Market share analysis by country
- 4.4. Servo-electric
- 4.4.1. Key market trends, growth factors and opportunities
- 4.4.2. Market size and forecast, by region
- 4.4.3. Market share analysis by country
- 4.5. Others
- 4.5.1. Key market trends, growth factors and opportunities
- 4.5.2. Market size and forecast, by region
- 4.5.3. Market share analysis by country
CHAPTER 5: PRESS BRAKES MARKET, BY POWER SOURCE
- 5.1. Overview
- 5.1.1. Market size and forecast
- 5.2. Electric
- 5.2.1. Key market trends, growth factors and opportunities
- 5.2.2. Market size and forecast, by region
- 5.2.3. Market share analysis by country
- 5.3. Hydraulic
- 5.3.1. Key market trends, growth factors and opportunities
- 5.3.2. Market size and forecast, by region
- 5.3.3. Market share analysis by country
CHAPTER 6: PRESS BRAKES MARKET, BY AXIS
- 6.1. Overview
- 6.1.1. Market size and forecast
- 6.2. 2 to 4 Axis
- 6.2.1. Key market trends, growth factors and opportunities
- 6.2.2. Market size and forecast, by region
- 6.2.3. Market share analysis by country
- 6.3. 4 to 6 Axis
- 6.3.1. Key market trends, growth factors and opportunities
- 6.3.2. Market size and forecast, by region
- 6.3.3. Market share analysis by country
- 6.4. 6 to 8 Axis
- 6.4.1. Key market trends, growth factors and opportunities
- 6.4.2. Market size and forecast, by region
- 6.4.3. Market share analysis by country
CHAPTER 7: PRESS BRAKES MARKET, BY REGION
- 7.1. Overview
- 7.1.1. Market size and forecast By Region
- 7.2. North America
- 7.2.1. Key market trends, growth factors and opportunities
- 7.2.2. Market size and forecast, by Product Type
- 7.2.3. Market size and forecast, by Power Source
- 7.2.4. Market size and forecast, by Axis
- 7.2.5. Market size and forecast, by country
- 7.2.5.1. U.S.
- 7.2.5.1.1. Market size and forecast, by Product Type
- 7.2.5.1.2. Market size and forecast, by Power Source
- 7.2.5.1.3. Market size and forecast, by Axis
- 7.2.5.2. Canada
- 7.2.5.2.1. Market size and forecast, by Product Type
- 7.2.5.2.2. Market size and forecast, by Power Source
- 7.2.5.2.3. Market size and forecast, by Axis
- 7.2.5.3. Mexico
- 7.2.5.3.1. Market size and forecast, by Product Type
- 7.2.5.3.2. Market size and forecast, by Power Source
- 7.2.5.3.3. Market size and forecast, by Axis
- 7.3. Europe
- 7.3.1. Key market trends, growth factors and opportunities
- 7.3.2. Market size and forecast, by Product Type
- 7.3.3. Market size and forecast, by Power Source
- 7.3.4. Market size and forecast, by Axis
- 7.3.5. Market size and forecast, by country
- 7.3.5.1. Germany
- 7.3.5.1.1. Market size and forecast, by Product Type
- 7.3.5.1.2. Market size and forecast, by Power Source
- 7.3.5.1.3. Market size and forecast, by Axis
- 7.3.5.2. France
- 7.3.5.2.1. Market size and forecast, by Product Type
- 7.3.5.2.2. Market size and forecast, by Power Source
- 7.3.5.2.3. Market size and forecast, by Axis
- 7.3.5.3. Italy
- 7.3.5.3.1. Market size and forecast, by Product Type
- 7.3.5.3.2. Market size and forecast, by Power Source
- 7.3.5.3.3. Market size and forecast, by Axis
- 7.3.5.4. UK
- 7.3.5.4.1. Market size and forecast, by Product Type
- 7.3.5.4.2. Market size and forecast, by Power Source
- 7.3.5.4.3. Market size and forecast, by Axis
- 7.3.5.5. Rest of Europe
- 7.3.5.5.1. Market size and forecast, by Product Type
- 7.3.5.5.2. Market size and forecast, by Power Source
- 7.3.5.5.3. Market size and forecast, by Axis
- 7.4. Asia-Pacific
- 7.4.1. Key market trends, growth factors and opportunities
- 7.4.2. Market size and forecast, by Product Type
- 7.4.3. Market size and forecast, by Power Source
- 7.4.4. Market size and forecast, by Axis
- 7.4.5. Market size and forecast, by country
- 7.4.5.1. China
- 7.4.5.1.1. Market size and forecast, by Product Type
- 7.4.5.1.2. Market size and forecast, by Power Source
- 7.4.5.1.3. Market size and forecast, by Axis
- 7.4.5.2. Japan
- 7.4.5.2.1. Market size and forecast, by Product Type
- 7.4.5.2.2. Market size and forecast, by Power Source
- 7.4.5.2.3. Market size and forecast, by Axis
- 7.4.5.3. India
- 7.4.5.3.1. Market size and forecast, by Product Type
- 7.4.5.3.2. Market size and forecast, by Power Source
- 7.4.5.3.3. Market size and forecast, by Axis
- 7.4.5.4. South Korea
- 7.4.5.4.1. Market size and forecast, by Product Type
- 7.4.5.4.2. Market size and forecast, by Power Source
- 7.4.5.4.3. Market size and forecast, by Axis
- 7.4.5.5. Rest of Asia-Pacific
- 7.4.5.5.1. Market size and forecast, by Product Type
- 7.4.5.5.2. Market size and forecast, by Power Source
- 7.4.5.5.3. Market size and forecast, by Axis
- 7.5. Latin America
- 7.5.1. Key market trends, growth factors and opportunities
- 7.5.2. Market size and forecast, by Product Type
- 7.5.3. Market size and forecast, by Power Source
- 7.5.4. Market size and forecast, by Axis
- 7.5.5. Market size and forecast, by country
- 7.5.5.1. Brazil
- 7.5.5.1.1. Market size and forecast, by Product Type
- 7.5.5.1.2. Market size and forecast, by Power Source
- 7.5.5.1.3. Market size and forecast, by Axis
- 7.5.5.2. Chile
- 7.5.5.2.1. Market size and forecast, by Product Type
- 7.5.5.2.2. Market size and forecast, by Power Source
- 7.5.5.2.3. Market size and forecast, by Axis
- 7.5.5.3. Rest of Latin America
- 7.5.5.3.1. Market size and forecast, by Product Type
- 7.5.5.3.2. Market size and forecast, by Power Source
- 7.5.5.3.3. Market size and forecast, by Axis
- 7.6. Middle East and Africa
- 7.6.1. Key market trends, growth factors and opportunities
- 7.6.2. Market size and forecast, by Product Type
- 7.6.3. Market size and forecast, by Power Source
- 7.6.4. Market size and forecast, by Axis
- 7.6.5. Market size and forecast, by country
- 7.6.5.1. Saudi Arabia
- 7.6.5.1.1. Market size and forecast, by Product Type
- 7.6.5.1.2. Market size and forecast, by Power Source
- 7.6.5.1.3. Market size and forecast, by Axis
- 7.6.5.2. UAE
- 7.6.5.2.1. Market size and forecast, by Product Type
- 7.6.5.2.2. Market size and forecast, by Power Source
- 7.6.5.2.3. Market size and forecast, by Axis
- 7.6.5.3. Nigeria
- 7.6.5.3.1. Market size and forecast, by Product Type
- 7.6.5.3.2. Market size and forecast, by Power Source
- 7.6.5.3.3. Market size and forecast, by Axis
- 7.6.5.4. South Africa
- 7.6.5.4.1. Market size and forecast, by Product Type
- 7.6.5.4.2. Market size and forecast, by Power Source
- 7.6.5.4.3. Market size and forecast, by Axis
- 7.6.5.5. Rest of Middle East And Africa
- 7.6.5.5.1. Market size and forecast, by Product Type
- 7.6.5.5.2. Market size and forecast, by Power Source
- 7.6.5.5.3. Market size and forecast, by Axis
CHAPTER 8: COMPETITIVE LANDSCAPE
- 8.1. Introduction
- 8.2. Top winning strategies
- 8.3. Product mapping of top 10 player
- 8.4. Competitive dashboard
- 8.5. Competitive heatmap
- 8.6. Top player positioning, 2022
CHAPTER 9: COMPANY PROFILES
- 9.1. Durmazlar Machinery Inc.
- 9.1.1. Company overview
- 9.1.2. Key executives
- 9.1.3. Company snapshot
- 9.1.4. Operating business segments
- 9.1.5. Product portfolio
- 9.1.6. Business performance
- 9.1.7. Key strategic moves and developments
- 9.2. Accurl CNC Machine Anhui Manufactory Co., Ltd.
- 9.2.1. Company overview
- 9.2.2. Key executives
- 9.2.3. Company snapshot
- 9.2.4. Operating business segments
- 9.2.5. Product portfolio
- 9.2.6. Business performance
- 9.2.7. Key strategic moves and developments
- 9.3. Amada Company, Ltd.
- 9.3.1. Company overview
- 9.3.2. Key executives
- 9.3.3. Company snapshot
- 9.3.4. Operating business segments
- 9.3.5. Product portfolio
- 9.3.6. Business performance
- 9.3.7. Key strategic moves and developments
- 9.4. Baykal Makina Sanayi ve Ticaret A.S.
- 9.4.1. Company overview
- 9.4.2. Key executives
- 9.4.3. Company snapshot
- 9.4.4. Operating business segments
- 9.4.5. Product portfolio
- 9.4.6. Business performance
- 9.4.7. Key strategic moves and developments
- 9.5. ADH Machine Tool
- 9.5.1. Company overview
- 9.5.2. Key executives
- 9.5.3. Company snapshot
- 9.5.4. Operating business segments
- 9.5.5. Product portfolio
- 9.5.6. Business performance
- 9.5.7. Key strategic moves and developments
- 9.6. Cincinnati Incorporated
- 9.6.1. Company overview
- 9.6.2. Key executives
- 9.6.3. Company snapshot
- 9.6.4. Operating business segments
- 9.6.5. Product portfolio
- 9.6.6. Business performance
- 9.6.7. Key strategic moves and developments
- 9.7. Dener Makina
- 9.7.1. Company overview
- 9.7.2. Key executives
- 9.7.3. Company snapshot
- 9.7.4. Operating business segments
- 9.7.5. Product portfolio
- 9.7.6. Business performance
- 9.7.7. Key strategic moves and developments
- 9.8. ERMAKSAN
- 9.8.1. Company overview
- 9.8.2. Key executives
- 9.8.3. Company snapshot
- 9.8.4. Operating business segments
- 9.8.5. Product portfolio
- 9.8.6. Business performance
- 9.8.7. Key strategic moves and developments
- 9.9. LVD Company NV
- 9.9.1. Company overview
- 9.9.2. Key executives
- 9.9.3. Company snapshot
- 9.9.4. Operating business segments
- 9.9.5. Product portfolio
- 9.9.6. Business performance
- 9.9.7. Key strategic moves and developments
- 9.10. Prima Industrie SpA
- 9.10.1. Company overview
- 9.10.2. Key executives
- 9.10.3. Company snapshot
- 9.10.4. Operating business segments
- 9.10.5. Product portfolio
- 9.10.6. Business performance
- 9.10.7. Key strategic moves and developments
