|
|
市場調査レポート
商品コード
1472187
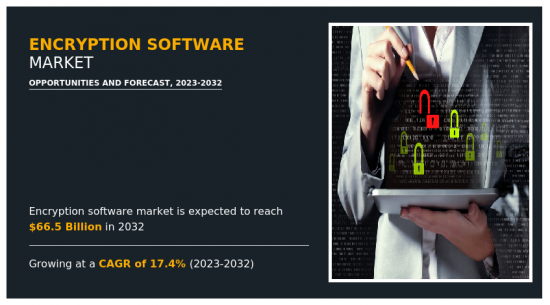
暗号化ソフトウェア市場:コンポーネント別、展開形態別、企業規模別、機能別、業界別:世界の機会分析と産業予測、2023~2032年Encryption Software Market By Component, By Deployment Mode, By Enterprise Size, By Function, By Industry Vertical : Global Opportunity Analysis and Industry Forecast, 2023-2032 |
||||||
|
|
|||||||
|
|||||||


| 暗号化ソフトウェア市場:コンポーネント別、展開形態別、企業規模別、機能別、業界別:世界の機会分析と産業予測、2023~2032年 |
|
出版日: 2024年02月01日
発行: Allied Market Research
ページ情報: 英文 280 Pages
納期: 2~3営業日
|

- 全表示
- 概要
- 図表
- 目次
暗号化ソフトウェアは、データストリームの暗号化と復号化を、静止時または転送時に支援するアプリケーションプラットフォームです。
ファイル、ネットワーク・パケット、アプリケーションのコンテンツを保護し、権限のないユーザーからのセキュリティを提供します。また、多くの組織では、組織のシステムに保存され、さまざまなネットワークを使用して送信されるデジタルデータの機密性を保護するために、暗号化ソフトウェアを採用しています。さらに、暗号化ソフトウェアは、データの完全性の向上や、従業員がリモートで作業する際のデータのセキュリティの向上など、さまざまな利点を提供します。さらに、組織のデータ・セキュリティを向上させるために中小企業で暗号化ソフトウェアが採用されていることも、市場の成長を後押ししています。さらに、暗号化ソフトウェアの主要な用途は、データ保護と機密性です。暗号化ソフトウェアは主に、機密情報や通信を暗号化された形式に変換して保護するために使用され、対応する復号化キーを持つ認可された当事者のみがアクセスまたは解読できます。この暗号化ソフトウェアの応用は、データのプライバシーを保護し、不正アクセスを防止し、データ漏洩、サイバー攻撃、情報盗難のリスクを軽減するために不可欠です。さらに、クラウド・コンピューティング・サービスの導入に伴い、暗号化ソフトウェアは、クラウドベースのアプリケーション、プラットフォーム、ストレージ・サービスに保存されたデータを暗号化するために使用されています。クラウド暗号化ソリューションは、クラウド環境内で静止中および転送中のデータを保護し、データの機密性とプライバシー規制の遵守を保証します。暗号化ソフトウェアは、ラップトップ、デスクトップ、スマートフォン、タブレットなどのエンドポイントデバイスに導入され、デバイスにローカルに保存されたデータを暗号化します。エンドポイントの暗号化は、特にデバイスの紛失や盗難の際に、不正アクセス、盗難、漏洩から機密情報を保護します。
複雑化やデータ漏洩の増加、組織におけるコンプライアンス規制の強化が、市場の成長を後押ししています。また、BYOD(Bring Your Device)の採用が急増し、モバイル性が高まっていることも市場の成長を後押ししています。しかし、暗号化ソフトウェアに対する認識不足や、一部の国では暗号化デバイスの使用が制限されていることが、市場の成長を阻害しています。さらに、クラウドベースの暗号化ソフトウェアに対する需要の高まりは、市場の成長に有利な機会を提供すると期待されています。
暗号化ソフトウェアの世界市場は、コンポーネント、展開モデル、企業規模、機能、業界、地域によって区分されます。コンポーネント別では、ソフトウェアとサービスに二分されます。展開モデル別では、市場はオンプレミスとクラウドに区分されます。組織規模別では、大企業と中小企業に二分されます。機能別では、ディスク暗号化、通信暗号化、ファイル/フォルダ暗号化、クラウド暗号化に分けられます。
業界別では、BFSI、IT/テレコム、政府・公共、小売、ヘルスケア、航空宇宙・防衛、メディア・エンターテインメント、その他に分類されます。地域別では、北米、欧州、アジア太平洋、ラテンアメリカ、中東・アフリカで分析されます。
利害関係者にとっての主なメリット
- この調査レポートは、世界の暗号化ソフトウェア市場予測を、現在および将来の動向とともに詳細に分析し、差し迫った投資ポケットについて解説しています。
- 世界の暗号化ソフトウェア市場動向に対する主要促進要因、市場抑制要因、機会およびそれらの影響分析に関する情報を提供します。
- ポーターのファイブフォース分析では、業界で活動する買い手と供給者の効力を示しています。
- 2023年から2032年までの市場の定量分析は、市場の可能性を決定するために提供されます。
本レポートのカスタマイズの可能性(追加費用とタイムラインに関しましては販売担当へご連絡ください)
- 投資機会
- 企業の市場シェア分析:製品別 / セグメント別
- 戦略的提言
- 世界 / 地域 / 国別レベルでの企業の市場シェア分析
- SWOT分析
- 数量市場規模と予測
目次
第1章 イントロダクション
第2章 エグゼクティブサマリー
第3章 市場概要
- 市場の定義と範囲
- 主な調査結果
- 主要な影響要因
- 主要な投資機会
- ポーターのファイブフォース分析
- 市場力学
- 促進要因
- データ侵害と総当たり攻撃の複雑化と量の増加
- コンプライアンス規制の強化
- クラウドと仮想化の導入の増加
- 抑制要因
- 高額な設備投資
- 一部の国では暗号化デバイスの使用が制限されている
- 機会
- モノのインターネット(IoT)技術とクラウドサービスの普及
- 暗号化チップの継続的な技術進歩
- 促進要因
第4章 暗号化ソフトウェア市場:コンポーネント別
- 概要
- ソフトウェア
- サービス
第5章 暗号化ソフトウェア市場:展開形態別
- 概要
- オンプレミス
- クラウド
第6章 暗号化ソフトウェア市場:企業規模別
- 概要
- 大企業
- 中小企業
第7章 暗号化ソフトウェア市場:機能別
- 概要
- ディスク暗号化
- 通信暗号化
- ファイル/フォルダ暗号化
- クラウド暗号化
第8章 暗号化ソフトウェア市場:業界別
- 概要
- BFSI
- IT・通信
- 政府・公共部門
- 小売
- ヘルスケア
- 航空宇宙・防衛
- メディア・娯楽
- その他
第9章 暗号化ソフトウェア市場:地域別
- 概要
- 北米
- 米国
- カナダ
- 欧州
- 英国
- ドイツ
- フランス
- イタリア
- ロシア
- その他
- アジア太平洋
- 中国
- 日本
- インド
- オーストラリア
- 韓国
- その他
- ラテンアメリカ
- ラテンアメリカ
- 中東
- アフリカ
第10章 競合情勢
- イントロダクション
- 主要成功戦略
- 主要10社の製品マッピング
- 競合ダッシュボード
- 競合ヒートマップ
- 主要企業のポジショニング、2022年
第11章 企業プロファイル
- Amazon Web Services, Inc.
- Check Point Software Technologies
- Cisco System, Inc.
- F-Secure
- Fortinet, Inc.
- IBM Corporation
- Microsoft Corporation
- Oracle Corporation
- Palo Alto Networks, Inc.
- Trend Micro Incorporated
LIST OF TABLES
- TABLE 01. GLOBAL ENCRYPTION SOFTWARE MARKET, BY COMPONENT, 2022-2032 ($MILLION)
- TABLE 02. ENCRYPTION SOFTWARE MARKET FOR SOFTWARE, BY REGION, 2022-2032 ($MILLION)
- TABLE 03. ENCRYPTION SOFTWARE MARKET FOR SERVICES, BY REGION, 2022-2032 ($MILLION)
- TABLE 04. GLOBAL ENCRYPTION SOFTWARE MARKET, BY DEPLOYMENT MODE, 2022-2032 ($MILLION)
- TABLE 05. ENCRYPTION SOFTWARE MARKET FOR ON-PREMISE, BY REGION, 2022-2032 ($MILLION)
- TABLE 06. ENCRYPTION SOFTWARE MARKET FOR CLOUD, BY REGION, 2022-2032 ($MILLION)
- TABLE 07. GLOBAL ENCRYPTION SOFTWARE MARKET, BY ENTERPRISE SIZE, 2022-2032 ($MILLION)
- TABLE 08. ENCRYPTION SOFTWARE MARKET FOR LARGE ENTERPRISE, BY REGION, 2022-2032 ($MILLION)
- TABLE 09. ENCRYPTION SOFTWARE MARKET FOR SMALL AND MEDIUM-SIZED ENTERPRISES, BY REGION, 2022-2032 ($MILLION)
- TABLE 10. GLOBAL ENCRYPTION SOFTWARE MARKET, BY FUNCTION, 2022-2032 ($MILLION)
- TABLE 11. ENCRYPTION SOFTWARE MARKET FOR DISK ENCRYPTION, BY REGION, 2022-2032 ($MILLION)
- TABLE 12. ENCRYPTION SOFTWARE MARKET FOR COMMUNICATION ENCRYPTION, BY REGION, 2022-2032 ($MILLION)
- TABLE 13. ENCRYPTION SOFTWARE MARKET FOR FILE/FOLDER ENCRYPTION, BY REGION, 2022-2032 ($MILLION)
- TABLE 14. ENCRYPTION SOFTWARE MARKET FOR CLOUD ENCRYPTION, BY REGION, 2022-2032 ($MILLION)
- TABLE 15. GLOBAL ENCRYPTION SOFTWARE MARKET, BY INDUSTRY VERTICAL, 2022-2032 ($MILLION)
- TABLE 16. ENCRYPTION SOFTWARE MARKET FOR BFSI, BY REGION, 2022-2032 ($MILLION)
- TABLE 17. ENCRYPTION SOFTWARE MARKET FOR IT AND TELECOM, BY REGION, 2022-2032 ($MILLION)
- TABLE 18. ENCRYPTION SOFTWARE MARKET FOR GOVERNMENT AND PUBLIC SECTOR, BY REGION, 2022-2032 ($MILLION)
- TABLE 19. ENCRYPTION SOFTWARE MARKET FOR RETAIL, BY REGION, 2022-2032 ($MILLION)
- TABLE 20. ENCRYPTION SOFTWARE MARKET FOR HEALTHCARE, BY REGION, 2022-2032 ($MILLION)
- TABLE 21. ENCRYPTION SOFTWARE MARKET FOR AEROSPACE AND DEFENSE, BY REGION, 2022-2032 ($MILLION)
- TABLE 22. ENCRYPTION SOFTWARE MARKET FOR MEDIA AND ENTERTAINMENT, BY REGION, 2022-2032 ($MILLION)
- TABLE 23. ENCRYPTION SOFTWARE MARKET FOR OTHERS, BY REGION, 2022-2032 ($MILLION)
- TABLE 24. ENCRYPTION SOFTWARE MARKET, BY REGION, 2022-2032 ($MILLION)
- TABLE 25. NORTH AMERICA ENCRYPTION SOFTWARE MARKET, BY COMPONENT, 2022-2032 ($MILLION)
- TABLE 26. NORTH AMERICA ENCRYPTION SOFTWARE MARKET, BY DEPLOYMENT MODE, 2022-2032 ($MILLION)
- TABLE 27. NORTH AMERICA ENCRYPTION SOFTWARE MARKET, BY ENTERPRISE SIZE, 2022-2032 ($MILLION)
- TABLE 28. NORTH AMERICA ENCRYPTION SOFTWARE MARKET, BY FUNCTION, 2022-2032 ($MILLION)
- TABLE 29. NORTH AMERICA ENCRYPTION SOFTWARE MARKET, BY INDUSTRY VERTICAL, 2022-2032 ($MILLION)
- TABLE 30. NORTH AMERICA ENCRYPTION SOFTWARE MARKET, BY COUNTRY, 2022-2032 ($MILLION)
- TABLE 31. U.S. ENCRYPTION SOFTWARE MARKET, BY COMPONENT, 2022-2032 ($MILLION)
- TABLE 32. U.S. ENCRYPTION SOFTWARE MARKET, BY DEPLOYMENT MODE, 2022-2032 ($MILLION)
- TABLE 33. U.S. ENCRYPTION SOFTWARE MARKET, BY ENTERPRISE SIZE, 2022-2032 ($MILLION)
- TABLE 34. U.S. ENCRYPTION SOFTWARE MARKET, BY FUNCTION, 2022-2032 ($MILLION)
- TABLE 35. U.S. ENCRYPTION SOFTWARE MARKET, BY INDUSTRY VERTICAL, 2022-2032 ($MILLION)
- TABLE 36. CANADA ENCRYPTION SOFTWARE MARKET, BY COMPONENT, 2022-2032 ($MILLION)
- TABLE 37. CANADA ENCRYPTION SOFTWARE MARKET, BY DEPLOYMENT MODE, 2022-2032 ($MILLION)
- TABLE 38. CANADA ENCRYPTION SOFTWARE MARKET, BY ENTERPRISE SIZE, 2022-2032 ($MILLION)
- TABLE 39. CANADA ENCRYPTION SOFTWARE MARKET, BY FUNCTION, 2022-2032 ($MILLION)
- TABLE 40. CANADA ENCRYPTION SOFTWARE MARKET, BY INDUSTRY VERTICAL, 2022-2032 ($MILLION)
- TABLE 41. EUROPE ENCRYPTION SOFTWARE MARKET, BY COMPONENT, 2022-2032 ($MILLION)
- TABLE 42. EUROPE ENCRYPTION SOFTWARE MARKET, BY DEPLOYMENT MODE, 2022-2032 ($MILLION)
- TABLE 43. EUROPE ENCRYPTION SOFTWARE MARKET, BY ENTERPRISE SIZE, 2022-2032 ($MILLION)
- TABLE 44. EUROPE ENCRYPTION SOFTWARE MARKET, BY FUNCTION, 2022-2032 ($MILLION)
- TABLE 45. EUROPE ENCRYPTION SOFTWARE MARKET, BY INDUSTRY VERTICAL, 2022-2032 ($MILLION)
- TABLE 46. EUROPE ENCRYPTION SOFTWARE MARKET, BY COUNTRY, 2022-2032 ($MILLION)
- TABLE 47. UK ENCRYPTION SOFTWARE MARKET, BY COMPONENT, 2022-2032 ($MILLION)
- TABLE 48. UK ENCRYPTION SOFTWARE MARKET, BY DEPLOYMENT MODE, 2022-2032 ($MILLION)
- TABLE 49. UK ENCRYPTION SOFTWARE MARKET, BY ENTERPRISE SIZE, 2022-2032 ($MILLION)
- TABLE 50. UK ENCRYPTION SOFTWARE MARKET, BY FUNCTION, 2022-2032 ($MILLION)
- TABLE 51. UK ENCRYPTION SOFTWARE MARKET, BY INDUSTRY VERTICAL, 2022-2032 ($MILLION)
- TABLE 52. GERMANY ENCRYPTION SOFTWARE MARKET, BY COMPONENT, 2022-2032 ($MILLION)
- TABLE 53. GERMANY ENCRYPTION SOFTWARE MARKET, BY DEPLOYMENT MODE, 2022-2032 ($MILLION)
- TABLE 54. GERMANY ENCRYPTION SOFTWARE MARKET, BY ENTERPRISE SIZE, 2022-2032 ($MILLION)
- TABLE 55. GERMANY ENCRYPTION SOFTWARE MARKET, BY FUNCTION, 2022-2032 ($MILLION)
- TABLE 56. GERMANY ENCRYPTION SOFTWARE MARKET, BY INDUSTRY VERTICAL, 2022-2032 ($MILLION)
- TABLE 57. FRANCE ENCRYPTION SOFTWARE MARKET, BY COMPONENT, 2022-2032 ($MILLION)
- TABLE 58. FRANCE ENCRYPTION SOFTWARE MARKET, BY DEPLOYMENT MODE, 2022-2032 ($MILLION)
- TABLE 59. FRANCE ENCRYPTION SOFTWARE MARKET, BY ENTERPRISE SIZE, 2022-2032 ($MILLION)
- TABLE 60. FRANCE ENCRYPTION SOFTWARE MARKET, BY FUNCTION, 2022-2032 ($MILLION)
- TABLE 61. FRANCE ENCRYPTION SOFTWARE MARKET, BY INDUSTRY VERTICAL, 2022-2032 ($MILLION)
- TABLE 62. ITALY ENCRYPTION SOFTWARE MARKET, BY COMPONENT, 2022-2032 ($MILLION)
- TABLE 63. ITALY ENCRYPTION SOFTWARE MARKET, BY DEPLOYMENT MODE, 2022-2032 ($MILLION)
- TABLE 64. ITALY ENCRYPTION SOFTWARE MARKET, BY ENTERPRISE SIZE, 2022-2032 ($MILLION)
- TABLE 65. ITALY ENCRYPTION SOFTWARE MARKET, BY FUNCTION, 2022-2032 ($MILLION)
- TABLE 66. ITALY ENCRYPTION SOFTWARE MARKET, BY INDUSTRY VERTICAL, 2022-2032 ($MILLION)
- TABLE 67. RUSSIA ENCRYPTION SOFTWARE MARKET, BY COMPONENT, 2022-2032 ($MILLION)
- TABLE 68. RUSSIA ENCRYPTION SOFTWARE MARKET, BY DEPLOYMENT MODE, 2022-2032 ($MILLION)
- TABLE 69. RUSSIA ENCRYPTION SOFTWARE MARKET, BY ENTERPRISE SIZE, 2022-2032 ($MILLION)
- TABLE 70. RUSSIA ENCRYPTION SOFTWARE MARKET, BY FUNCTION, 2022-2032 ($MILLION)
- TABLE 71. RUSSIA ENCRYPTION SOFTWARE MARKET, BY INDUSTRY VERTICAL, 2022-2032 ($MILLION)
- TABLE 72. REST OF EUROPE ENCRYPTION SOFTWARE MARKET, BY COMPONENT, 2022-2032 ($MILLION)
- TABLE 73. REST OF EUROPE ENCRYPTION SOFTWARE MARKET, BY DEPLOYMENT MODE, 2022-2032 ($MILLION)
- TABLE 74. REST OF EUROPE ENCRYPTION SOFTWARE MARKET, BY ENTERPRISE SIZE, 2022-2032 ($MILLION)
- TABLE 75. REST OF EUROPE ENCRYPTION SOFTWARE MARKET, BY FUNCTION, 2022-2032 ($MILLION)
- TABLE 76. REST OF EUROPE ENCRYPTION SOFTWARE MARKET, BY INDUSTRY VERTICAL, 2022-2032 ($MILLION)
- TABLE 77. ASIA-PACIFIC ENCRYPTION SOFTWARE MARKET, BY COMPONENT, 2022-2032 ($MILLION)
- TABLE 78. ASIA-PACIFIC ENCRYPTION SOFTWARE MARKET, BY DEPLOYMENT MODE, 2022-2032 ($MILLION)
- TABLE 79. ASIA-PACIFIC ENCRYPTION SOFTWARE MARKET, BY ENTERPRISE SIZE, 2022-2032 ($MILLION)
- TABLE 80. ASIA-PACIFIC ENCRYPTION SOFTWARE MARKET, BY FUNCTION, 2022-2032 ($MILLION)
- TABLE 81. ASIA-PACIFIC ENCRYPTION SOFTWARE MARKET, BY INDUSTRY VERTICAL, 2022-2032 ($MILLION)
- TABLE 82. ASIA-PACIFIC ENCRYPTION SOFTWARE MARKET, BY COUNTRY, 2022-2032 ($MILLION)
- TABLE 83. CHINA ENCRYPTION SOFTWARE MARKET, BY COMPONENT, 2022-2032 ($MILLION)
- TABLE 84. CHINA ENCRYPTION SOFTWARE MARKET, BY DEPLOYMENT MODE, 2022-2032 ($MILLION)
- TABLE 85. CHINA ENCRYPTION SOFTWARE MARKET, BY ENTERPRISE SIZE, 2022-2032 ($MILLION)
- TABLE 86. CHINA ENCRYPTION SOFTWARE MARKET, BY FUNCTION, 2022-2032 ($MILLION)
- TABLE 87. CHINA ENCRYPTION SOFTWARE MARKET, BY INDUSTRY VERTICAL, 2022-2032 ($MILLION)
- TABLE 88. JAPAN ENCRYPTION SOFTWARE MARKET, BY COMPONENT, 2022-2032 ($MILLION)
- TABLE 89. JAPAN ENCRYPTION SOFTWARE MARKET, BY DEPLOYMENT MODE, 2022-2032 ($MILLION)
- TABLE 90. JAPAN ENCRYPTION SOFTWARE MARKET, BY ENTERPRISE SIZE, 2022-2032 ($MILLION)
- TABLE 91. JAPAN ENCRYPTION SOFTWARE MARKET, BY FUNCTION, 2022-2032 ($MILLION)
- TABLE 92. JAPAN ENCRYPTION SOFTWARE MARKET, BY INDUSTRY VERTICAL, 2022-2032 ($MILLION)
- TABLE 93. INDIA ENCRYPTION SOFTWARE MARKET, BY COMPONENT, 2022-2032 ($MILLION)
- TABLE 94. INDIA ENCRYPTION SOFTWARE MARKET, BY DEPLOYMENT MODE, 2022-2032 ($MILLION)
- TABLE 95. INDIA ENCRYPTION SOFTWARE MARKET, BY ENTERPRISE SIZE, 2022-2032 ($MILLION)
- TABLE 96. INDIA ENCRYPTION SOFTWARE MARKET, BY FUNCTION, 2022-2032 ($MILLION)
- TABLE 97. INDIA ENCRYPTION SOFTWARE MARKET, BY INDUSTRY VERTICAL, 2022-2032 ($MILLION)
- TABLE 98. AUSTRALIA ENCRYPTION SOFTWARE MARKET, BY COMPONENT, 2022-2032 ($MILLION)
- TABLE 99. AUSTRALIA ENCRYPTION SOFTWARE MARKET, BY DEPLOYMENT MODE, 2022-2032 ($MILLION)
- TABLE 100. AUSTRALIA ENCRYPTION SOFTWARE MARKET, BY ENTERPRISE SIZE, 2022-2032 ($MILLION)
- TABLE 101. AUSTRALIA ENCRYPTION SOFTWARE MARKET, BY FUNCTION, 2022-2032 ($MILLION)
- TABLE 102. AUSTRALIA ENCRYPTION SOFTWARE MARKET, BY INDUSTRY VERTICAL, 2022-2032 ($MILLION)
- TABLE 103. SOUTH KOREA ENCRYPTION SOFTWARE MARKET, BY COMPONENT, 2022-2032 ($MILLION)
- TABLE 104. SOUTH KOREA ENCRYPTION SOFTWARE MARKET, BY DEPLOYMENT MODE, 2022-2032 ($MILLION)
- TABLE 105. SOUTH KOREA ENCRYPTION SOFTWARE MARKET, BY ENTERPRISE SIZE, 2022-2032 ($MILLION)
- TABLE 106. SOUTH KOREA ENCRYPTION SOFTWARE MARKET, BY FUNCTION, 2022-2032 ($MILLION)
- TABLE 107. SOUTH KOREA ENCRYPTION SOFTWARE MARKET, BY INDUSTRY VERTICAL, 2022-2032 ($MILLION)
- TABLE 108. REST OF ASIA-PACIFIC ENCRYPTION SOFTWARE MARKET, BY COMPONENT, 2022-2032 ($MILLION)
- TABLE 109. REST OF ASIA-PACIFIC ENCRYPTION SOFTWARE MARKET, BY DEPLOYMENT MODE, 2022-2032 ($MILLION)
- TABLE 110. REST OF ASIA-PACIFIC ENCRYPTION SOFTWARE MARKET, BY ENTERPRISE SIZE, 2022-2032 ($MILLION)
- TABLE 111. REST OF ASIA-PACIFIC ENCRYPTION SOFTWARE MARKET, BY FUNCTION, 2022-2032 ($MILLION)
- TABLE 112. REST OF ASIA-PACIFIC ENCRYPTION SOFTWARE MARKET, BY INDUSTRY VERTICAL, 2022-2032 ($MILLION)
- TABLE 113. LAMEA ENCRYPTION SOFTWARE MARKET, BY COMPONENT, 2022-2032 ($MILLION)
- TABLE 114. LAMEA ENCRYPTION SOFTWARE MARKET, BY DEPLOYMENT MODE, 2022-2032 ($MILLION)
- TABLE 115. LAMEA ENCRYPTION SOFTWARE MARKET, BY ENTERPRISE SIZE, 2022-2032 ($MILLION)
- TABLE 116. LAMEA ENCRYPTION SOFTWARE MARKET, BY FUNCTION, 2022-2032 ($MILLION)
- TABLE 117. LAMEA ENCRYPTION SOFTWARE MARKET, BY INDUSTRY VERTICAL, 2022-2032 ($MILLION)
- TABLE 118. LAMEA ENCRYPTION SOFTWARE MARKET, BY COUNTRY, 2022-2032 ($MILLION)
- TABLE 119. LATIN AMERICA ENCRYPTION SOFTWARE MARKET, BY COMPONENT, 2022-2032 ($MILLION)
- TABLE 120. LATIN AMERICA ENCRYPTION SOFTWARE MARKET, BY DEPLOYMENT MODE, 2022-2032 ($MILLION)
- TABLE 121. LATIN AMERICA ENCRYPTION SOFTWARE MARKET, BY ENTERPRISE SIZE, 2022-2032 ($MILLION)
- TABLE 122. LATIN AMERICA ENCRYPTION SOFTWARE MARKET, BY FUNCTION, 2022-2032 ($MILLION)
- TABLE 123. LATIN AMERICA ENCRYPTION SOFTWARE MARKET, BY INDUSTRY VERTICAL, 2022-2032 ($MILLION)
- TABLE 124. MIDDLE EAST ENCRYPTION SOFTWARE MARKET, BY COMPONENT, 2022-2032 ($MILLION)
- TABLE 125. MIDDLE EAST ENCRYPTION SOFTWARE MARKET, BY DEPLOYMENT MODE, 2022-2032 ($MILLION)
- TABLE 126. MIDDLE EAST ENCRYPTION SOFTWARE MARKET, BY ENTERPRISE SIZE, 2022-2032 ($MILLION)
- TABLE 127. MIDDLE EAST ENCRYPTION SOFTWARE MARKET, BY FUNCTION, 2022-2032 ($MILLION)
- TABLE 128. MIDDLE EAST ENCRYPTION SOFTWARE MARKET, BY INDUSTRY VERTICAL, 2022-2032 ($MILLION)
- TABLE 129. AFRICA ENCRYPTION SOFTWARE MARKET, BY COMPONENT, 2022-2032 ($MILLION)
- TABLE 130. AFRICA ENCRYPTION SOFTWARE MARKET, BY DEPLOYMENT MODE, 2022-2032 ($MILLION)
- TABLE 131. AFRICA ENCRYPTION SOFTWARE MARKET, BY ENTERPRISE SIZE, 2022-2032 ($MILLION)
- TABLE 132. AFRICA ENCRYPTION SOFTWARE MARKET, BY FUNCTION, 2022-2032 ($MILLION)
- TABLE 133. AFRICA ENCRYPTION SOFTWARE MARKET, BY INDUSTRY VERTICAL, 2022-2032 ($MILLION)
- TABLE 134. AMAZON WEB SERVICES, INC.: KEY EXECUTIVES
- TABLE 135. AMAZON WEB SERVICES, INC.: COMPANY SNAPSHOT
- TABLE 136. AMAZON WEB SERVICES, INC.: SERVICE SEGMENTS
- TABLE 137. AMAZON WEB SERVICES, INC.: PRODUCT PORTFOLIO
- TABLE 138. AMAZON WEB SERVICES, INC.: KEY STRATERGIES
- TABLE 139. CHECK POINT SOFTWARE TECHNOLOGIES: KEY EXECUTIVES
- TABLE 140. CHECK POINT SOFTWARE TECHNOLOGIES: COMPANY SNAPSHOT
- TABLE 141. CHECK POINT SOFTWARE TECHNOLOGIES: SERVICE SEGMENTS
- TABLE 142. CHECK POINT SOFTWARE TECHNOLOGIES: PRODUCT PORTFOLIO
- TABLE 143. CHECK POINT SOFTWARE TECHNOLOGIES: KEY STRATERGIES
- TABLE 144. CISCO SYSTEM, INC.: KEY EXECUTIVES
- TABLE 145. CISCO SYSTEM, INC.: COMPANY SNAPSHOT
- TABLE 146. CISCO SYSTEM, INC.: SERVICE SEGMENTS
- TABLE 147. CISCO SYSTEM, INC.: PRODUCT PORTFOLIO
- TABLE 148. F-SECURE: KEY EXECUTIVES
- TABLE 149. F-SECURE: COMPANY SNAPSHOT
- TABLE 150. F-SECURE: PRODUCT SEGMENTS
- TABLE 151. F-SECURE: PRODUCT PORTFOLIO
- TABLE 152. F-SECURE: KEY STRATERGIES
- TABLE 153. FORTINET, INC.: KEY EXECUTIVES
- TABLE 154. FORTINET, INC.: COMPANY SNAPSHOT
- TABLE 155. FORTINET, INC.: PRODUCT SEGMENTS
- TABLE 156. FORTINET, INC.: PRODUCT PORTFOLIO
- TABLE 157. FORTINET, INC.: KEY STRATERGIES
- TABLE 158. IBM CORPORATION: KEY EXECUTIVES
- TABLE 159. IBM CORPORATION: COMPANY SNAPSHOT
- TABLE 160. IBM CORPORATION: SERVICE SEGMENTS
- TABLE 161. IBM CORPORATION: PRODUCT PORTFOLIO
- TABLE 162. IBM CORPORATION: KEY STRATERGIES
- TABLE 163. MICROSOFT CORPORATION: KEY EXECUTIVES
- TABLE 164. MICROSOFT CORPORATION: COMPANY SNAPSHOT
- TABLE 165. MICROSOFT CORPORATION: SERVICE SEGMENTS
- TABLE 166. MICROSOFT CORPORATION: PRODUCT PORTFOLIO
- TABLE 167. MICROSOFT CORPORATION: KEY STRATERGIES
- TABLE 168. ORACLE CORPORATION: KEY EXECUTIVES
- TABLE 169. ORACLE CORPORATION: COMPANY SNAPSHOT
- TABLE 170. ORACLE CORPORATION: SERVICE SEGMENTS
- TABLE 171. ORACLE CORPORATION: PRODUCT PORTFOLIO
- TABLE 172. ORACLE CORPORATION: KEY STRATERGIES
- TABLE 173. PALO ALTO NETWORKS, INC.: KEY EXECUTIVES
- TABLE 174. PALO ALTO NETWORKS, INC.: COMPANY SNAPSHOT
- TABLE 175. PALO ALTO NETWORKS, INC.: PRODUCT SEGMENTS
- TABLE 176. PALO ALTO NETWORKS, INC.: PRODUCT PORTFOLIO
- TABLE 177. PALO ALTO NETWORKS, INC.: KEY STRATERGIES
- TABLE 178. TREND MICRO INCORPORATED: KEY EXECUTIVES
- TABLE 179. TREND MICRO INCORPORATED: COMPANY SNAPSHOT
- TABLE 180. TREND MICRO INCORPORATED: PRODUCT SEGMENTS
- TABLE 181. TREND MICRO INCORPORATED: PRODUCT PORTFOLIO
- TABLE 182. TREND MICRO INCORPORATED: KEY STRATERGIES
LIST OF FIGURES
- FIGURE 01. ENCRYPTION SOFTWARE MARKET, 2022-2032
- FIGURE 02. SEGMENTATION OF ENCRYPTION SOFTWARE MARKET,2022-2032
- FIGURE 03. TOP IMPACTING FACTORS IN ENCRYPTION SOFTWARE MARKET (2022 TO 2032)
- FIGURE 04. TOP INVESTMENT POCKETS IN ENCRYPTION SOFTWARE MARKET (2023-2032)
- FIGURE 05. LOW BARGAINING POWER OF SUPPLIERS
- FIGURE 06. LOW THREAT OF NEW ENTRANTS
- FIGURE 07. LOW THREAT OF SUBSTITUTES
- FIGURE 08. LOW INTENSITY OF RIVALRY
- FIGURE 09. LOW BARGAINING POWER OF BUYERS
- FIGURE 10. GLOBAL ENCRYPTION SOFTWARE MARKET:DRIVERS, RESTRAINTS AND OPPORTUNITIES
- FIGURE 11. ENCRYPTION SOFTWARE MARKET, BY COMPONENT, 2022 AND 2032(%)
- FIGURE 12. COMPARATIVE SHARE ANALYSIS OF ENCRYPTION SOFTWARE MARKET FOR SOFTWARE, BY COUNTRY 2022 AND 2032(%)
- FIGURE 13. COMPARATIVE SHARE ANALYSIS OF ENCRYPTION SOFTWARE MARKET FOR SERVICES, BY COUNTRY 2022 AND 2032(%)
- FIGURE 14. ENCRYPTION SOFTWARE MARKET, BY DEPLOYMENT MODE, 2022 AND 2032(%)
- FIGURE 15. COMPARATIVE SHARE ANALYSIS OF ENCRYPTION SOFTWARE MARKET FOR ON-PREMISE, BY COUNTRY 2022 AND 2032(%)
- FIGURE 16. COMPARATIVE SHARE ANALYSIS OF ENCRYPTION SOFTWARE MARKET FOR CLOUD, BY COUNTRY 2022 AND 2032(%)
- FIGURE 17. ENCRYPTION SOFTWARE MARKET, BY ENTERPRISE SIZE, 2022 AND 2032(%)
- FIGURE 18. COMPARATIVE SHARE ANALYSIS OF ENCRYPTION SOFTWARE MARKET FOR LARGE ENTERPRISE, BY COUNTRY 2022 AND 2032(%)
- FIGURE 19. COMPARATIVE SHARE ANALYSIS OF ENCRYPTION SOFTWARE MARKET FOR SMALL AND MEDIUM-SIZED ENTERPRISES, BY COUNTRY 2022 AND 2032(%)
- FIGURE 20. ENCRYPTION SOFTWARE MARKET, BY FUNCTION, 2022 AND 2032(%)
- FIGURE 21. COMPARATIVE SHARE ANALYSIS OF ENCRYPTION SOFTWARE MARKET FOR DISK ENCRYPTION, BY COUNTRY 2022 AND 2032(%)
- FIGURE 22. COMPARATIVE SHARE ANALYSIS OF ENCRYPTION SOFTWARE MARKET FOR COMMUNICATION ENCRYPTION, BY COUNTRY 2022 AND 2032(%)
- FIGURE 23. COMPARATIVE SHARE ANALYSIS OF ENCRYPTION SOFTWARE MARKET FOR FILE/FOLDER ENCRYPTION, BY COUNTRY 2022 AND 2032(%)
- FIGURE 24. COMPARATIVE SHARE ANALYSIS OF ENCRYPTION SOFTWARE MARKET FOR CLOUD ENCRYPTION, BY COUNTRY 2022 AND 2032(%)
- FIGURE 25. ENCRYPTION SOFTWARE MARKET, BY INDUSTRY VERTICAL, 2022 AND 2032(%)
- FIGURE 26. COMPARATIVE SHARE ANALYSIS OF ENCRYPTION SOFTWARE MARKET FOR BFSI, BY COUNTRY 2022 AND 2032(%)
- FIGURE 27. COMPARATIVE SHARE ANALYSIS OF ENCRYPTION SOFTWARE MARKET FOR IT AND TELECOM, BY COUNTRY 2022 AND 2032(%)
- FIGURE 28. COMPARATIVE SHARE ANALYSIS OF ENCRYPTION SOFTWARE MARKET FOR GOVERNMENT AND PUBLIC SECTOR, BY COUNTRY 2022 AND 2032(%)
- FIGURE 29. COMPARATIVE SHARE ANALYSIS OF ENCRYPTION SOFTWARE MARKET FOR RETAIL, BY COUNTRY 2022 AND 2032(%)
- FIGURE 30. COMPARATIVE SHARE ANALYSIS OF ENCRYPTION SOFTWARE MARKET FOR HEALTHCARE, BY COUNTRY 2022 AND 2032(%)
- FIGURE 31. COMPARATIVE SHARE ANALYSIS OF ENCRYPTION SOFTWARE MARKET FOR AEROSPACE AND DEFENSE, BY COUNTRY 2022 AND 2032(%)
- FIGURE 32. COMPARATIVE SHARE ANALYSIS OF ENCRYPTION SOFTWARE MARKET FOR MEDIA AND ENTERTAINMENT, BY COUNTRY 2022 AND 2032(%)
- FIGURE 33. COMPARATIVE SHARE ANALYSIS OF ENCRYPTION SOFTWARE MARKET FOR OTHERS, BY COUNTRY 2022 AND 2032(%)
- FIGURE 34. ENCRYPTION SOFTWARE MARKET BY REGION, 2022 AND 2032(%)
- FIGURE 35. U.S. ENCRYPTION SOFTWARE MARKET, 2022-2032 ($MILLION)
- FIGURE 36. CANADA ENCRYPTION SOFTWARE MARKET, 2022-2032 ($MILLION)
- FIGURE 37. UK ENCRYPTION SOFTWARE MARKET, 2022-2032 ($MILLION)
- FIGURE 38. GERMANY ENCRYPTION SOFTWARE MARKET, 2022-2032 ($MILLION)
- FIGURE 39. FRANCE ENCRYPTION SOFTWARE MARKET, 2022-2032 ($MILLION)
- FIGURE 40. ITALY ENCRYPTION SOFTWARE MARKET, 2022-2032 ($MILLION)
- FIGURE 41. RUSSIA ENCRYPTION SOFTWARE MARKET, 2022-2032 ($MILLION)
- FIGURE 42. REST OF EUROPE ENCRYPTION SOFTWARE MARKET, 2022-2032 ($MILLION)
- FIGURE 43. CHINA ENCRYPTION SOFTWARE MARKET, 2022-2032 ($MILLION)
- FIGURE 44. JAPAN ENCRYPTION SOFTWARE MARKET, 2022-2032 ($MILLION)
- FIGURE 45. INDIA ENCRYPTION SOFTWARE MARKET, 2022-2032 ($MILLION)
- FIGURE 46. AUSTRALIA ENCRYPTION SOFTWARE MARKET, 2022-2032 ($MILLION)
- FIGURE 47. SOUTH KOREA ENCRYPTION SOFTWARE MARKET, 2022-2032 ($MILLION)
- FIGURE 48. REST OF ASIA-PACIFIC ENCRYPTION SOFTWARE MARKET, 2022-2032 ($MILLION)
- FIGURE 49. LATIN AMERICA ENCRYPTION SOFTWARE MARKET, 2022-2032 ($MILLION)
- FIGURE 50. MIDDLE EAST ENCRYPTION SOFTWARE MARKET, 2022-2032 ($MILLION)
- FIGURE 51. AFRICA ENCRYPTION SOFTWARE MARKET, 2022-2032 ($MILLION)
- FIGURE 52. TOP WINNING STRATEGIES, BY YEAR (2020-2023)
- FIGURE 53. TOP WINNING STRATEGIES, BY DEVELOPMENT (2020-2023)
- FIGURE 54. TOP WINNING STRATEGIES, BY COMPANY (2020-2023)
- FIGURE 55. PRODUCT MAPPING OF TOP 10 PLAYERS
- FIGURE 56. COMPETITIVE DASHBOARD
- FIGURE 57. COMPETITIVE HEATMAP: ENCRYPTION SOFTWARE MARKET
- FIGURE 58. TOP PLAYER POSITIONING, 2022
- FIGURE 59. AMAZON WEB SERVICES, INC.: NET REVENUE, 2020-2022 ($MILLION)
- FIGURE 60. AMAZON WEB SERVICES, INC.: REVENUE SHARE BY REGION, 2022 (%)
- FIGURE 61. AMAZON WEB SERVICES, INC.: REVENUE SHARE BY SEGMENT, 2022 (%)
- FIGURE 62. CHECK POINT SOFTWARE TECHNOLOGIES: NET REVENUE, 2020-2022 ($MILLION)
- FIGURE 63. CHECK POINT SOFTWARE TECHNOLOGIES: RESEARCH & DEVELOPMENT EXPENDITURE, 2020-2022 ($MILLION)
- FIGURE 64. CHECK POINT SOFTWARE TECHNOLOGIES: REVENUE SHARE BY SEGMENT, 2022 (%)
- FIGURE 65. CHECK POINT SOFTWARE TECHNOLOGIES: REVENUE SHARE BY REGION, 2022 (%)
- FIGURE 66. CISCO SYSTEM, INC.: RESEARCH & DEVELOPMENT EXPENDITURE, 2021-2023 ($MILLION)
- FIGURE 67. CISCO SYSTEM, INC.: NET REVENUE, 2021-2023 ($MILLION)
- FIGURE 68. CISCO SYSTEM, INC.: REVENUE SHARE BY SEGMENT, 2022 (%)
- FIGURE 69. CISCO SYSTEM, INC.: REVENUE SHARE BY REGION, 2022 (%)
- FIGURE 70. F-SECURE: NET REVENUE, 2021-2023 ($MILLION)
- FIGURE 71. F-SECURE: REVENUE SHARE BY REGION, 2021 (%)
- FIGURE 72. FORTINET, INC.: NET REVENUE, 2020-2022 ($MILLION)
- FIGURE 73. FORTINET, INC.: RESEARCH & DEVELOPMENT EXPENDITURE, 2020-2022 ($MILLION)
- FIGURE 74. FORTINET, INC.: REVENUE SHARE BY SEGMENT, 2022 (%)
- FIGURE 75. FORTINET, INC.: REVENUE SHARE BY REGION, 2022 (%)
- FIGURE 76. IBM CORPORATION: NET REVENUE, 2020-2022 ($MILLION)
- FIGURE 77. IBM CORPORATION: RESEARCH & DEVELOPMENT EXPENDITURE, 2020-2022 ($MILLION)
- FIGURE 78. IBM CORPORATION: REVENUE SHARE BY SEGMENT, 2022 (%)
- FIGURE 79. IBM CORPORATION: REVENUE SHARE BY REGION, 2021 (%)
- FIGURE 80. MICROSOFT CORPORATION: NET REVENUE, 2021-2023 ($MILLION)
- FIGURE 81. MICROSOFT CORPORATION: RESEARCH & DEVELOPMENT EXPENDITURE, 2021-2023 ($MILLION)
- FIGURE 82. MICROSOFT CORPORATION: REVENUE SHARE BY SEGMENT, 2023 (%)
- FIGURE 83. MICROSOFT CORPORATION: REVENUE SHARE BY REGION, 2023 (%)
- FIGURE 84. ORACLE CORPORATION: NET REVENUE, 2021-2023 ($MILLION)
- FIGURE 85. ORACLE CORPORATION: RESEARCH & DEVELOPMENT EXPENDITURE, 2021-2023 ($MILLION)
- FIGURE 86. ORACLE CORPORATION: REVENUE SHARE BY SEGMENT, 2023 (%)
- FIGURE 87. ORACLE CORPORATION: REVENUE SHARE BY REGION, 2023 (%)
- FIGURE 88. PALO ALTO NETWORKS, INC.: NET REVENUE, 2021-2023 ($MILLION)
- FIGURE 89. PALO ALTO NETWORKS, INC.: RESEARCH & DEVELOPMENT EXPENDITURE, 2021-2023 ($MILLION)
- FIGURE 90. PALO ALTO NETWORKS, INC.: REVENUE SHARE BY REGION, 2023 (%)
- FIGURE 91. TREND MICRO INCORPORATED: NET REVENUE, 2020-2022 ($MILLION)
- FIGURE 92. TREND MICRO INCORPORATED: REVENUE SHARE BY REGION, 2022 (%)
Encryption software is an application platform that helps in the encryption and decryption of a data stream at rest or in transit. It helps protect the content of files, network packets, and applications and provides security from unauthorized users. In addition, many organizations are adopting encryption software to protect digital data confidentiality as it is stored on the organization's systems and transmitted using different networks. Furthermore, encryption software provides different advantages such as an increase in the integrity of data and an upsurge in the security of the data when an employee is working remotely. Moreover, the adoption of encryption software among SMEs to improve the data security of the organization propels the growth of the market. Moreover, the leading application of encryption software is data protection and confidentiality. Encryption software is primarily used to secure sensitive information and communications by converting it into a coded format that can only be accessed or deciphered by authorized parties with the corresponding decryption key. This application of encryption software is essential for safeguarding data privacy, preventing unauthorized access, and mitigating the risks of data breaches, cyberattacks, and information theft. Furthermore, with the adoption of cloud computing services, encryption software is used to encrypt data stored in cloud-based applications, platforms, and storage services. Cloud encryption solutions protect data at rest and in transit within cloud environments, ensuring data confidentiality and compliance with privacy regulations. Encryption software is deployed on endpoint devices such as laptops, desktops, smartphones, and tablets to encrypt data stored locally on the device. Endpoint encryption protects sensitive information from unauthorized access, theft, or compromise, especially in the event of device loss or theft.
The rise in complexity and data breaches and increased compliance regulation among organizations drive the growth of the market. In addition, the surge in adoption of bring your device (BYOD) and increased mobility fuel the growth of the market. However, lack of awareness about encryption software and limited use of encrypted devices in some countries hampers the growth of the market. Furthermore, the rise in demand for cloud-based encryption software is expected to provide lucrative opportunities for the growth of the market.
The global encryption software market is segmented based on component, deployment model, enterprise size, function, industry vertical, and region. In terms of components, it is bifurcated into software and service. Based on the deployment model, the market is segmented into on-premises and clouds. By organization size, it is bifurcated into large enterprises and small and medium-sized enterprises (SMEs). In terms of function, the market is divided into disk encryption, communication encryption, file/folder encryption, and cloud encryption.
As per industry vertical, it is classified into BFSI, IT/telecom, government & public, retail, healthcare, aerospace & defense, media & entertainment, and others. Region-wise, it is analyzed across North America, Europe, Asia-Pacific, and LAMEA.
The key players profiled in the encryption software market analysis are Amazon Web Services, Inc. (AWS), Check Point Software Technologies, Cisco System, Inc., F-Secure, Fortinet, Inc., IBM Corporation, Microsoft Corporation, Oracle Corporation, Palo Alto Networks, Inc. and Trend Micro Incorporated BFSI.
Key Benefits For Stakeholders
- The study provides an in-depth analysis of the global encryption software market forecast along with the current and future trends to explain the imminent investment pockets.
- Information about key drivers, restraints, and opportunities and their impact analysis on global encryption software market trend is provided in the report.
- The Porter's five forces analysis illustrates the potency of the buyers and suppliers operating in the industry.
- The quantitative analysis of the market from 2023 to 2032 is provided to determine the market potential.
Additional benefits you will get with this purchase are:
- Quarterly Update and* (only available with a corporate license, on listed price)
- 5 additional Company Profile of client Choice pre- or Post-purchase, as a free update.
- Free Upcoming Version on the Purchase of Five and Enterprise User License.
- 16 analyst hours of support* (post-purchase, if you find additional data requirements upon review of the report, you may receive support amounting to 16 analyst hours to solve questions, and post-sale queries)
- 15% Free Customization* (in case the scope or segment of the report does not match your requirements, 15% is equivalent to 3 working days of free work, applicable once)
- Free data Pack on the Five and Enterprise User License. (Excel version of the report)
- Free Updated report if the report is 6-12 months old or older.
- 24-hour priority response*
- Free Industry updates and white papers.
Possible Customization with this report (with additional cost and timeline, please talk to the sales executive to know more)
- Investment Opportunities
- Market share analysis of players by products/segments
- Strategic Recommendations
- Market share analysis of players at global/region/country level
- SWOT Analysis
- Volume Market Size and Forecast
Key Market Segments
By Component
- Software
- Services
By Deployment Mode
- On-premise
- Cloud
By Enterprise Size
- Large Enterprise
- Small and Medium-sized Enterprises
By Function
- Disk Encryption
- Communication Encryption
- File/Folder Encryption
- Cloud Encryption
By Industry Vertical
- BFSI
- IT and Telecom
- Government and Public Sector
- Retail
- Healthcare
- Aerospace and Defense
- Media and Entertainment
- Others
By Region
- North America
- U.S.
- Canada
- Europe
- UK
- Germany
- France
- Italy
- Russia
- Rest of Europe
- Asia-Pacific
- China
- Japan
- India
- Australia
- South Korea
- Rest of Asia-Pacific
- LAMEA
- Latin America
- Middle East
- Africa
Key Market Players:
- IBM Corporation
- Check Point Software Technologies
- Cisco System, Inc.
- Microsoft Corporation
- Trend Micro Incorporated
- F-Secure
- Amazon Web Services, Inc.
- Palo Alto Networks, Inc.
- Fortinet, Inc.
- Oracle Corporation
TABLE OF CONTENTS
CHAPTER 1: INTRODUCTION
- 1.1. Report description
- 1.2. Key market segments
- 1.3. Key benefits to the stakeholders
- 1.4. Research methodology
- 1.4.1. Primary research
- 1.4.2. Secondary research
- 1.4.3. Analyst tools and models
CHAPTER 2: EXECUTIVE SUMMARY
- 2.1. CXO perspective
CHAPTER 3: MARKET OVERVIEW
- 3.1. Market definition and scope
- 3.2. Key findings
- 3.2.1. Top impacting factors
- 3.2.2. Top investment pockets
- 3.3. Porter's five forces analysis
- 3.3.1. Low bargaining power of suppliers
- 3.3.2. Low threat of new entrants
- 3.3.3. Low threat of substitutes
- 3.3.4. Low intensity of rivalry
- 3.3.5. Low bargaining power of buyers
- 3.4. Market dynamics
- 3.4.1. Drivers
- 3.4.1.1. Increase in complexity & volume of data breaches and brute force attacks
- 3.4.1.2. Increased compliance regulations
- 3.4.1.3. Rise in adoption of cloud and virtualization
- 3.4.2. Restraints
- 3.4.2.1. High capital investment
- 3.4.2.2. Limiting use of encrypted devices in some of the countries
- 3.4.3. Opportunities
- 3.4.3.1. Widespread adoption of Internet of Things (IoT) technology and cloud services
- 3.4.3.2. Ongoing technological advancements in encryption chip
- 3.4.1. Drivers
CHAPTER 4: ENCRYPTION SOFTWARE MARKET, BY COMPONENT
- 4.1. Overview
- 4.1.1. Market size and forecast
- 4.2. Software
- 4.2.1. Key market trends, growth factors and opportunities
- 4.2.2. Market size and forecast, by region
- 4.2.3. Market share analysis by country
- 4.3. Services
- 4.3.1. Key market trends, growth factors and opportunities
- 4.3.2. Market size and forecast, by region
- 4.3.3. Market share analysis by country
CHAPTER 5: ENCRYPTION SOFTWARE MARKET, BY DEPLOYMENT MODE
- 5.1. Overview
- 5.1.1. Market size and forecast
- 5.2. On-premise
- 5.2.1. Key market trends, growth factors and opportunities
- 5.2.2. Market size and forecast, by region
- 5.2.3. Market share analysis by country
- 5.3. Cloud
- 5.3.1. Key market trends, growth factors and opportunities
- 5.3.2. Market size and forecast, by region
- 5.3.3. Market share analysis by country
CHAPTER 6: ENCRYPTION SOFTWARE MARKET, BY ENTERPRISE SIZE
- 6.1. Overview
- 6.1.1. Market size and forecast
- 6.2. Large Enterprise
- 6.2.1. Key market trends, growth factors and opportunities
- 6.2.2. Market size and forecast, by region
- 6.2.3. Market share analysis by country
- 6.3. Small and Medium-sized Enterprises
- 6.3.1. Key market trends, growth factors and opportunities
- 6.3.2. Market size and forecast, by region
- 6.3.3. Market share analysis by country
CHAPTER 7: ENCRYPTION SOFTWARE MARKET, BY FUNCTION
- 7.1. Overview
- 7.1.1. Market size and forecast
- 7.2. Disk Encryption
- 7.2.1. Key market trends, growth factors and opportunities
- 7.2.2. Market size and forecast, by region
- 7.2.3. Market share analysis by country
- 7.3. Communication Encryption
- 7.3.1. Key market trends, growth factors and opportunities
- 7.3.2. Market size and forecast, by region
- 7.3.3. Market share analysis by country
- 7.4. File/Folder Encryption
- 7.4.1. Key market trends, growth factors and opportunities
- 7.4.2. Market size and forecast, by region
- 7.4.3. Market share analysis by country
- 7.5. Cloud Encryption
- 7.5.1. Key market trends, growth factors and opportunities
- 7.5.2. Market size and forecast, by region
- 7.5.3. Market share analysis by country
CHAPTER 8: ENCRYPTION SOFTWARE MARKET, BY INDUSTRY VERTICAL
- 8.1. Overview
- 8.1.1. Market size and forecast
- 8.2. BFSI
- 8.2.1. Key market trends, growth factors and opportunities
- 8.2.2. Market size and forecast, by region
- 8.2.3. Market share analysis by country
- 8.3. IT and Telecom
- 8.3.1. Key market trends, growth factors and opportunities
- 8.3.2. Market size and forecast, by region
- 8.3.3. Market share analysis by country
- 8.4. Government and Public Sector
- 8.4.1. Key market trends, growth factors and opportunities
- 8.4.2. Market size and forecast, by region
- 8.4.3. Market share analysis by country
- 8.5. Retail
- 8.5.1. Key market trends, growth factors and opportunities
- 8.5.2. Market size and forecast, by region
- 8.5.3. Market share analysis by country
- 8.6. Healthcare
- 8.6.1. Key market trends, growth factors and opportunities
- 8.6.2. Market size and forecast, by region
- 8.6.3. Market share analysis by country
- 8.7. Aerospace and Defense
- 8.7.1. Key market trends, growth factors and opportunities
- 8.7.2. Market size and forecast, by region
- 8.7.3. Market share analysis by country
- 8.8. Media and Entertainment
- 8.8.1. Key market trends, growth factors and opportunities
- 8.8.2. Market size and forecast, by region
- 8.8.3. Market share analysis by country
- 8.9. Others
- 8.9.1. Key market trends, growth factors and opportunities
- 8.9.2. Market size and forecast, by region
- 8.9.3. Market share analysis by country
CHAPTER 9: ENCRYPTION SOFTWARE MARKET, BY REGION
- 9.1. Overview
- 9.1.1. Market size and forecast By Region
- 9.2. North America
- 9.2.1. Key market trends, growth factors and opportunities
- 9.2.2. Market size and forecast, by Component
- 9.2.3. Market size and forecast, by Deployment Mode
- 9.2.4. Market size and forecast, by Enterprise Size
- 9.2.5. Market size and forecast, by Function
- 9.2.6. Market size and forecast, by Industry Vertical
- 9.2.7. Market size and forecast, by country
- 9.2.7.1. U.S.
- 9.2.7.1.1. Market size and forecast, by Component
- 9.2.7.1.2. Market size and forecast, by Deployment Mode
- 9.2.7.1.3. Market size and forecast, by Enterprise Size
- 9.2.7.1.4. Market size and forecast, by Function
- 9.2.7.1.5. Market size and forecast, by Industry Vertical
- 9.2.7.2. Canada
- 9.2.7.2.1. Market size and forecast, by Component
- 9.2.7.2.2. Market size and forecast, by Deployment Mode
- 9.2.7.2.3. Market size and forecast, by Enterprise Size
- 9.2.7.2.4. Market size and forecast, by Function
- 9.2.7.2.5. Market size and forecast, by Industry Vertical
- 9.3. Europe
- 9.3.1. Key market trends, growth factors and opportunities
- 9.3.2. Market size and forecast, by Component
- 9.3.3. Market size and forecast, by Deployment Mode
- 9.3.4. Market size and forecast, by Enterprise Size
- 9.3.5. Market size and forecast, by Function
- 9.3.6. Market size and forecast, by Industry Vertical
- 9.3.7. Market size and forecast, by country
- 9.3.7.1. UK
- 9.3.7.1.1. Market size and forecast, by Component
- 9.3.7.1.2. Market size and forecast, by Deployment Mode
- 9.3.7.1.3. Market size and forecast, by Enterprise Size
- 9.3.7.1.4. Market size and forecast, by Function
- 9.3.7.1.5. Market size and forecast, by Industry Vertical
- 9.3.7.2. Germany
- 9.3.7.2.1. Market size and forecast, by Component
- 9.3.7.2.2. Market size and forecast, by Deployment Mode
- 9.3.7.2.3. Market size and forecast, by Enterprise Size
- 9.3.7.2.4. Market size and forecast, by Function
- 9.3.7.2.5. Market size and forecast, by Industry Vertical
- 9.3.7.3. France
- 9.3.7.3.1. Market size and forecast, by Component
- 9.3.7.3.2. Market size and forecast, by Deployment Mode
- 9.3.7.3.3. Market size and forecast, by Enterprise Size
- 9.3.7.3.4. Market size and forecast, by Function
- 9.3.7.3.5. Market size and forecast, by Industry Vertical
- 9.3.7.4. Italy
- 9.3.7.4.1. Market size and forecast, by Component
- 9.3.7.4.2. Market size and forecast, by Deployment Mode
- 9.3.7.4.3. Market size and forecast, by Enterprise Size
- 9.3.7.4.4. Market size and forecast, by Function
- 9.3.7.4.5. Market size and forecast, by Industry Vertical
- 9.3.7.5. Russia
- 9.3.7.5.1. Market size and forecast, by Component
- 9.3.7.5.2. Market size and forecast, by Deployment Mode
- 9.3.7.5.3. Market size and forecast, by Enterprise Size
- 9.3.7.5.4. Market size and forecast, by Function
- 9.3.7.5.5. Market size and forecast, by Industry Vertical
- 9.3.7.6. Rest of Europe
- 9.3.7.6.1. Market size and forecast, by Component
- 9.3.7.6.2. Market size and forecast, by Deployment Mode
- 9.3.7.6.3. Market size and forecast, by Enterprise Size
- 9.3.7.6.4. Market size and forecast, by Function
- 9.3.7.6.5. Market size and forecast, by Industry Vertical
- 9.4. Asia-Pacific
- 9.4.1. Key market trends, growth factors and opportunities
- 9.4.2. Market size and forecast, by Component
- 9.4.3. Market size and forecast, by Deployment Mode
- 9.4.4. Market size and forecast, by Enterprise Size
- 9.4.5. Market size and forecast, by Function
- 9.4.6. Market size and forecast, by Industry Vertical
- 9.4.7. Market size and forecast, by country
- 9.4.7.1. China
- 9.4.7.1.1. Market size and forecast, by Component
- 9.4.7.1.2. Market size and forecast, by Deployment Mode
- 9.4.7.1.3. Market size and forecast, by Enterprise Size
- 9.4.7.1.4. Market size and forecast, by Function
- 9.4.7.1.5. Market size and forecast, by Industry Vertical
- 9.4.7.2. Japan
- 9.4.7.2.1. Market size and forecast, by Component
- 9.4.7.2.2. Market size and forecast, by Deployment Mode
- 9.4.7.2.3. Market size and forecast, by Enterprise Size
- 9.4.7.2.4. Market size and forecast, by Function
- 9.4.7.2.5. Market size and forecast, by Industry Vertical
- 9.4.7.3. India
- 9.4.7.3.1. Market size and forecast, by Component
- 9.4.7.3.2. Market size and forecast, by Deployment Mode
- 9.4.7.3.3. Market size and forecast, by Enterprise Size
- 9.4.7.3.4. Market size and forecast, by Function
- 9.4.7.3.5. Market size and forecast, by Industry Vertical
- 9.4.7.4. Australia
- 9.4.7.4.1. Market size and forecast, by Component
- 9.4.7.4.2. Market size and forecast, by Deployment Mode
- 9.4.7.4.3. Market size and forecast, by Enterprise Size
- 9.4.7.4.4. Market size and forecast, by Function
- 9.4.7.4.5. Market size and forecast, by Industry Vertical
- 9.4.7.5. South Korea
- 9.4.7.5.1. Market size and forecast, by Component
- 9.4.7.5.2. Market size and forecast, by Deployment Mode
- 9.4.7.5.3. Market size and forecast, by Enterprise Size
- 9.4.7.5.4. Market size and forecast, by Function
- 9.4.7.5.5. Market size and forecast, by Industry Vertical
- 9.4.7.6. Rest of Asia-Pacific
- 9.4.7.6.1. Market size and forecast, by Component
- 9.4.7.6.2. Market size and forecast, by Deployment Mode
- 9.4.7.6.3. Market size and forecast, by Enterprise Size
- 9.4.7.6.4. Market size and forecast, by Function
- 9.4.7.6.5. Market size and forecast, by Industry Vertical
- 9.5. LAMEA
- 9.5.1. Key market trends, growth factors and opportunities
- 9.5.2. Market size and forecast, by Component
- 9.5.3. Market size and forecast, by Deployment Mode
- 9.5.4. Market size and forecast, by Enterprise Size
- 9.5.5. Market size and forecast, by Function
- 9.5.6. Market size and forecast, by Industry Vertical
- 9.5.7. Market size and forecast, by country
- 9.5.7.1. Latin America
- 9.5.7.1.1. Market size and forecast, by Component
- 9.5.7.1.2. Market size and forecast, by Deployment Mode
- 9.5.7.1.3. Market size and forecast, by Enterprise Size
- 9.5.7.1.4. Market size and forecast, by Function
- 9.5.7.1.5. Market size and forecast, by Industry Vertical
- 9.5.7.2. Middle East
- 9.5.7.2.1. Market size and forecast, by Component
- 9.5.7.2.2. Market size and forecast, by Deployment Mode
- 9.5.7.2.3. Market size and forecast, by Enterprise Size
- 9.5.7.2.4. Market size and forecast, by Function
- 9.5.7.2.5. Market size and forecast, by Industry Vertical
- 9.5.7.3. Africa
- 9.5.7.3.1. Market size and forecast, by Component
- 9.5.7.3.2. Market size and forecast, by Deployment Mode
- 9.5.7.3.3. Market size and forecast, by Enterprise Size
- 9.5.7.3.4. Market size and forecast, by Function
- 9.5.7.3.5. Market size and forecast, by Industry Vertical
CHAPTER 10: COMPETITIVE LANDSCAPE
- 10.1. Introduction
- 10.2. Top winning strategies
- 10.3. Product mapping of top 10 player
- 10.4. Competitive dashboard
- 10.5. Competitive heatmap
- 10.6. Top player positioning, 2022
CHAPTER 11: COMPANY PROFILES
- 11.1. Amazon Web Services, Inc.
- 11.1.1. Company overview
- 11.1.2. Key executives
- 11.1.3. Company snapshot
- 11.1.4. Operating business segments
- 11.1.5. Product portfolio
- 11.1.6. Business performance
- 11.1.7. Key strategic moves and developments
- 11.2. Check Point Software Technologies
- 11.2.1. Company overview
- 11.2.2. Key executives
- 11.2.3. Company snapshot
- 11.2.4. Operating business segments
- 11.2.5. Product portfolio
- 11.2.6. Business performance
- 11.2.7. Key strategic moves and developments
- 11.3. Cisco System, Inc.
- 11.3.1. Company overview
- 11.3.2. Key executives
- 11.3.3. Company snapshot
- 11.3.4. Operating business segments
- 11.3.5. Product portfolio
- 11.3.6. Business performance
- 11.4. F-Secure
- 11.4.1. Company overview
- 11.4.2. Key executives
- 11.4.3. Company snapshot
- 11.4.4. Operating business segments
- 11.4.5. Product portfolio
- 11.4.6. Business performance
- 11.4.7. Key strategic moves and developments
- 11.5. Fortinet, Inc.
- 11.5.1. Company overview
- 11.5.2. Key executives
- 11.5.3. Company snapshot
- 11.5.4. Operating business segments
- 11.5.5. Product portfolio
- 11.5.6. Business performance
- 11.5.7. Key strategic moves and developments
- 11.6. IBM Corporation
- 11.6.1. Company overview
- 11.6.2. Key executives
- 11.6.3. Company snapshot
- 11.6.4. Operating business segments
- 11.6.5. Product portfolio
- 11.6.6. Business performance
- 11.6.7. Key strategic moves and developments
- 11.7. Microsoft Corporation
- 11.7.1. Company overview
- 11.7.2. Key executives
- 11.7.3. Company snapshot
- 11.7.4. Operating business segments
- 11.7.5. Product portfolio
- 11.7.6. Business performance
- 11.7.7. Key strategic moves and developments
- 11.8. Oracle Corporation
- 11.8.1. Company overview
- 11.8.2. Key executives
- 11.8.3. Company snapshot
- 11.8.4. Operating business segments
- 11.8.5. Product portfolio
- 11.8.6. Business performance
- 11.8.7. Key strategic moves and developments
- 11.9. Palo Alto Networks, Inc.
- 11.9.1. Company overview
- 11.9.2. Key executives
- 11.9.3. Company snapshot
- 11.9.4. Operating business segments
- 11.9.5. Product portfolio
- 11.9.6. Business performance
- 11.9.7. Key strategic moves and developments
- 11.10. Trend Micro Incorporated
- 11.10.1. Company overview
- 11.10.2. Key executives
- 11.10.3. Company snapshot
- 11.10.4. Operating business segments
- 11.10.5. Product portfolio
- 11.10.6. Business performance
- 11.10.7. Key strategic moves and developments
