
|
市場調査レポート
商品コード
1447177
スマートコンテナ市場:製品別、技術別、業界別、2023年~2032年の世界機会分析と産業予測Smart Container Market By Offering, By Technology (GPS, Cellular, LoRa WAN, Bluetooth Low Energy), By Industry Vertical : Global Opportunity Analysis and Industry Forecast, 2023-2032 |
||||||
|
|||||||

| スマートコンテナ市場:製品別、技術別、業界別、2023年~2032年の世界機会分析と産業予測 |
|
出版日: 2024年01月30日
発行: Allied Market Research
ページ情報: 英文 250 Pages
納期: 2~3営業日
|

- 全表示
- 概要
- 図表
- 目次
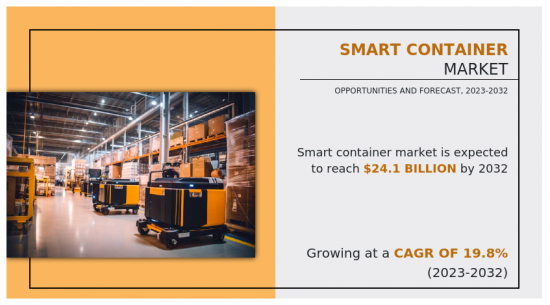
スマートコンテナとは、センサー、通信機器、データ分析機能などの統合技術を搭載した先進的で持続可能な輸送ユニットです。
これらのコンテナは、位置、温度、湿度、セキュリティ機能などの重要なパラメーターをリアルタイムで監視することができます。スマートコンテナは、モノのインターネット(IoT)技術を活用することで、サプライチェーンの可視性を高め、効率的な在庫管理を促進し、輸送中の商品の完全性を確保します。これらのコンテナによって生成されるデータは、情報に基づいた意思決定、予知保全、プロセスの最適化をサポートします。スマートコンテナは、廃棄物を最小限に抑え、エネルギー消費を削減し、現代の物流・出荷慣行における規制基準に準拠することで、持続可能な取り組みに貢献します。
世界のスマートコンテナ市場の成長は、サプライチェーンの可視性が牽引しています。世界のスマートコンテナ市場の成長は、サプライチェーンの可視性を高める必要性によって推進されています。リアルタイムのモニタリングは物流現場で最も重要となっており、スマートコンテナは位置、温度、湿度などの重要なデータへの即時アクセスを提供することで、このニーズに対応しています。これは効率的な在庫管理を促進するだけでなく、輸送中の商品の完全性を保証します。コンテナをリアルタイムで追跡・監視できる能力は、サプライチェーン全体の可視性を高め、利害関係者が情報に基づいた意思決定を迅速に行えるようにします。この可視性の向上は、業務の最適化、遅延の防止、逸脱や混乱への迅速な対応に不可欠であり、市場の持続的成長に大きく貢献します。
一方、スマートコンテナ市場の好機は、ブロックチェーンなどの新興技術の統合にあります。スマートコンテナにブロックチェーンを活用することで、サプライチェーン全体の透明性、トレーサビリティ、セキュリティを強化することができます。ブロックチェーンは、不変の分散型台帳を作成することで、コンテナの移動、温度条件、その他の重要なパラメータに関連するデータの信憑性を保証します。これにより、利害関係者間の信頼が強化されるだけでなく、不正行為や書類作成ミスのリスクも低減されます。ブロックチェーン技術の統合は、革新的なソリューションの扉を開き、世界な物流と貿易において、より弾力的で効率的なスマートコンテナエコシステムを育成します。
しかし、スマートコンテナ技術の導入に伴う初期コストの高さが、スマートコンテナ市場の成長を妨げています。センサー、IoTインフラ、通信システムを統合するための先行投資は相当な額になる可能性があり、一部の企業、特に中小企業にとっては即時導入の足かせとなっています。コスト面では、初期投資額に対する直接的なメリットを正当化することが課題となります。
スマートコンテナ市場の主な目的は、先進技術によって物流・サプライチェーン業界に革命を起こし、最適化することです。スマートコンテナは、リアルタイムのモニタリング、モノのインターネット(IoT)接続、データ分析などの機能を統合することで、効率性、透明性、安全性を高めることを目指しています。これらのコンテナにより、利害関係者は位置、温度、セキュリティ状況などの重要情報に即座にアクセスできるようになります。包括的な目標は、サプライチェーン・オペレーションを合理化し、リスクを削減し、持続可能な慣行を促進することです。スマート・コンテナ市場は、技術を活用することで世界の商品輸送を管理するためのダイナミックでインテリジェントなソリューションを提供し、最終的には業界全体のパフォーマンスを向上させることを目指しています。
スマートコンテナは、提供、技術、業界別、地域別に区分されます。サービス別では、市場はハードウェア、ソフトウェア、サービスに分けられます。技術ベースでは、市場はGPS(全地球測位システム)、セルラー、LoRa WAN(長距離広域ネットワーク)、Bluetooth Low Energyに分類されます。業界別では、市場は飲食品、医薬品、石油・ガス、化学、その他に分類されます。
地域別では、北米(米国、カナダ、メキシコ)、欧州(英国、ドイツ、フランス、イタリア、その他欧州地域)、アジア太平洋(中国、日本、インド、韓国、その他アジア太平洋地域)、ラテンアメリカ(ブラジル、アルゼンチン、その他アジア太平洋地域)、中東・アフリカ(アラブ首長国連邦、サウジアラビア、カタール、南アフリカ、その他中東・アフリカ地域)に分析されます。
利害関係者にとっての主なメリット
- 当レポートでは、2022年から2032年にかけてのスマートコンテナ市場分析の市場セグメント、現在の動向、推定・動向分析、ダイナミクスを定量的に分析し、スマートコンテナ市場の実勢機会を明らかにします。
- 市場促進要因、市場抑制要因、市場機会に関連する情報とともに市場調査を提供します。
- ポーターのファイブフォース分析では、利害関係者が利益重視のビジネス決定を下し、サプライヤーとバイヤーのネットワークを強化できるよう、バイヤーとサプライヤーの潜在力を明らかにします。
- スマートコンテナ市場のセグメンテーションの詳細な分析により、市場機会を見極めることができます。
- 各地域の主要国は、世界市場への収益貢献度に応じてマッピングされています。
- 市場プレイヤーのポジショニングはベンチマーキングを容易にし、市場プレイヤーの現在のポジションを明確に理解することができます。
- 本レポートには、地域および世界のスマートコンテナ市場動向、主要企業、市場セグメント、応用分野、市場成長戦略の分析が含まれています。
本レポートで可能なカスタマイズ(追加費用とスケジュールが必要です。)
- 製品ライフサイクル
- 製品/セグメント別の企業の市場シェア分析
- 顧客の関心に応じた企業プロファイルの追加
- 国別または地域別の追加分析-市場規模と予測
- 主要企業の詳細(所在地、連絡先、サプライヤー/ベンダーネットワークなどを含む、エクセル形式)
- 世界/地域/国別レベルでの企業の市場シェア分析
目次
第1章 イントロダクション
第2章 エグゼクティブサマリー
第3章 市場概要
- 市場の定義と範囲
- 主な調査結果
- 影響要因
- 主な投資機会
- ポーターのファイブフォース分析
- 市場力学
- 促進要因
- 抑制要因
- 機会
第4章 スマートコンテナ市場:サービス別
- 概要
- ハードウェア
- ソフトウェア
- サービス
第5章 スマートコンテナ市場:技術別
- 概要
- GPS(全地球測位システム)
- セルラー
- LoRa WAN(長距離広域ネットワーク)
- ブルートゥース・ローエナジー
第6章 スマートコンテナ市場:業界別
- 概要
- 食品・飲料
- 製薬
- 石油・ガス
- 化学
- その他
第7章 スマートコンテナ市場:地域別
- 概要
- 北米
- 米国
- カナダ
- メキシコ
- 欧州
- 英国
- ドイツ
- フランス
- イタリア
- その他
- アジア太平洋
- 中国
- 日本
- インド
- 韓国
- その他
- ラテンアメリカ
- ブラジル
- アルゼンチン
- その他のラテンアメリカ
- 中東・アフリカ
- アラブ首長国連邦
- サウジアラビア
- カタール
- 南アフリカ
- その他の中東・アフリカ
第8章 競争情勢
- イントロダクション
- 主要成功戦略
- 主要10社の製品マッピング
- 競合ダッシュボード
- 競合ヒートマップ
- 主要企業のポジショニング、2022年
第9章 企業プロファイル
- ORBCOMM Inc.
- skycell ag
- Traxens
- Phillips Connect Technologies
- Globe Tracker
- Robert Bosch
- Nexiot AG
- MSC(Mediterranean Shipping Company)
- Shenzhen joint Technology Co. Ltd.
- A.P. Moller-Maersk
LIST OF TABLES
- TABLE 01. GLOBAL SMART CONTAINER MARKET, BY OFFERING, 2022-2032 ($MILLION)
- TABLE 02. SMART CONTAINER MARKET FOR HARDWARE, BY REGION, 2022-2032 ($MILLION)
- TABLE 03. SMART CONTAINER MARKET FOR SOFTWARE, BY REGION, 2022-2032 ($MILLION)
- TABLE 04. SMART CONTAINER MARKET FOR SERVICES, BY REGION, 2022-2032 ($MILLION)
- TABLE 05. GLOBAL SMART CONTAINER MARKET, BY TECHNOLOGY, 2022-2032 ($MILLION)
- TABLE 06. SMART CONTAINER MARKET FOR GPS (GLOBAL POSITIONING SYSTEM), BY REGION, 2022-2032 ($MILLION)
- TABLE 07. SMART CONTAINER MARKET FOR CELLULAR, BY REGION, 2022-2032 ($MILLION)
- TABLE 08. SMART CONTAINER MARKET FOR LORA WAN (LONG RANGE WIDE AREA NETWORK), BY REGION, 2022-2032 ($MILLION)
- TABLE 09. SMART CONTAINER MARKET FOR BLUETOOTH LOW ENERGY, BY REGION, 2022-2032 ($MILLION)
- TABLE 10. GLOBAL SMART CONTAINER MARKET, BY INDUSTRY VERTICAL, 2022-2032 ($MILLION)
- TABLE 11. SMART CONTAINER MARKET FOR FOOD AND BEVERAGE, BY REGION, 2022-2032 ($MILLION)
- TABLE 12. SMART CONTAINER MARKET FOR PHARMACEUTICA, BY REGION, 2022-2032 ($MILLION)
- TABLE 13. SMART CONTAINER MARKET FOR OIL AND GAS, BY REGION, 2022-2032 ($MILLION)
- TABLE 14. SMART CONTAINER MARKET FOR CHEMICALS, BY REGION, 2022-2032 ($MILLION)
- TABLE 15. SMART CONTAINER MARKET FOR OTHERS, BY REGION, 2022-2032 ($MILLION)
- TABLE 16. SMART CONTAINER MARKET, BY REGION, 2022-2032 ($MILLION)
- TABLE 17. NORTH AMERICA SMART CONTAINER MARKET, BY OFFERING, 2022-2032 ($MILLION)
- TABLE 18. NORTH AMERICA SMART CONTAINER MARKET, BY TECHNOLOGY, 2022-2032 ($MILLION)
- TABLE 19. NORTH AMERICA SMART CONTAINER MARKET, BY INDUSTRY VERTICAL, 2022-2032 ($MILLION)
- TABLE 20. NORTH AMERICA SMART CONTAINER MARKET, BY COUNTRY, 2022-2032 ($MILLION)
- TABLE 21. U.S. SMART CONTAINER MARKET, BY OFFERING, 2022-2032 ($MILLION)
- TABLE 22. U.S. SMART CONTAINER MARKET, BY TECHNOLOGY, 2022-2032 ($MILLION)
- TABLE 23. U.S. SMART CONTAINER MARKET, BY INDUSTRY VERTICAL, 2022-2032 ($MILLION)
- TABLE 24. CANADA SMART CONTAINER MARKET, BY OFFERING, 2022-2032 ($MILLION)
- TABLE 25. CANADA SMART CONTAINER MARKET, BY TECHNOLOGY, 2022-2032 ($MILLION)
- TABLE 26. CANADA SMART CONTAINER MARKET, BY INDUSTRY VERTICAL, 2022-2032 ($MILLION)
- TABLE 27. MEXICO SMART CONTAINER MARKET, BY OFFERING, 2022-2032 ($MILLION)
- TABLE 28. MEXICO SMART CONTAINER MARKET, BY TECHNOLOGY, 2022-2032 ($MILLION)
- TABLE 29. MEXICO SMART CONTAINER MARKET, BY INDUSTRY VERTICAL, 2022-2032 ($MILLION)
- TABLE 30. EUROPE SMART CONTAINER MARKET, BY OFFERING, 2022-2032 ($MILLION)
- TABLE 31. EUROPE SMART CONTAINER MARKET, BY TECHNOLOGY, 2022-2032 ($MILLION)
- TABLE 32. EUROPE SMART CONTAINER MARKET, BY INDUSTRY VERTICAL, 2022-2032 ($MILLION)
- TABLE 33. EUROPE SMART CONTAINER MARKET, BY COUNTRY, 2022-2032 ($MILLION)
- TABLE 34. UK SMART CONTAINER MARKET, BY OFFERING, 2022-2032 ($MILLION)
- TABLE 35. UK SMART CONTAINER MARKET, BY TECHNOLOGY, 2022-2032 ($MILLION)
- TABLE 36. UK SMART CONTAINER MARKET, BY INDUSTRY VERTICAL, 2022-2032 ($MILLION)
- TABLE 37. GERMANY SMART CONTAINER MARKET, BY OFFERING, 2022-2032 ($MILLION)
- TABLE 38. GERMANY SMART CONTAINER MARKET, BY TECHNOLOGY, 2022-2032 ($MILLION)
- TABLE 39. GERMANY SMART CONTAINER MARKET, BY INDUSTRY VERTICAL, 2022-2032 ($MILLION)
- TABLE 40. FRANCE SMART CONTAINER MARKET, BY OFFERING, 2022-2032 ($MILLION)
- TABLE 41. FRANCE SMART CONTAINER MARKET, BY TECHNOLOGY, 2022-2032 ($MILLION)
- TABLE 42. FRANCE SMART CONTAINER MARKET, BY INDUSTRY VERTICAL, 2022-2032 ($MILLION)
- TABLE 43. ITALY SMART CONTAINER MARKET, BY OFFERING, 2022-2032 ($MILLION)
- TABLE 44. ITALY SMART CONTAINER MARKET, BY TECHNOLOGY, 2022-2032 ($MILLION)
- TABLE 45. ITALY SMART CONTAINER MARKET, BY INDUSTRY VERTICAL, 2022-2032 ($MILLION)
- TABLE 46. REST OF EUROPE SMART CONTAINER MARKET, BY OFFERING, 2022-2032 ($MILLION)
- TABLE 47. REST OF EUROPE SMART CONTAINER MARKET, BY TECHNOLOGY, 2022-2032 ($MILLION)
- TABLE 48. REST OF EUROPE SMART CONTAINER MARKET, BY INDUSTRY VERTICAL, 2022-2032 ($MILLION)
- TABLE 49. ASIA-PACIFIC SMART CONTAINER MARKET, BY OFFERING, 2022-2032 ($MILLION)
- TABLE 50. ASIA-PACIFIC SMART CONTAINER MARKET, BY TECHNOLOGY, 2022-2032 ($MILLION)
- TABLE 51. ASIA-PACIFIC SMART CONTAINER MARKET, BY INDUSTRY VERTICAL, 2022-2032 ($MILLION)
- TABLE 52. ASIA-PACIFIC SMART CONTAINER MARKET, BY COUNTRY, 2022-2032 ($MILLION)
- TABLE 53. CHINA SMART CONTAINER MARKET, BY OFFERING, 2022-2032 ($MILLION)
- TABLE 54. CHINA SMART CONTAINER MARKET, BY TECHNOLOGY, 2022-2032 ($MILLION)
- TABLE 55. CHINA SMART CONTAINER MARKET, BY INDUSTRY VERTICAL, 2022-2032 ($MILLION)
- TABLE 56. JAPAN SMART CONTAINER MARKET, BY OFFERING, 2022-2032 ($MILLION)
- TABLE 57. JAPAN SMART CONTAINER MARKET, BY TECHNOLOGY, 2022-2032 ($MILLION)
- TABLE 58. JAPAN SMART CONTAINER MARKET, BY INDUSTRY VERTICAL, 2022-2032 ($MILLION)
- TABLE 59. INDIA SMART CONTAINER MARKET, BY OFFERING, 2022-2032 ($MILLION)
- TABLE 60. INDIA SMART CONTAINER MARKET, BY TECHNOLOGY, 2022-2032 ($MILLION)
- TABLE 61. INDIA SMART CONTAINER MARKET, BY INDUSTRY VERTICAL, 2022-2032 ($MILLION)
- TABLE 62. SOUTH KOREA SMART CONTAINER MARKET, BY OFFERING, 2022-2032 ($MILLION)
- TABLE 63. SOUTH KOREA SMART CONTAINER MARKET, BY TECHNOLOGY, 2022-2032 ($MILLION)
- TABLE 64. SOUTH KOREA SMART CONTAINER MARKET, BY INDUSTRY VERTICAL, 2022-2032 ($MILLION)
- TABLE 65. REST OF ASIA-PACIFIC SMART CONTAINER MARKET, BY OFFERING, 2022-2032 ($MILLION)
- TABLE 66. REST OF ASIA-PACIFIC SMART CONTAINER MARKET, BY TECHNOLOGY, 2022-2032 ($MILLION)
- TABLE 67. REST OF ASIA-PACIFIC SMART CONTAINER MARKET, BY INDUSTRY VERTICAL, 2022-2032 ($MILLION)
- TABLE 68. LATIN AMERICA SMART CONTAINER MARKET, BY OFFERING, 2022-2032 ($MILLION)
- TABLE 69. LATIN AMERICA SMART CONTAINER MARKET, BY TECHNOLOGY, 2022-2032 ($MILLION)
- TABLE 70. LATIN AMERICA SMART CONTAINER MARKET, BY INDUSTRY VERTICAL, 2022-2032 ($MILLION)
- TABLE 71. LATIN AMERICA SMART CONTAINER MARKET, BY COUNTRY, 2022-2032 ($MILLION)
- TABLE 72. BRAZIL SMART CONTAINER MARKET, BY OFFERING, 2022-2032 ($MILLION)
- TABLE 73. BRAZIL SMART CONTAINER MARKET, BY TECHNOLOGY, 2022-2032 ($MILLION)
- TABLE 74. BRAZIL SMART CONTAINER MARKET, BY INDUSTRY VERTICAL, 2022-2032 ($MILLION)
- TABLE 75. ARGENTENA SMART CONTAINER MARKET, BY OFFERING, 2022-2032 ($MILLION)
- TABLE 76. ARGENTENA SMART CONTAINER MARKET, BY TECHNOLOGY, 2022-2032 ($MILLION)
- TABLE 77. ARGENTENA SMART CONTAINER MARKET, BY INDUSTRY VERTICAL, 2022-2032 ($MILLION)
- TABLE 78. REST OF LATIN AMERICA SMART CONTAINER MARKET, BY OFFERING, 2022-2032 ($MILLION)
- TABLE 79. REST OF LATIN AMERICA SMART CONTAINER MARKET, BY TECHNOLOGY, 2022-2032 ($MILLION)
- TABLE 80. REST OF LATIN AMERICA SMART CONTAINER MARKET, BY INDUSTRY VERTICAL, 2022-2032 ($MILLION)
- TABLE 81. MIDDLE EAST AND AFRICA SMART CONTAINER MARKET, BY OFFERING, 2022-2032 ($MILLION)
- TABLE 82. MIDDLE EAST AND AFRICA SMART CONTAINER MARKET, BY TECHNOLOGY, 2022-2032 ($MILLION)
- TABLE 83. MIDDLE EAST AND AFRICA SMART CONTAINER MARKET, BY INDUSTRY VERTICAL, 2022-2032 ($MILLION)
- TABLE 84. MIDDLE EAST AND AFRICA SMART CONTAINER MARKET, BY COUNTRY, 2022-2032 ($MILLION)
- TABLE 85. UAE SMART CONTAINER MARKET, BY OFFERING, 2022-2032 ($MILLION)
- TABLE 86. UAE SMART CONTAINER MARKET, BY TECHNOLOGY, 2022-2032 ($MILLION)
- TABLE 87. UAE SMART CONTAINER MARKET, BY INDUSTRY VERTICAL, 2022-2032 ($MILLION)
- TABLE 88. SAUDI ARABIA SMART CONTAINER MARKET, BY OFFERING, 2022-2032 ($MILLION)
- TABLE 89. SAUDI ARABIA SMART CONTAINER MARKET, BY TECHNOLOGY, 2022-2032 ($MILLION)
- TABLE 90. SAUDI ARABIA SMART CONTAINER MARKET, BY INDUSTRY VERTICAL, 2022-2032 ($MILLION)
- TABLE 91. QATAR SMART CONTAINER MARKET, BY OFFERING, 2022-2032 ($MILLION)
- TABLE 92. QATAR SMART CONTAINER MARKET, BY TECHNOLOGY, 2022-2032 ($MILLION)
- TABLE 93. QATAR SMART CONTAINER MARKET, BY INDUSTRY VERTICAL, 2022-2032 ($MILLION)
- TABLE 94. SOUTH AFRICA SMART CONTAINER MARKET, BY OFFERING, 2022-2032 ($MILLION)
- TABLE 95. SOUTH AFRICA SMART CONTAINER MARKET, BY TECHNOLOGY, 2022-2032 ($MILLION)
- TABLE 96. SOUTH AFRICA SMART CONTAINER MARKET, BY INDUSTRY VERTICAL, 2022-2032 ($MILLION)
- TABLE 97. REST OF MIDDLE EAST AND AFRICA SMART CONTAINER MARKET, BY OFFERING, 2022-2032 ($MILLION)
- TABLE 98. REST OF MIDDLE EAST AND AFRICA SMART CONTAINER MARKET, BY TECHNOLOGY, 2022-2032 ($MILLION)
- TABLE 99. REST OF MIDDLE EAST AND AFRICA SMART CONTAINER MARKET, BY INDUSTRY VERTICAL, 2022-2032 ($MILLION)
- TABLE 100. ORBCOMM INC.: KEY EXECUTIVES
- TABLE 101. ORBCOMM INC.: COMPANY SNAPSHOT
- TABLE 102. ORBCOMM INC.: PRODUCT SEGMENTS
- TABLE 103. ORBCOMM INC.: SERVICE SEGMENTS
- TABLE 104. ORBCOMM INC.: PRODUCT PORTFOLIO
- TABLE 105. ORBCOMM INC.: KEY STRATERGIES
- TABLE 106. SKYCELL AG: KEY EXECUTIVES
- TABLE 107. SKYCELL AG: COMPANY SNAPSHOT
- TABLE 108. SKYCELL AG: PRODUCT SEGMENTS
- TABLE 109. SKYCELL AG: SERVICE SEGMENTS
- TABLE 110. SKYCELL AG: PRODUCT PORTFOLIO
- TABLE 111. SKYCELL AG: KEY STRATERGIES
- TABLE 112. TRAXENS: KEY EXECUTIVES
- TABLE 113. TRAXENS: COMPANY SNAPSHOT
- TABLE 114. TRAXENS: PRODUCT SEGMENTS
- TABLE 115. TRAXENS: SERVICE SEGMENTS
- TABLE 116. TRAXENS: PRODUCT PORTFOLIO
- TABLE 117. TRAXENS: KEY STRATERGIES
- TABLE 118. PHILLIPS CONNECT TECHNOLOGIES: KEY EXECUTIVES
- TABLE 119. PHILLIPS CONNECT TECHNOLOGIES: COMPANY SNAPSHOT
- TABLE 120. PHILLIPS CONNECT TECHNOLOGIES: PRODUCT SEGMENTS
- TABLE 121. PHILLIPS CONNECT TECHNOLOGIES: SERVICE SEGMENTS
- TABLE 122. PHILLIPS CONNECT TECHNOLOGIES: PRODUCT PORTFOLIO
- TABLE 123. PHILLIPS CONNECT TECHNOLOGIES: KEY STRATERGIES
- TABLE 124. GLOBE TRACKER: KEY EXECUTIVES
- TABLE 125. GLOBE TRACKER: COMPANY SNAPSHOT
- TABLE 126. GLOBE TRACKER: PRODUCT SEGMENTS
- TABLE 127. GLOBE TRACKER: SERVICE SEGMENTS
- TABLE 128. GLOBE TRACKER: PRODUCT PORTFOLIO
- TABLE 129. GLOBE TRACKER: KEY STRATERGIES
- TABLE 130. ROBERT BOSCH: KEY EXECUTIVES
- TABLE 131. ROBERT BOSCH: COMPANY SNAPSHOT
- TABLE 132. ROBERT BOSCH: PRODUCT SEGMENTS
- TABLE 133. ROBERT BOSCH: SERVICE SEGMENTS
- TABLE 134. ROBERT BOSCH: PRODUCT PORTFOLIO
- TABLE 135. ROBERT BOSCH: KEY STRATERGIES
- TABLE 136. NEXIOT AG: KEY EXECUTIVES
- TABLE 137. NEXIOT AG: COMPANY SNAPSHOT
- TABLE 138. NEXIOT AG: PRODUCT SEGMENTS
- TABLE 139. NEXIOT AG: SERVICE SEGMENTS
- TABLE 140. NEXIOT AG: PRODUCT PORTFOLIO
- TABLE 141. NEXIOT AG: KEY STRATERGIES
- TABLE 142. MSC (MEDITERRANEAN SHIPPING COMPANY): KEY EXECUTIVES
- TABLE 143. MSC (MEDITERRANEAN SHIPPING COMPANY): COMPANY SNAPSHOT
- TABLE 144. MSC (MEDITERRANEAN SHIPPING COMPANY): PRODUCT SEGMENTS
- TABLE 145. MSC (MEDITERRANEAN SHIPPING COMPANY): SERVICE SEGMENTS
- TABLE 146. MSC (MEDITERRANEAN SHIPPING COMPANY): PRODUCT PORTFOLIO
- TABLE 147. MSC (MEDITERRANEAN SHIPPING COMPANY): KEY STRATERGIES
- TABLE 148. SHENZHEN JOINT TECHNOLOGY CO. LTD.: KEY EXECUTIVES
- TABLE 149. SHENZHEN JOINT TECHNOLOGY CO. LTD.: COMPANY SNAPSHOT
- TABLE 150. SHENZHEN JOINT TECHNOLOGY CO. LTD.: PRODUCT SEGMENTS
- TABLE 151. SHENZHEN JOINT TECHNOLOGY CO. LTD.: SERVICE SEGMENTS
- TABLE 152. SHENZHEN JOINT TECHNOLOGY CO. LTD.: PRODUCT PORTFOLIO
- TABLE 153. SHENZHEN JOINT TECHNOLOGY CO. LTD.: KEY STRATERGIES
- TABLE 154. A.P. MOLLER - MAERSK: KEY EXECUTIVES
- TABLE 155. A.P. MOLLER - MAERSK: COMPANY SNAPSHOT
- TABLE 156. A.P. MOLLER - MAERSK: PRODUCT SEGMENTS
- TABLE 157. A.P. MOLLER - MAERSK: SERVICE SEGMENTS
- TABLE 158. A.P. MOLLER - MAERSK: PRODUCT PORTFOLIO
- TABLE 159. A.P. MOLLER - MAERSK: KEY STRATERGIES
LIST OF FIGURES
- FIGURE 01. SMART CONTAINER MARKET, 2022-2032
- FIGURE 02. SEGMENTATION OF SMART CONTAINER MARKET,2022-2032
- FIGURE 03. TOP IMPACTING FACTORS IN SMART CONTAINER MARKET
- FIGURE 04. TOP INVESTMENT POCKETS IN SMART CONTAINER MARKET (2023-2032)
- FIGURE 05. BARGAINING POWER OF SUPPLIERS
- FIGURE 06. BARGAINING POWER OF BUYERS
- FIGURE 07. THREAT OF SUBSTITUTION
- FIGURE 08. THREAT OF SUBSTITUTION
- FIGURE 09. COMPETITIVE RIVALRY
- FIGURE 10. GLOBAL SMART CONTAINER MARKET:DRIVERS, RESTRAINTS AND OPPORTUNITIES
- FIGURE 11. SMART CONTAINER MARKET, BY OFFERING, 2022 AND 2032(%)
- FIGURE 12. COMPARATIVE SHARE ANALYSIS OF SMART CONTAINER MARKET FOR HARDWARE, BY COUNTRY 2022 AND 2032(%)
- FIGURE 13. COMPARATIVE SHARE ANALYSIS OF SMART CONTAINER MARKET FOR SOFTWARE, BY COUNTRY 2022 AND 2032(%)
- FIGURE 14. COMPARATIVE SHARE ANALYSIS OF SMART CONTAINER MARKET FOR SERVICES, BY COUNTRY 2022 AND 2032(%)
- FIGURE 15. SMART CONTAINER MARKET, BY TECHNOLOGY, 2022 AND 2032(%)
- FIGURE 16. COMPARATIVE SHARE ANALYSIS OF SMART CONTAINER MARKET FOR GPS (GLOBAL POSITIONING SYSTEM), BY COUNTRY 2022 AND 2032(%)
- FIGURE 17. COMPARATIVE SHARE ANALYSIS OF SMART CONTAINER MARKET FOR CELLULAR, BY COUNTRY 2022 AND 2032(%)
- FIGURE 18. COMPARATIVE SHARE ANALYSIS OF SMART CONTAINER MARKET FOR LORA WAN (LONG RANGE WIDE AREA NETWORK), BY COUNTRY 2022 AND 2032(%)
- FIGURE 19. COMPARATIVE SHARE ANALYSIS OF SMART CONTAINER MARKET FOR BLUETOOTH LOW ENERGY, BY COUNTRY 2022 AND 2032(%)
- FIGURE 20. SMART CONTAINER MARKET, BY INDUSTRY VERTICAL, 2022 AND 2032(%)
- FIGURE 21. COMPARATIVE SHARE ANALYSIS OF SMART CONTAINER MARKET FOR FOOD AND BEVERAGE, BY COUNTRY 2022 AND 2032(%)
- FIGURE 22. COMPARATIVE SHARE ANALYSIS OF SMART CONTAINER MARKET FOR PHARMACEUTICA, BY COUNTRY 2022 AND 2032(%)
- FIGURE 23. COMPARATIVE SHARE ANALYSIS OF SMART CONTAINER MARKET FOR OIL AND GAS, BY COUNTRY 2022 AND 2032(%)
- FIGURE 24. COMPARATIVE SHARE ANALYSIS OF SMART CONTAINER MARKET FOR CHEMICALS, BY COUNTRY 2022 AND 2032(%)
- FIGURE 25. COMPARATIVE SHARE ANALYSIS OF SMART CONTAINER MARKET FOR OTHERS, BY COUNTRY 2022 AND 2032(%)
- FIGURE 26. SMART CONTAINER MARKET BY REGION, 2022 AND 2032(%)
- FIGURE 27. U.S. SMART CONTAINER MARKET, 2022-2032 ($MILLION)
- FIGURE 28. CANADA SMART CONTAINER MARKET, 2022-2032 ($MILLION)
- FIGURE 29. MEXICO SMART CONTAINER MARKET, 2022-2032 ($MILLION)
- FIGURE 30. UK SMART CONTAINER MARKET, 2022-2032 ($MILLION)
- FIGURE 31. GERMANY SMART CONTAINER MARKET, 2022-2032 ($MILLION)
- FIGURE 32. FRANCE SMART CONTAINER MARKET, 2022-2032 ($MILLION)
- FIGURE 33. ITALY SMART CONTAINER MARKET, 2022-2032 ($MILLION)
- FIGURE 34. REST OF EUROPE SMART CONTAINER MARKET, 2022-2032 ($MILLION)
- FIGURE 35. CHINA SMART CONTAINER MARKET, 2022-2032 ($MILLION)
- FIGURE 36. JAPAN SMART CONTAINER MARKET, 2022-2032 ($MILLION)
- FIGURE 37. INDIA SMART CONTAINER MARKET, 2022-2032 ($MILLION)
- FIGURE 38. SOUTH KOREA SMART CONTAINER MARKET, 2022-2032 ($MILLION)
- FIGURE 39. REST OF ASIA-PACIFIC SMART CONTAINER MARKET, 2022-2032 ($MILLION)
- FIGURE 40. BRAZIL SMART CONTAINER MARKET, 2022-2032 ($MILLION)
- FIGURE 41. ARGENTENA SMART CONTAINER MARKET, 2022-2032 ($MILLION)
- FIGURE 42. REST OF LATIN AMERICA SMART CONTAINER MARKET, 2022-2032 ($MILLION)
- FIGURE 43. UAE SMART CONTAINER MARKET, 2022-2032 ($MILLION)
- FIGURE 44. SAUDI ARABIA SMART CONTAINER MARKET, 2022-2032 ($MILLION)
- FIGURE 45. QATAR SMART CONTAINER MARKET, 2022-2032 ($MILLION)
- FIGURE 46. SOUTH AFRICA SMART CONTAINER MARKET, 2022-2032 ($MILLION)
- FIGURE 47. REST OF MIDDLE EAST AND AFRICA SMART CONTAINER MARKET, 2022-2032 ($MILLION)
- FIGURE 48. TOP WINNING STRATEGIES, BY YEAR
- FIGURE 49. TOP WINNING STRATEGIES, BY DEVELOPMENT
- FIGURE 50. TOP WINNING STRATEGIES, BY COMPANY
- FIGURE 51. PRODUCT MAPPING OF TOP 10 PLAYERS
- FIGURE 52. COMPETITIVE DASHBOARD
- FIGURE 53. COMPETITIVE HEATMAP: SMART CONTAINER MARKET
- FIGURE 54. TOP PLAYER POSITIONING, 2022
A smart container is an advanced and sustainable transportation unit equipped with integrated technologies such as sensors, communication devices, and data analytics capabilities. These containers enable real-time monitoring of crucial parameters such as location, temperature, humidity, and security features. Smart containers enhance supply chain visibility, facilitate efficient inventory management, and ensure the integrity of goods during transit by leveraging Internet of Things (IoT) technology. The data generated by these containers supports informed decision-making, predictive maintenance, and process optimization. Smart containers contribute to sustainability efforts by minimizing waste, reducing energy consumption, and complying with regulatory standards in modern logistics and shipping practices.
The growth of the global smart container market is driven by supply chain visibility. The growth of the global smart container market is propelled by the imperative for heightened supply chain visibility. Real-time monitoring has become paramount in the logistics landscape, and smart containers address this need by providing instantaneous access to crucial data such as location, temperature, and humidity. This not only facilitates efficient inventory management but also ensures the integrity of goods during transit. The ability to track and monitor containers in real-time enhances overall supply chain visibility, enabling stakeholders to make informed decisions promptly. This heightened visibility is crucial for optimizing operations, preventing delays, and responding promptly to any deviations or disruptions, thus contributing significantly to the sustained growth of the market.
On the other hand, an opportunity for the smart container market lies in the integration of emerging technologies such as blockchain. The utilization of blockchain in smart containers can enhance transparency, traceability, and security across the supply chain. Blockchain ensures the authenticity of data related to container movements, temperature conditions, and other critical parameters by creating an immutable and decentralized ledger. This not only strengthens trust among stakeholders but also reduces the risk of fraud and errors in documentation. The integration of blockchain technology opens doors for innovative solutions, fostering a more resilient and efficient smart container ecosystem in global logistics and trade.
However, the initial high costs associated with implementing smart container technology hinder the growth of smart container market. The upfront investment for integrating sensors, IoT infrastructure, and communication systems can be substantial, deterring some businesses, especially smaller enterprises, from immediate adoption. The cost factor poses a challenge in justifying the immediate benefits against the initial financial outlay.
The primary objective of the smart container market is to revolutionize and optimize the logistics and supply chain industry through advanced technologies. Smart containers aim to enhance efficiency, transparency, and security by integrating features such as real-time monitoring, Internet of Things (IoT) connectivity, and data analytics. These containers enable stakeholders to gain immediate access to critical information, including location, temperature, and security status. The overarching goal is to streamline supply chain operations, reduce risks, and promote sustainable practices. The smart container market seeks to provide a dynamic and intelligent solution for managing the transportation of goods globally by leveraging technology, ultimately improving overall industry performance.
The smart container is segmented on the basis of offering, technology, industry vertical, and region. On the basis of offering, the market is divided into hardware, software, and services. On the basis of technology, the market is categorized into GPS (Global Positioning System), Cellular, LoRa WAN (Long Range Wide Area Network), and Bluetooth Low Energy. On the basis of industry vertical, the market is classified into food & beverage, pharmaceutical, oil & gas, chemicals, and others.
On the basis of region, it is analysed across North America (the U.S., Canada, and Mexico), Europe (the UK, Germany, France, Italy, and the rest of Europe), Asia-Pacific (China, Japan, India, South Korea, and rest of Asia-Pacific), Latin America (Brazil, Argentina, and Rest of Latin America), and Middle East and Africa (UAE, Saudi Arabia, Qatar, South Africa, and Rest of Middle East and Africa).
Competitive analysis and profiles of the major smart container market players, such as ORBCOMM Inc., SkyCell AG, Traxens, Phillips Connect Technologies, Globe Tracker, Robert Bosch GmbH, Nexiot AG, MSC (Mediterranean Shipping Company), Shenzhen joint Technology Co., Ltd., A.P. Moller - Maersk are provided in this report. Product launch and acquisition business strategies were adopted by the major market players in 2022.
Key Benefits For Stakeholders
- This report provides a quantitative analysis of the market segments, current trends, estimations, and dynamics of the smart container market analysis from 2022 to 2032 to identify the prevailing smart container market opportunities.
- The market research is offered along with information related to key drivers, restraints, and opportunities.
- Porter's five forces analysis highlights the potency of buyers and suppliers to enable stakeholders make profit-oriented business decisions and strengthen their supplier-buyer network.
- In-depth analysis of the smart container market segmentation assists to determine the prevailing market opportunities.
- Major countries in each region are mapped according to their revenue contribution to the global market.
- Market player positioning facilitates benchmarking and provides a clear understanding of the present position of the market players.
- The report includes the analysis of the regional as well as global smart container market trends, key players, market segments, application areas, and market growth strategies.
Additional benefits you will get with this purchase are:
- Quarterly Update and* (only available with a corporate license, on listed price)
- 5 additional Company Profile of client Choice pre- or Post-purchase, as a free update.
- Free Upcoming Version on the Purchase of Five and Enterprise User License.
- 16 analyst hours of support* (post-purchase, if you find additional data requirements upon review of the report, you may receive support amounting to 16 analyst hours to solve questions, and post-sale queries)
- 15% Free Customization* (in case the scope or segment of the report does not match your requirements, 15% is equivalent to 3 working days of free work, applicable once)
- Free data Pack on the Five and Enterprise User License. (Excel version of the report)
- Free Updated report if the report is 6-12 months old or older.
- 24-hour priority response*
- Free Industry updates and white papers.
Possible Customization with this report (with additional cost and timeline, please talk to the sales executive to know more)
- Product Life Cycles
- Market share analysis of players by products/segments
- Additional company profiles with specific to client's interest
- Additional country or region analysis- market size and forecast
- Key player details (including location, contact details, supplier/vendor network etc. in excel format)
- Market share analysis of players at global/region/country level
Key Market Segments
By Technology
- GPS (Global Positioning System)
- Cellular
- LoRa WAN (Long Range Wide Area Network)
- Bluetooth Low Energy
By Offering
- Hardware
- Software
- Services
By Industry Vertical
- Food and Beverage
- Pharmaceutica
- Oil and Gas
- Chemicals
- Others
By Region
- North America
- U.S.
- Canada
- Mexico
- Europe
- UK
- Germany
- France
- Italy
- Rest of Europe
- Asia-Pacific
- China
- Japan
- India
- South Korea
- Rest of Asia-Pacific
- Latin America
- Brazil
- Argentena
- Rest of Latin America
- Middle East and Africa
- UAE
- Saudi Arabia
- Qatar
- South Africa
- Rest of Middle East And Africa
Key Market Players:
- ORBCOMM Inc.
- skycell ag
- Traxens
- Phillips Connect Technologies
- Globe Tracker
- Robert Bosch
- Nexiot AG
- MSC (Mediterranean Shipping Company)
- Shenzhen joint Technology Co. Ltd.
- A.P. Moller - Maersk
TABLE OF CONTENTS
CHAPTER 1: INTRODUCTION
- 1.1. Report description
- 1.2. Key market segments
- 1.3. Key benefits to the stakeholders
- 1.4. Research methodology
- 1.4.1. Primary research
- 1.4.2. Secondary research
- 1.4.3. Analyst tools and models
CHAPTER 2: EXECUTIVE SUMMARY
- 2.1. CXO Perspective
CHAPTER 3: MARKET OVERVIEW
- 3.1. Market definition and scope
- 3.2. Key findings
- 3.2.1. Top impacting factors
- 3.2.2. Top investment pockets
- 3.3. Porter's five forces analysis
- 3.4. Market dynamics
- 3.4.1. Drivers
- 3.4.2. Restraints
- 3.4.3. Opportunities
CHAPTER 4: SMART CONTAINER MARKET, BY OFFERING
- 4.1. Overview
- 4.1.1. Market size and forecast
- 4.2. Hardware
- 4.2.1. Key market trends, growth factors and opportunities
- 4.2.2. Market size and forecast, by region
- 4.2.3. Market share analysis by country
- 4.3. Software
- 4.3.1. Key market trends, growth factors and opportunities
- 4.3.2. Market size and forecast, by region
- 4.3.3. Market share analysis by country
- 4.4. Services
- 4.4.1. Key market trends, growth factors and opportunities
- 4.4.2. Market size and forecast, by region
- 4.4.3. Market share analysis by country
CHAPTER 5: SMART CONTAINER MARKET, BY TECHNOLOGY
- 5.1. Overview
- 5.1.1. Market size and forecast
- 5.2. GPS (Global Positioning System)
- 5.2.1. Key market trends, growth factors and opportunities
- 5.2.2. Market size and forecast, by region
- 5.2.3. Market share analysis by country
- 5.3. Cellular
- 5.3.1. Key market trends, growth factors and opportunities
- 5.3.2. Market size and forecast, by region
- 5.3.3. Market share analysis by country
- 5.4. LoRa WAN (Long Range Wide Area Network)
- 5.4.1. Key market trends, growth factors and opportunities
- 5.4.2. Market size and forecast, by region
- 5.4.3. Market share analysis by country
- 5.5. Bluetooth Low Energy
- 5.5.1. Key market trends, growth factors and opportunities
- 5.5.2. Market size and forecast, by region
- 5.5.3. Market share analysis by country
CHAPTER 6: SMART CONTAINER MARKET, BY INDUSTRY VERTICAL
- 6.1. Overview
- 6.1.1. Market size and forecast
- 6.2. Food and Beverage
- 6.2.1. Key market trends, growth factors and opportunities
- 6.2.2. Market size and forecast, by region
- 6.2.3. Market share analysis by country
- 6.3. Pharmaceutica
- 6.3.1. Key market trends, growth factors and opportunities
- 6.3.2. Market size and forecast, by region
- 6.3.3. Market share analysis by country
- 6.4. Oil and Gas
- 6.4.1. Key market trends, growth factors and opportunities
- 6.4.2. Market size and forecast, by region
- 6.4.3. Market share analysis by country
- 6.5. Chemicals
- 6.5.1. Key market trends, growth factors and opportunities
- 6.5.2. Market size and forecast, by region
- 6.5.3. Market share analysis by country
- 6.6. Others
- 6.6.1. Key market trends, growth factors and opportunities
- 6.6.2. Market size and forecast, by region
- 6.6.3. Market share analysis by country
CHAPTER 7: SMART CONTAINER MARKET, BY REGION
- 7.1. Overview
- 7.1.1. Market size and forecast By Region
- 7.2. North America
- 7.2.1. Key market trends, growth factors and opportunities
- 7.2.2. Market size and forecast, by Offering
- 7.2.3. Market size and forecast, by Technology
- 7.2.4. Market size and forecast, by Industry Vertical
- 7.2.5. Market size and forecast, by country
- 7.2.5.1. U.S.
- 7.2.5.1.1. Market size and forecast, by Offering
- 7.2.5.1.2. Market size and forecast, by Technology
- 7.2.5.1.3. Market size and forecast, by Industry Vertical
- 7.2.5.2. Canada
- 7.2.5.2.1. Market size and forecast, by Offering
- 7.2.5.2.2. Market size and forecast, by Technology
- 7.2.5.2.3. Market size and forecast, by Industry Vertical
- 7.2.5.3. Mexico
- 7.2.5.3.1. Market size and forecast, by Offering
- 7.2.5.3.2. Market size and forecast, by Technology
- 7.2.5.3.3. Market size and forecast, by Industry Vertical
- 7.3. Europe
- 7.3.1. Key market trends, growth factors and opportunities
- 7.3.2. Market size and forecast, by Offering
- 7.3.3. Market size and forecast, by Technology
- 7.3.4. Market size and forecast, by Industry Vertical
- 7.3.5. Market size and forecast, by country
- 7.3.5.1. UK
- 7.3.5.1.1. Market size and forecast, by Offering
- 7.3.5.1.2. Market size and forecast, by Technology
- 7.3.5.1.3. Market size and forecast, by Industry Vertical
- 7.3.5.2. Germany
- 7.3.5.2.1. Market size and forecast, by Offering
- 7.3.5.2.2. Market size and forecast, by Technology
- 7.3.5.2.3. Market size and forecast, by Industry Vertical
- 7.3.5.3. France
- 7.3.5.3.1. Market size and forecast, by Offering
- 7.3.5.3.2. Market size and forecast, by Technology
- 7.3.5.3.3. Market size and forecast, by Industry Vertical
- 7.3.5.4. Italy
- 7.3.5.4.1. Market size and forecast, by Offering
- 7.3.5.4.2. Market size and forecast, by Technology
- 7.3.5.4.3. Market size and forecast, by Industry Vertical
- 7.3.5.5. Rest of Europe
- 7.3.5.5.1. Market size and forecast, by Offering
- 7.3.5.5.2. Market size and forecast, by Technology
- 7.3.5.5.3. Market size and forecast, by Industry Vertical
- 7.4. Asia-Pacific
- 7.4.1. Key market trends, growth factors and opportunities
- 7.4.2. Market size and forecast, by Offering
- 7.4.3. Market size and forecast, by Technology
- 7.4.4. Market size and forecast, by Industry Vertical
- 7.4.5. Market size and forecast, by country
- 7.4.5.1. China
- 7.4.5.1.1. Market size and forecast, by Offering
- 7.4.5.1.2. Market size and forecast, by Technology
- 7.4.5.1.3. Market size and forecast, by Industry Vertical
- 7.4.5.2. Japan
- 7.4.5.2.1. Market size and forecast, by Offering
- 7.4.5.2.2. Market size and forecast, by Technology
- 7.4.5.2.3. Market size and forecast, by Industry Vertical
- 7.4.5.3. India
- 7.4.5.3.1. Market size and forecast, by Offering
- 7.4.5.3.2. Market size and forecast, by Technology
- 7.4.5.3.3. Market size and forecast, by Industry Vertical
- 7.4.5.4. South Korea
- 7.4.5.4.1. Market size and forecast, by Offering
- 7.4.5.4.2. Market size and forecast, by Technology
- 7.4.5.4.3. Market size and forecast, by Industry Vertical
- 7.4.5.5. Rest of Asia-Pacific
- 7.4.5.5.1. Market size and forecast, by Offering
- 7.4.5.5.2. Market size and forecast, by Technology
- 7.4.5.5.3. Market size and forecast, by Industry Vertical
- 7.5. Latin America
- 7.5.1. Key market trends, growth factors and opportunities
- 7.5.2. Market size and forecast, by Offering
- 7.5.3. Market size and forecast, by Technology
- 7.5.4. Market size and forecast, by Industry Vertical
- 7.5.5. Market size and forecast, by country
- 7.5.5.1. Brazil
- 7.5.5.1.1. Market size and forecast, by Offering
- 7.5.5.1.2. Market size and forecast, by Technology
- 7.5.5.1.3. Market size and forecast, by Industry Vertical
- 7.5.5.2. Argentena
- 7.5.5.2.1. Market size and forecast, by Offering
- 7.5.5.2.2. Market size and forecast, by Technology
- 7.5.5.2.3. Market size and forecast, by Industry Vertical
- 7.5.5.3. Rest of Latin America
- 7.5.5.3.1. Market size and forecast, by Offering
- 7.5.5.3.2. Market size and forecast, by Technology
- 7.5.5.3.3. Market size and forecast, by Industry Vertical
- 7.6. Middle East and Africa
- 7.6.1. Key market trends, growth factors and opportunities
- 7.6.2. Market size and forecast, by Offering
- 7.6.3. Market size and forecast, by Technology
- 7.6.4. Market size and forecast, by Industry Vertical
- 7.6.5. Market size and forecast, by country
- 7.6.5.1. UAE
- 7.6.5.1.1. Market size and forecast, by Offering
- 7.6.5.1.2. Market size and forecast, by Technology
- 7.6.5.1.3. Market size and forecast, by Industry Vertical
- 7.6.5.2. Saudi Arabia
- 7.6.5.2.1. Market size and forecast, by Offering
- 7.6.5.2.2. Market size and forecast, by Technology
- 7.6.5.2.3. Market size and forecast, by Industry Vertical
- 7.6.5.3. Qatar
- 7.6.5.3.1. Market size and forecast, by Offering
- 7.6.5.3.2. Market size and forecast, by Technology
- 7.6.5.3.3. Market size and forecast, by Industry Vertical
- 7.6.5.4. South Africa
- 7.6.5.4.1. Market size and forecast, by Offering
- 7.6.5.4.2. Market size and forecast, by Technology
- 7.6.5.4.3. Market size and forecast, by Industry Vertical
- 7.6.5.5. Rest of Middle East And Africa
- 7.6.5.5.1. Market size and forecast, by Offering
- 7.6.5.5.2. Market size and forecast, by Technology
- 7.6.5.5.3. Market size and forecast, by Industry Vertical
CHAPTER 8: COMPETITIVE LANDSCAPE
- 8.1. Introduction
- 8.2. Top winning strategies
- 8.3. Product mapping of top 10 player
- 8.4. Competitive dashboard
- 8.5. Competitive heatmap
- 8.6. Top player positioning, 2022
CHAPTER 9: COMPANY PROFILES
- 9.1. ORBCOMM Inc.
- 9.1.1. Company overview
- 9.1.2. Key executives
- 9.1.3. Company snapshot
- 9.1.4. Operating business segments
- 9.1.5. Product portfolio
- 9.1.6. Business performance
- 9.1.7. Key strategic moves and developments
- 9.2. skycell ag
- 9.2.1. Company overview
- 9.2.2. Key executives
- 9.2.3. Company snapshot
- 9.2.4. Operating business segments
- 9.2.5. Product portfolio
- 9.2.6. Business performance
- 9.2.7. Key strategic moves and developments
- 9.3. Traxens
- 9.3.1. Company overview
- 9.3.2. Key executives
- 9.3.3. Company snapshot
- 9.3.4. Operating business segments
- 9.3.5. Product portfolio
- 9.3.6. Business performance
- 9.3.7. Key strategic moves and developments
- 9.4. Phillips Connect Technologies
- 9.4.1. Company overview
- 9.4.2. Key executives
- 9.4.3. Company snapshot
- 9.4.4. Operating business segments
- 9.4.5. Product portfolio
- 9.4.6. Business performance
- 9.4.7. Key strategic moves and developments
- 9.5. Globe Tracker
- 9.5.1. Company overview
- 9.5.2. Key executives
- 9.5.3. Company snapshot
- 9.5.4. Operating business segments
- 9.5.5. Product portfolio
- 9.5.6. Business performance
- 9.5.7. Key strategic moves and developments
- 9.6. Robert Bosch
- 9.6.1. Company overview
- 9.6.2. Key executives
- 9.6.3. Company snapshot
- 9.6.4. Operating business segments
- 9.6.5. Product portfolio
- 9.6.6. Business performance
- 9.6.7. Key strategic moves and developments
- 9.7. Nexiot AG
- 9.7.1. Company overview
- 9.7.2. Key executives
- 9.7.3. Company snapshot
- 9.7.4. Operating business segments
- 9.7.5. Product portfolio
- 9.7.6. Business performance
- 9.7.7. Key strategic moves and developments
- 9.8. MSC (Mediterranean Shipping Company)
- 9.8.1. Company overview
- 9.8.2. Key executives
- 9.8.3. Company snapshot
- 9.8.4. Operating business segments
- 9.8.5. Product portfolio
- 9.8.6. Business performance
- 9.8.7. Key strategic moves and developments
- 9.9. Shenzhen joint Technology Co. Ltd.
- 9.9.1. Company overview
- 9.9.2. Key executives
- 9.9.3. Company snapshot
- 9.9.4. Operating business segments
- 9.9.5. Product portfolio
- 9.9.6. Business performance
- 9.9.7. Key strategic moves and developments
- 9.10. A.P. Moller - Maersk
- 9.10.1. Company overview
- 9.10.2. Key executives
- 9.10.3. Company snapshot
- 9.10.4. Operating business segments
- 9.10.5. Product portfolio
- 9.10.6. Business performance
- 9.10.7. Key strategic moves and developments
