
|
市場調査レポート
商品コード
1447174
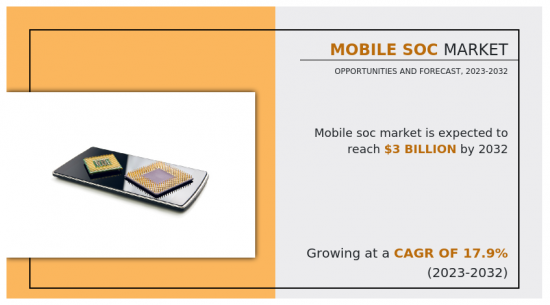
モバイルSoC市場:オペレーティングシステム別、コアタイプ別:2023年~2032年の世界機会分析と産業予測Mobile SoC Market By Operating System (Android, iOS), By Core Type (Quad Core, Octa Core, Hexa Core, Others): Global Opportunity Analysis and Industry Forecast, 2023-2032 |
||||||
|
|||||||

| モバイルSoC市場:オペレーティングシステム別、コアタイプ別:2023年~2032年の世界機会分析と産業予測 |
|
出版日: 2024年01月30日
発行: Allied Market Research
ページ情報: 英文 233 Pages
納期: 2~3営業日
|

- 全表示
- 概要
- 図表
- 目次
モバイルシステムオンチップ(SoC)は、コンピュータや電子システムのさまざまな重要コンポーネントを、モバイル機器、特にスマートフォン向けに特別に設計された単一のユニットに統合した包括的な集積回路です。
コンパクトでエネルギー効率に優れたパッケージ内に、コンピューティング・パワー、グラフィックス処理、接続性、その他の重要な機能などの機能を包含し、中央処理装置の役割を果たします。
モバイルシステムオンチップ(SoC)の主な特徴は、さまざまなコンポーネントを1つのチップに統合することです。この統合には、一般的なコンピューティング機能を実現する中央演算処理装置(CPU)、グラフィックスのレンダリングやマルチメディア体験の向上を実現するグラフィックス・プロセッシング・ユニット(GPU)、効率的なデータ管理を実現するメモリー・コントローラー、ユーザーとのインタラクションを実現する入出力インターフェース、そして無線通信用のモデムなどが含まれます。
スマートフォンでモバイルSoCを使用する主な目的は、デバイスのパフォーマンス、エネルギー効率、全体的な機能を最適化することです。これらの重要なコンポーネントをシングルチップに統合することで、メーカーはより小型で電力効率の高いスマートフォンを設計できます。この統合により、機能ごとにチップを分ける必要性が最小化され、デバイスの物理的サイズ、消費電力、製造コストが削減されます。
さらに、モバイルSoCは、モバイル・コンピューティングの特定の要求を満たすように調整されています。モバイルSoCは、パフォーマンスとエネルギー効率のバランスを取るように設計されており、バッテリー寿命を維持しながらシームレスなユーザー体験を確保する上で極めて重要な要素となっています。SoCのコンパクトな性質は、最新のスマートフォンのスリムで軽量なデザインにも貢献し、洗練されたポータブルデバイスを求める消費者の嗜好に応えています。
スマートフォンにおけるモバイルSoCの使用は、高度な機能と技術をサポートする能力によってさらに正当化されます。モバイル技術の進化に伴い、SoCには人工知能(AI)処理、4Gや5Gなどの高速接続規格、カメラ処理などのタスクに特化したコンポーネントなどの機能が組み込まれています。このような適応性により、スマートフォンは新たな技術に対応し、ユーザーに強化された機能を提供することができます。
モバイルSoC市場は、オペレーティングシステム、コアタイプ、地域別に分析されます。OS別では、アンドロイドとiOSに分けられます。2022年にはアンドロイドセグメントが市場を席巻し、2032年までに大きな市場シェアを獲得すると予想されます。コアの種類によって、市場はクアッドコア、オクタコア、ヘキサコア、その他に分けられます。2022年には、オクタコアセグメントが市場を席巻し、2032年までに大きな市場シェアを獲得すると予想されます。
地域別では、北米(米国、カナダ、メキシコ)、欧州(英国、ドイツ、フランス、その他欧州地域)、アジア太平洋(中国、日本、インド、韓国、その他アジア太平洋地域)、ラテンアメリカ(中南米、中東・アフリカ)のモバイルSoC市場動向が分析されています。
利害関係者にとっての主なメリット
- 当レポートでは、2022年から2032年にかけてのモバイルSoc市場分析の市場セグメント、現在の動向、推定・動向分析、ダイナミクスを定量的に分析し、モバイルSoc市場の有力な機会を特定します。
- 市場促進要因、市場抑制要因、市場機会に関連する情報とともに市場調査を提供します。
- ポーターのファイブフォース(5つの力)分析では、利害関係者が利益重視のビジネス決定を下し、サプライヤーとバイヤーのネットワークを強化できるよう、バイヤーとサプライヤーの潜在力を明らかにします。
- 携帯電話市場セグメンテーションの詳細分析により、市場機会を決定します。
- 各地域の主要国は、世界市場への収益貢献度に応じてマッピングされています。
- 市場プレイヤーのポジショニングはベンチマーキングを容易にし、市場プレイヤーの現在のポジションを明確に理解できます。
- 本レポートには、地域および世界のモバイルソックス市場動向、主要企業、市場セグメント、応用分野、市場成長戦略の分析が含まれています。
本レポートで可能なカスタマイズ(追加費用とスケジュールが必要です。)
- サプライチェーン分析とベンダーマージン
- 主要企業の新製品開発/製品マトリックス
- クライアントの関心に応じた追加企業プロファイル
- ブランドシェア分析
- 輸出入分析/データ
- 主要プレーヤーの詳細(所在地、連絡先、サプライヤー/ベンダーネットワークなどを含む、エクセル形式)
目次
第1章 イントロダクション
第2章 エグゼクティブサマリー
第3章 市場概要
- 市場の定義と範囲
- 主な調査結果
- 影響要因
- 主な投資機会
- ポーターのファイブフォース分析
- 市場力学
- 促進要因
- 機能強化と高度な機能を備えたモバイル機器への需要の伸び
- バッテリー寿命を延ばすための電力効率優先
- 抑制要因
- モバイルメーカー間の競争激化による価格圧力
- 機会
- エッジコンピューティングの増加により、AI推論用の高性能SoCが必要
- 新興市場におけるスマートフォンの普及拡大が未開拓の成長ポテンシャルを提供
- 促進要因
第4章 モバイルSOC市場:オペレーティングシステム別
- 概要
- Android
- iOS
第5章 モバイルSOC市場:コアタイプ別
- 概要
- クアッドコア
- オクタコア
- ヘキサコア
- その他
第6章 モバイルSOC市場:地域別
- 概要
- 北米
- 米国
- カナダ
- メキシコ
- 欧州
- 英国
- ドイツ
- フランス
- その他
- アジア太平洋
- 中国
- 日本
- インド
- 韓国
- その他
- ラテンアメリカ
- ラテンアメリカ
- 中東
- アフリカ
第7章 競合情勢
- イントロダクション
- 主要成功戦略
- 主要10社の製品マッピング
- 競合ダッシュボード
- 競合ヒートマップ
- 主要企業のポジショニング、2022年
第8章 企業プロファイル
- Advanced Micro Devices, Inc.
- Intel Corporation
- Qualcomm Technologies, Inc.
- Apple Inc.
- Samsung
- MediaTek Inc.
- HiSilicon(Huawei Technologies)
- NVIDIA Corporation
- Unisoc(Shanghai)Technologies Co., Ltd.
- NXP semiconductors
LIST OF TABLES
- TABLE 01. GLOBAL MOBILE SOC MARKET, BY OPERATING SYSTEM, 2022-2032 ($MILLION)
- TABLE 02. MOBILE SOC MARKET FOR ANDROID, BY REGION, 2022-2032 ($MILLION)
- TABLE 03. MOBILE SOC MARKET FOR IOS, BY REGION, 2022-2032 ($MILLION)
- TABLE 04. GLOBAL MOBILE SOC MARKET, BY CORE TYPE, 2022-2032 ($MILLION)
- TABLE 05. MOBILE SOC MARKET FOR QUAD CORE, BY REGION, 2022-2032 ($MILLION)
- TABLE 06. MOBILE SOC MARKET FOR OCTA CORE, BY REGION, 2022-2032 ($MILLION)
- TABLE 07. MOBILE SOC MARKET FOR HEXA CORE, BY REGION, 2022-2032 ($MILLION)
- TABLE 08. MOBILE SOC MARKET FOR OTHERS, BY REGION, 2022-2032 ($MILLION)
- TABLE 09. MOBILE SOC MARKET, BY REGION, 2022-2032 ($MILLION)
- TABLE 10. NORTH AMERICA MOBILE SOC MARKET, BY OPERATING SYSTEM, 2022-2032 ($MILLION)
- TABLE 11. NORTH AMERICA MOBILE SOC MARKET, BY CORE TYPE, 2022-2032 ($MILLION)
- TABLE 12. NORTH AMERICA MOBILE SOC MARKET, BY COUNTRY, 2022-2032 ($MILLION)
- TABLE 13. U.S. MOBILE SOC MARKET, BY OPERATING SYSTEM, 2022-2032 ($MILLION)
- TABLE 14. U.S. MOBILE SOC MARKET, BY CORE TYPE, 2022-2032 ($MILLION)
- TABLE 15. CANADA MOBILE SOC MARKET, BY OPERATING SYSTEM, 2022-2032 ($MILLION)
- TABLE 16. CANADA MOBILE SOC MARKET, BY CORE TYPE, 2022-2032 ($MILLION)
- TABLE 17. MEXICO MOBILE SOC MARKET, BY OPERATING SYSTEM, 2022-2032 ($MILLION)
- TABLE 18. MEXICO MOBILE SOC MARKET, BY CORE TYPE, 2022-2032 ($MILLION)
- TABLE 19. EUROPE MOBILE SOC MARKET, BY OPERATING SYSTEM, 2022-2032 ($MILLION)
- TABLE 20. EUROPE MOBILE SOC MARKET, BY CORE TYPE, 2022-2032 ($MILLION)
- TABLE 21. EUROPE MOBILE SOC MARKET, BY COUNTRY, 2022-2032 ($MILLION)
- TABLE 22. UK MOBILE SOC MARKET, BY OPERATING SYSTEM, 2022-2032 ($MILLION)
- TABLE 23. UK MOBILE SOC MARKET, BY CORE TYPE, 2022-2032 ($MILLION)
- TABLE 24. GERMANY MOBILE SOC MARKET, BY OPERATING SYSTEM, 2022-2032 ($MILLION)
- TABLE 25. GERMANY MOBILE SOC MARKET, BY CORE TYPE, 2022-2032 ($MILLION)
- TABLE 26. FRANCE MOBILE SOC MARKET, BY OPERATING SYSTEM, 2022-2032 ($MILLION)
- TABLE 27. FRANCE MOBILE SOC MARKET, BY CORE TYPE, 2022-2032 ($MILLION)
- TABLE 28. REST OF EUROPE MOBILE SOC MARKET, BY OPERATING SYSTEM, 2022-2032 ($MILLION)
- TABLE 29. REST OF EUROPE MOBILE SOC MARKET, BY CORE TYPE, 2022-2032 ($MILLION)
- TABLE 30. ASIA-PACIFIC MOBILE SOC MARKET, BY OPERATING SYSTEM, 2022-2032 ($MILLION)
- TABLE 31. ASIA-PACIFIC MOBILE SOC MARKET, BY CORE TYPE, 2022-2032 ($MILLION)
- TABLE 32. ASIA-PACIFIC MOBILE SOC MARKET, BY COUNTRY, 2022-2032 ($MILLION)
- TABLE 33. CHINA MOBILE SOC MARKET, BY OPERATING SYSTEM, 2022-2032 ($MILLION)
- TABLE 34. CHINA MOBILE SOC MARKET, BY CORE TYPE, 2022-2032 ($MILLION)
- TABLE 35. JAPAN MOBILE SOC MARKET, BY OPERATING SYSTEM, 2022-2032 ($MILLION)
- TABLE 36. JAPAN MOBILE SOC MARKET, BY CORE TYPE, 2022-2032 ($MILLION)
- TABLE 37. INDIA MOBILE SOC MARKET, BY OPERATING SYSTEM, 2022-2032 ($MILLION)
- TABLE 38. INDIA MOBILE SOC MARKET, BY CORE TYPE, 2022-2032 ($MILLION)
- TABLE 39. SOUTH KOREA MOBILE SOC MARKET, BY OPERATING SYSTEM, 2022-2032 ($MILLION)
- TABLE 40. SOUTH KOREA MOBILE SOC MARKET, BY CORE TYPE, 2022-2032 ($MILLION)
- TABLE 41. REST OF ASIA-PACIFIC MOBILE SOC MARKET, BY OPERATING SYSTEM, 2022-2032 ($MILLION)
- TABLE 42. REST OF ASIA-PACIFIC MOBILE SOC MARKET, BY CORE TYPE, 2022-2032 ($MILLION)
- TABLE 43. LAMEA MOBILE SOC MARKET, BY OPERATING SYSTEM, 2022-2032 ($MILLION)
- TABLE 44. LAMEA MOBILE SOC MARKET, BY CORE TYPE, 2022-2032 ($MILLION)
- TABLE 45. LAMEA MOBILE SOC MARKET, BY COUNTRY, 2022-2032 ($MILLION)
- TABLE 46. LATIN AMERICA MOBILE SOC MARKET, BY OPERATING SYSTEM, 2022-2032 ($MILLION)
- TABLE 47. LATIN AMERICA MOBILE SOC MARKET, BY CORE TYPE, 2022-2032 ($MILLION)
- TABLE 48. MIDDLE EAST MOBILE SOC MARKET, BY OPERATING SYSTEM, 2022-2032 ($MILLION)
- TABLE 49. MIDDLE EAST MOBILE SOC MARKET, BY CORE TYPE, 2022-2032 ($MILLION)
- TABLE 50. AFRICA MOBILE SOC MARKET, BY OPERATING SYSTEM, 2022-2032 ($MILLION)
- TABLE 51. AFRICA MOBILE SOC MARKET, BY CORE TYPE, 2022-2032 ($MILLION)
- TABLE 52. ADVANCED MICRO DEVICES, INC.: KEY EXECUTIVES
- TABLE 53. ADVANCED MICRO DEVICES, INC.: COMPANY SNAPSHOT
- TABLE 54. ADVANCED MICRO DEVICES, INC.: SERVICE SEGMENTS
- TABLE 55. ADVANCED MICRO DEVICES, INC.: PRODUCT PORTFOLIO
- TABLE 56. ADVANCED MICRO DEVICES, INC.: KEY STRATERGIES
- TABLE 57. INTEL CORPORATION: KEY EXECUTIVES
- TABLE 58. INTEL CORPORATION: COMPANY SNAPSHOT
- TABLE 59. INTEL CORPORATION: PRODUCT SEGMENTS
- TABLE 60. INTEL CORPORATION: PRODUCT PORTFOLIO
- TABLE 61. QUALCOMM TECHNOLOGIES, INC. : KEY EXECUTIVES
- TABLE 62. QUALCOMM TECHNOLOGIES, INC. : COMPANY SNAPSHOT
- TABLE 63. QUALCOMM TECHNOLOGIES, INC. : SERVICE SEGMENTS
- TABLE 64. QUALCOMM TECHNOLOGIES, INC. : PRODUCT PORTFOLIO
- TABLE 65. QUALCOMM TECHNOLOGIES, INC. : KEY STRATERGIES
- TABLE 66. APPLE INC.: KEY EXECUTIVES
- TABLE 67. APPLE INC.: COMPANY SNAPSHOT
- TABLE 68. APPLE INC.: PRODUCT SEGMENTS
- TABLE 69. APPLE INC.: SERVICE SEGMENTS
- TABLE 70. APPLE INC.: PRODUCT PORTFOLIO
- TABLE 71. SAMSUNG: KEY EXECUTIVES
- TABLE 72. SAMSUNG: COMPANY SNAPSHOT
- TABLE 73. SAMSUNG: SERVICE SEGMENTS
- TABLE 74. SAMSUNG: PRODUCT PORTFOLIO
- TABLE 75. MEDIATEK INC.: KEY EXECUTIVES
- TABLE 76. MEDIATEK INC.: COMPANY SNAPSHOT
- TABLE 77. MEDIATEK INC.: SERVICE SEGMENTS
- TABLE 78. MEDIATEK INC.: PRODUCT PORTFOLIO
- TABLE 79. MEDIATEK INC.: KEY STRATERGIES
- TABLE 80. HISILICON (HUAWEI TECHNOLOGIES): KEY EXECUTIVES
- TABLE 81. HISILICON (HUAWEI TECHNOLOGIES): COMPANY SNAPSHOT
- TABLE 82. HISILICON (HUAWEI TECHNOLOGIES): PRODUCT SEGMENTS
- TABLE 83. HISILICON (HUAWEI TECHNOLOGIES): PRODUCT PORTFOLIO
- TABLE 84. HISILICON (HUAWEI TECHNOLOGIES): KEY STRATERGIES
- TABLE 85. NVIDIA CORPORATION: KEY EXECUTIVES
- TABLE 86. NVIDIA CORPORATION: COMPANY SNAPSHOT
- TABLE 87. NVIDIA CORPORATION: PRODUCT SEGMENTS
- TABLE 88. NVIDIA CORPORATION: PRODUCT PORTFOLIO
- TABLE 89. UNISOC (SHANGHAI) TECHNOLOGIES CO., LTD.: KEY EXECUTIVES
- TABLE 90. UNISOC (SHANGHAI) TECHNOLOGIES CO., LTD.: COMPANY SNAPSHOT
- TABLE 91. UNISOC (SHANGHAI) TECHNOLOGIES CO., LTD.: PRODUCT SEGMENTS
- TABLE 92. UNISOC (SHANGHAI) TECHNOLOGIES CO., LTD.: PRODUCT PORTFOLIO
- TABLE 93. NXP SEMICONDUCTORS: KEY EXECUTIVES
- TABLE 94. NXP SEMICONDUCTORS: COMPANY SNAPSHOT
- TABLE 95. NXP SEMICONDUCTORS: SERVICE SEGMENTS
- TABLE 96. NXP SEMICONDUCTORS: PRODUCT PORTFOLIO
LIST OF FIGURES
- FIGURE 01. MOBILE SOC MARKET, 2022-2032
- FIGURE 02. SEGMENTATION OF MOBILE SOC MARKET,2022-2032
- FIGURE 03. TOP IMPACTING FACTORS IN MOBILE SOC MARKET (2022 TO 2032)
- FIGURE 04. TOP INVESTMENT POCKETS IN MOBILE SOC MARKET (2023-2032)
- FIGURE 05. MODERATE TO HIGH BARGAINING POWER OF SUPPLIERS
- FIGURE 06. MODERATE TO HIGH THREAT OF NEW ENTRANTS
- FIGURE 07. MODERATE TO HIGH THREAT OF SUBSTITUTES
- FIGURE 08. LOW TO HIGH INTENSITY OF RIVALRY
- FIGURE 09. MODERATE TO HIGH BARGAINING POWER OF BUYERS
- FIGURE 10. GLOBAL MOBILE SOC MARKET:DRIVERS, RESTRAINTS AND OPPORTUNITIES
- FIGURE 11. MOBILE SOC MARKET, BY OPERATING SYSTEM, 2022 AND 2032(%)
- FIGURE 12. COMPARATIVE SHARE ANALYSIS OF MOBILE SOC MARKET FOR ANDROID, BY COUNTRY 2022 AND 2032(%)
- FIGURE 13. COMPARATIVE SHARE ANALYSIS OF MOBILE SOC MARKET FOR IOS, BY COUNTRY 2022 AND 2032(%)
- FIGURE 14. MOBILE SOC MARKET, BY CORE TYPE, 2022 AND 2032(%)
- FIGURE 15. COMPARATIVE SHARE ANALYSIS OF MOBILE SOC MARKET FOR QUAD CORE, BY COUNTRY 2022 AND 2032(%)
- FIGURE 16. COMPARATIVE SHARE ANALYSIS OF MOBILE SOC MARKET FOR OCTA CORE, BY COUNTRY 2022 AND 2032(%)
- FIGURE 17. COMPARATIVE SHARE ANALYSIS OF MOBILE SOC MARKET FOR HEXA CORE, BY COUNTRY 2022 AND 2032(%)
- FIGURE 18. COMPARATIVE SHARE ANALYSIS OF MOBILE SOC MARKET FOR OTHERS, BY COUNTRY 2022 AND 2032(%)
- FIGURE 19. MOBILE SOC MARKET BY REGION, 2022 AND 2032(%)
- FIGURE 20. U.S. MOBILE SOC MARKET, 2022-2032 ($MILLION)
- FIGURE 21. CANADA MOBILE SOC MARKET, 2022-2032 ($MILLION)
- FIGURE 22. MEXICO MOBILE SOC MARKET, 2022-2032 ($MILLION)
- FIGURE 23. UK MOBILE SOC MARKET, 2022-2032 ($MILLION)
- FIGURE 24. GERMANY MOBILE SOC MARKET, 2022-2032 ($MILLION)
- FIGURE 25. FRANCE MOBILE SOC MARKET, 2022-2032 ($MILLION)
- FIGURE 26. REST OF EUROPE MOBILE SOC MARKET, 2022-2032 ($MILLION)
- FIGURE 27. CHINA MOBILE SOC MARKET, 2022-2032 ($MILLION)
- FIGURE 28. JAPAN MOBILE SOC MARKET, 2022-2032 ($MILLION)
- FIGURE 29. INDIA MOBILE SOC MARKET, 2022-2032 ($MILLION)
- FIGURE 30. SOUTH KOREA MOBILE SOC MARKET, 2022-2032 ($MILLION)
- FIGURE 31. REST OF ASIA-PACIFIC MOBILE SOC MARKET, 2022-2032 ($MILLION)
- FIGURE 32. LATIN AMERICA MOBILE SOC MARKET, 2022-2032 ($MILLION)
- FIGURE 33. MIDDLE EAST MOBILE SOC MARKET, 2022-2032 ($MILLION)
- FIGURE 34. AFRICA MOBILE SOC MARKET, 2022-2032 ($MILLION)
- FIGURE 35. TOP WINNING STRATEGIES, BY YEAR (2022-2023)
- FIGURE 36. TOP WINNING STRATEGIES, BY DEVELOPMENT (2022-2023)
- FIGURE 37. TOP WINNING STRATEGIES, BY COMPANY (2022-2023)
- FIGURE 38. PRODUCT MAPPING OF TOP 10 PLAYERS
- FIGURE 39. COMPETITIVE DASHBOARD
- FIGURE 40. COMPETITIVE HEATMAP: MOBILE SOC MARKET
- FIGURE 41. TOP PLAYER POSITIONING, 2022
- FIGURE 42. ADVANCED MICRO DEVICES, INC.: RESEARCH & DEVELOPMENT EXPENDITURE, 2020-2022 ($MILLION)
- FIGURE 43. ADVANCED MICRO DEVICES, INC.: NET REVENUE, 2020-2022 ($MILLION)
- FIGURE 44. ADVANCED MICRO DEVICES, INC.: REVENUE SHARE BY SEGMENT, 2022 (%)
- FIGURE 45. ADVANCED MICRO DEVICES, INC.: REVENUE SHARE BY REGION, 2022 (%)
- FIGURE 46. INTEL CORPORATION: NET REVENUE, 2020-2022 ($MILLION)
- FIGURE 47. INTEL CORPORATION: RESEARCH & DEVELOPMENT EXPENDITURE, 2020-2022 ($MILLION)
- FIGURE 48. INTEL CORPORATION: REVENUE SHARE BY REGION, 2022 (%)
- FIGURE 49. INTEL CORPORATION: REVENUE SHARE BY SEGMENT, 2022 (%)
- FIGURE 50. QUALCOMM TECHNOLOGIES, INC. : NET REVENUE, 2020-2022 ($MILLION)
- FIGURE 51. QUALCOMM TECHNOLOGIES, INC. : RESEARCH & DEVELOPMENT EXPENDITURE, 2020-2022 ($MILLION)
- FIGURE 52. QUALCOMM TECHNOLOGIES, INC. : REVENUE SHARE BY SEGMENT, 2022 (%)
- FIGURE 53. QUALCOMM TECHNOLOGIES, INC. : REVENUE SHARE BY REGION, 2022 (%)
- FIGURE 54. APPLE INC.: NET REVENUE, 2020-2022 ($MILLION)
- FIGURE 55. APPLE INC.: RESEARCH & DEVELOPMENT EXPENDITURE, 2020-2022 ($MILLION)
- FIGURE 56. APPLE INC.: REVENUE SHARE BY SEGMENT, 2022 (%)
- FIGURE 57. APPLE INC.: REVENUE SHARE BY REGION, 2022 (%)
- FIGURE 58. SAMSUNG: NET REVENUE, 2020-2022 ($MILLION)
- FIGURE 59. SAMSUNG: RESEARCH & DEVELOPMENT EXPENDITURE, 2020-2022 ($MILLION)
- FIGURE 60. SAMSUNG: REVENUE SHARE BY SEGMENT, 2022 (%)
- FIGURE 61. SAMSUNG: REVENUE SHARE BY REGION, 2022 (%)
- FIGURE 62. MEDIATEK INC.: NET REVENUE, 2020-2022 ($MILLION)
- FIGURE 63. MEDIATEK INC.: RESEARCH & DEVELOPMENT EXPENDITURE, 2020-2022 ($MILLION)
- FIGURE 64. MEDIATEK INC.: REVENUE SHARE BY SEGMENT, 2022 (%)
- FIGURE 65. MEDIATEK INC.: REVENUE SHARE BY REGION, 2022 (%)
- FIGURE 66. HISILICON (HUAWEI TECHNOLOGIES): NET REVENUE, 2020-2022 ($MILLION)
- FIGURE 67. HISILICON (HUAWEI TECHNOLOGIES): REVENUE SHARE BY SEGMENT, 2022 (%)
- FIGURE 68. HISILICON (HUAWEI TECHNOLOGIES): REVENUE SHARE BY REGION, 2022 (%)
- FIGURE 69. NVIDIA CORPORATION: NET REVENUE, 2021-2023 ($MILLION)
- FIGURE 70. NVIDIA CORPORATION: RESEARCH & DEVELOPMENT EXPENDITURE, 2021-2023 ($MILLION)
- FIGURE 71. NVIDIA CORPORATION: REVENUE SHARE BY SEGMENT, 2023 (%)
- FIGURE 72. NVIDIA CORPORATION: REVENUE SHARE BY REGION, 2023 (%)
- FIGURE 73. NXP SEMICONDUCTORS: NET REVENUE, 2020-2022 ($MILLION)
- FIGURE 74. NXP SEMICONDUCTORS: RESEARCH & DEVELOPMENT EXPENDITURE, 2020-2022 ($MILLION)
- FIGURE 75. NXP SEMICONDUCTORS: REVENUE SHARE BY SEGMENT, 2022 (%)
- FIGURE 76. NXP SEMICONDUCTORS: REVENUE SHARE BY REGION, 2022 (%)
A mobile system on chip (SoC) is a comprehensive integrated circuit that consolidates various essential components of a computer or electronic system into a single unit specifically designed for mobile devices, particularly smartphones. It serves as the central processing unit, encompassing functionalities such as computing power, graphics processing, connectivity, and other vital features within a compact and energy-efficient package.
A key feature of mobile System on Chips (SoCs) is the amalgamation of various components onto a singular chip. This consolidation encompasses a central processing unit (CPU) for general computing functions, a graphics processing unit (GPU) for graphics rendering and improved multimedia experiences, memory controllers for effective data management, input/output interfaces for user interactions, and frequently a modem for wireless communication.
The primary purpose of using a mobile SoC in smartphones is to optimize the device's performance, energy efficiency, and overall functionality. By combining these crucial components on a single chip, manufacturers can design smaller and more power-efficient smartphones. This integration minimizes the need for separate chips for different functions, reducing the device's physical size, power consumption, and production costs.
Moreover, Mobile SoCs are tailored to meet the specific demands of mobile computing. They are designed to strike a balance between performance and energy efficiency, crucial factors in ensuring a seamless user experience while preserving battery life. The compact nature of SoCs also contributes to the slim and lightweight design of modern smartphones, meeting consumer preferences for sleek and portable devices.
The use of Mobile SoCs in smartphones is further justified by their ability to support advanced features and technologies. As mobile technology evolves, SoCs incorporate capabilities such as artificial intelligence (AI) processing, high-speed connectivity standards like 4G and 5G, and specialized components for tasks like camera processing. This adaptability allows smartphones to keep pace with emerging technologies and deliver enhanced functionality to users..
The Mobile SoC market is analyzed by operating system, core type and region. On the basis of the operating system, the market is divided into android and iOS. In 2022, the android segment dominated the market, and it is expected to acquire a major market share by 2032. On the basis of core type, the market is divided into quad core, octa core, hexa core, and others. In 2022, the octa core segment dominated the market, and it is expected to acquire a major market share by 2032.
On the basis of region, the Mobile SoC market trends are analyzed across North America (the U.S., Canada, and Mexico), Europe (the UK, Germany, France, and rest of Europe), Asia-Pacific (China, Japan, India, South Korea, and rest of Asia-Pacific), and LAMEA (Latin America, Middle East, and Africa).
Competitive analysis and profiles of the major global Mobile SoC market players that have been provided in the report include Advanced Micro Devices, Inc., Intel Corporation, Qualcomm Technologies, Inc., Apple Inc., Samsung, MediaTek Inc., HiSilicon (Huawei Technologies), NVIDIA Corporation, Unisoc (Shanghai) Technologies Co., Ltd., and NXP semiconductors. The key strategies adopted by the major players of the mobile SoC market is product launch.
Key Benefits For Stakeholders
- This report provides a quantitative analysis of the market segments, current trends, estimations, and dynamics of the mobile soc market analysis from 2022 to 2032 to identify the prevailing mobile soc market opportunities.
- The market research is offered along with information related to key drivers, restraints, and opportunities.
- Porter's five forces analysis highlights the potency of buyers and suppliers to enable stakeholders make profit-oriented business decisions and strengthen their supplier-buyer network.
- In-depth analysis of the mobile soc market segmentation assists to determine the prevailing market opportunities.
- Major countries in each region are mapped according to their revenue contribution to the global market.
- Market player positioning facilitates benchmarking and provides a clear understanding of the present position of the market players.
- The report includes the analysis of the regional as well as global mobile soc market trends, key players, market segments, application areas, and market growth strategies.
Additional benefits you will get with this purchase are:
- Quarterly Update and* (only available with a corporate license, on listed price)
- 5 additional Company Profile of client Choice pre- or Post-purchase, as a free update.
- Free Upcoming Version on the Purchase of Five and Enterprise User License.
- 16 analyst hours of support* (post-purchase, if you find additional data requirements upon review of the report, you may receive support amounting to 16 analyst hours to solve questions, and post-sale queries)
- 15% Free Customization* (in case the scope or segment of the report does not match your requirements, 15% is equivalent to 3 working days of free work, applicable once)
- Free data Pack on the Five and Enterprise User License. (Excel version of the report)
- Free Updated report if the report is 6-12 months old or older.
- 24-hour priority response*
- Free Industry updates and white papers.
Possible Customization with this report (with additional cost and timeline, please talk to the sales executive to know more)
- Supply Chain Analysis & Vendor Margins
- New Product Development/ Product Matrix of Key Players
- Additional company profiles with specific to client's interest
- Brands Share Analysis
- Import Export Analysis/Data
- Key player details (including location, contact details, supplier/vendor network etc. in excel format)
Key Market Segments
By Operating System
- Android
- iOS
By Core Type
- Quad Core
- Octa Core
- Hexa Core
- Others
By Region
- North America
- U.S.
- Canada
- Mexico
- Europe
- UK
- Germany
- France
- Rest of Europe
- Asia-Pacific
- China
- Japan
- India
- South Korea
- Rest of Asia-Pacific
- LAMEA
- Latin America
- Middle East
- Africa
Key Market Players:
- Qualcomm Technologies, Inc.
- Apple Inc.
- NVIDIA Corporation
- Samsung
- HiSilicon (Huawei Technologies)
- Intel Corporation
- MediaTek Inc.
- NXP semiconductors
- Unisoc (Shanghai) Technologies Co., Ltd.
- Advanced Micro Devices, Inc.
TABLE OF CONTENTS
CHAPTER 1: INTRODUCTION
- 1.1. Report description
- 1.2. Key market segments
- 1.3. Key benefits to the stakeholders
- 1.4. Research methodology
- 1.4.1. Primary research
- 1.4.2. Secondary research
- 1.4.3. Analyst tools and models
CHAPTER 2: EXECUTIVE SUMMARY
- 2.1. CXO Perspective
CHAPTER 3: MARKET OVERVIEW
- 3.1. Market definition and scope
- 3.2. Key findings
- 3.2.1. Top impacting factors
- 3.2.2. Top investment pockets
- 3.3. Porter's five forces analysis
- 3.3.1. Moderate to high bargaining power of suppliers
- 3.3.2. Moderate to high threat of new entrants
- 3.3.3. Moderate to high threat of substitutes
- 3.3.4. Low to high intensity of rivalry
- 3.3.5. Moderate to high bargaining power of buyers
- 3.4. Market dynamics
- 3.4.1. Drivers
- 3.4.1.1. Growth in demand for mobile devices with enhanced capabilities and advanced features
- 3.4.1.2. Prioritize power efficiency for longer battery life
- 3.4.2. Restraints
- 3.4.2.1. Rise in competition among mobile manufacturers results in pricing pressure
- 3.4.3. Opportunities
- 3.4.3.1. Increase in edge computing requires high-performance SoCs for AI inference
- 3.4.3.2. Growth in smartphone adoption in emerging markets offer untapped growth potential
- 3.4.1. Drivers
CHAPTER 4: MOBILE SOC MARKET, BY OPERATING SYSTEM
- 4.1. Overview
- 4.1.1. Market size and forecast
- 4.2. Android
- 4.2.1. Key market trends, growth factors and opportunities
- 4.2.2. Market size and forecast, by region
- 4.2.3. Market share analysis by country
- 4.3. iOS
- 4.3.1. Key market trends, growth factors and opportunities
- 4.3.2. Market size and forecast, by region
- 4.3.3. Market share analysis by country
CHAPTER 5: MOBILE SOC MARKET, BY CORE TYPE
- 5.1. Overview
- 5.1.1. Market size and forecast
- 5.2. Quad Core
- 5.2.1. Key market trends, growth factors and opportunities
- 5.2.2. Market size and forecast, by region
- 5.2.3. Market share analysis by country
- 5.3. Octa Core
- 5.3.1. Key market trends, growth factors and opportunities
- 5.3.2. Market size and forecast, by region
- 5.3.3. Market share analysis by country
- 5.4. Hexa Core
- 5.4.1. Key market trends, growth factors and opportunities
- 5.4.2. Market size and forecast, by region
- 5.4.3. Market share analysis by country
- 5.5. Others
- 5.5.1. Key market trends, growth factors and opportunities
- 5.5.2. Market size and forecast, by region
- 5.5.3. Market share analysis by country
CHAPTER 6: MOBILE SOC MARKET, BY REGION
- 6.1. Overview
- 6.1.1. Market size and forecast By Region
- 6.2. North America
- 6.2.1. Key market trends, growth factors and opportunities
- 6.2.2. Market size and forecast, by Operating System
- 6.2.3. Market size and forecast, by Core Type
- 6.2.4. Market size and forecast, by country
- 6.2.4.1. U.S.
- 6.2.4.1.1. Market size and forecast, by Operating System
- 6.2.4.1.2. Market size and forecast, by Core Type
- 6.2.4.2. Canada
- 6.2.4.2.1. Market size and forecast, by Operating System
- 6.2.4.2.2. Market size and forecast, by Core Type
- 6.2.4.3. Mexico
- 6.2.4.3.1. Market size and forecast, by Operating System
- 6.2.4.3.2. Market size and forecast, by Core Type
- 6.3. Europe
- 6.3.1. Key market trends, growth factors and opportunities
- 6.3.2. Market size and forecast, by Operating System
- 6.3.3. Market size and forecast, by Core Type
- 6.3.4. Market size and forecast, by country
- 6.3.4.1. UK
- 6.3.4.1.1. Market size and forecast, by Operating System
- 6.3.4.1.2. Market size and forecast, by Core Type
- 6.3.4.2. Germany
- 6.3.4.2.1. Market size and forecast, by Operating System
- 6.3.4.2.2. Market size and forecast, by Core Type
- 6.3.4.3. France
- 6.3.4.3.1. Market size and forecast, by Operating System
- 6.3.4.3.2. Market size and forecast, by Core Type
- 6.3.4.4. Rest of Europe
- 6.3.4.4.1. Market size and forecast, by Operating System
- 6.3.4.4.2. Market size and forecast, by Core Type
- 6.4. Asia-Pacific
- 6.4.1. Key market trends, growth factors and opportunities
- 6.4.2. Market size and forecast, by Operating System
- 6.4.3. Market size and forecast, by Core Type
- 6.4.4. Market size and forecast, by country
- 6.4.4.1. China
- 6.4.4.1.1. Market size and forecast, by Operating System
- 6.4.4.1.2. Market size and forecast, by Core Type
- 6.4.4.2. Japan
- 6.4.4.2.1. Market size and forecast, by Operating System
- 6.4.4.2.2. Market size and forecast, by Core Type
- 6.4.4.3. India
- 6.4.4.3.1. Market size and forecast, by Operating System
- 6.4.4.3.2. Market size and forecast, by Core Type
- 6.4.4.4. South Korea
- 6.4.4.4.1. Market size and forecast, by Operating System
- 6.4.4.4.2. Market size and forecast, by Core Type
- 6.4.4.5. Rest of Asia-Pacific
- 6.4.4.5.1. Market size and forecast, by Operating System
- 6.4.4.5.2. Market size and forecast, by Core Type
- 6.5. LAMEA
- 6.5.1. Key market trends, growth factors and opportunities
- 6.5.2. Market size and forecast, by Operating System
- 6.5.3. Market size and forecast, by Core Type
- 6.5.4. Market size and forecast, by country
- 6.5.4.1. Latin America
- 6.5.4.1.1. Market size and forecast, by Operating System
- 6.5.4.1.2. Market size and forecast, by Core Type
- 6.5.4.2. Middle East
- 6.5.4.2.1. Market size and forecast, by Operating System
- 6.5.4.2.2. Market size and forecast, by Core Type
- 6.5.4.3. Africa
- 6.5.4.3.1. Market size and forecast, by Operating System
- 6.5.4.3.2. Market size and forecast, by Core Type
CHAPTER 7: COMPETITIVE LANDSCAPE
- 7.1. Introduction
- 7.2. Top winning strategies
- 7.3. Product mapping of top 10 player
- 7.4. Competitive dashboard
- 7.5. Competitive heatmap
- 7.6. Top player positioning, 2022
CHAPTER 8: COMPANY PROFILES
- 8.1. Advanced Micro Devices, Inc.
- 8.1.1. Company overview
- 8.1.2. Key executives
- 8.1.3. Company snapshot
- 8.1.4. Operating business segments
- 8.1.5. Product portfolio
- 8.1.6. Business performance
- 8.1.7. Key strategic moves and developments
- 8.2. Intel Corporation
- 8.2.1. Company overview
- 8.2.2. Key executives
- 8.2.3. Company snapshot
- 8.2.4. Operating business segments
- 8.2.5. Product portfolio
- 8.2.6. Business performance
- 8.3. Qualcomm Technologies, Inc.
- 8.3.1. Company overview
- 8.3.2. Key executives
- 8.3.3. Company snapshot
- 8.3.4. Operating business segments
- 8.3.5. Product portfolio
- 8.3.6. Business performance
- 8.3.7. Key strategic moves and developments
- 8.4. Apple Inc.
- 8.4.1. Company overview
- 8.4.2. Key executives
- 8.4.3. Company snapshot
- 8.4.4. Operating business segments
- 8.4.5. Product portfolio
- 8.4.6. Business performance
- 8.5. Samsung
- 8.5.1. Company overview
- 8.5.2. Key executives
- 8.5.3. Company snapshot
- 8.5.4. Operating business segments
- 8.5.5. Product portfolio
- 8.5.6. Business performance
- 8.6. MediaTek Inc.
- 8.6.1. Company overview
- 8.6.2. Key executives
- 8.6.3. Company snapshot
- 8.6.4. Operating business segments
- 8.6.5. Product portfolio
- 8.6.6. Business performance
- 8.6.7. Key strategic moves and developments
- 8.7. HiSilicon (Huawei Technologies)
- 8.7.1. Company overview
- 8.7.2. Key executives
- 8.7.3. Company snapshot
- 8.7.4. Operating business segments
- 8.7.5. Product portfolio
- 8.7.6. Business performance
- 8.7.7. Key strategic moves and developments
- 8.8. NVIDIA Corporation
- 8.8.1. Company overview
- 8.8.2. Key executives
- 8.8.3. Company snapshot
- 8.8.4. Operating business segments
- 8.8.5. Product portfolio
- 8.8.6. Business performance
- 8.9. Unisoc (Shanghai) Technologies Co., Ltd.
- 8.9.1. Company overview
- 8.9.2. Key executives
- 8.9.3. Company snapshot
- 8.9.4. Operating business segments
- 8.9.5. Product portfolio
- 8.10. NXP semiconductors
- 8.10.1. Company overview
- 8.10.2. Key executives
- 8.10.3. Company snapshot
- 8.10.4. Operating business segments
- 8.10.5. Product portfolio
- 8.10.6. Business performance
