
|
市場調査レポート
商品コード
1447159
ハイブリッドキャパシタ市場:製品タイプ別、用途別:世界の機会分析と産業予測、2023-2032年Hybrid Capacitor Market By Product Type (Radial Type, Laminating Type), By Application (Power Generation, Transmission, Distribution, Others): Global Opportunity Analysis and Industry Forecast, 2023-2032 |
||||||
|
|||||||

| ハイブリッドキャパシタ市場:製品タイプ別、用途別:世界の機会分析と産業予測、2023-2032年 |
|
出版日: 2024年01月30日
発行: Allied Market Research
ページ情報: 英文 233 Pages
納期: 2~3営業日
|

- 全表示
- 概要
- 図表
- 目次
電気化学キャパシタやスーパーキャパシタとも呼ばれるハイブリッドキャパシタは、従来のキャパシタと電池の両方の特徴を統合した、エネルギー貯蔵デバイスの異なるカテゴリーに属します。
電極の電荷分離に依存する標準的なキャパシタや化学反応を伴う電池とは対照的に、ハイブリッドキャパシタは静電二重層キャパシタンス(EDLC)と擬似キャパシタンスのメカニズムを融合させています。この融合により、高電力密度、迅速な充放電能力、サイクル寿命の延長を特徴とするデバイスが生まれます。
自動車分野では、特に電気自動車(EV)やハイブリッド電気自動車(HEV)において、ハイブリッドキャパシタが極めて重要な役割を果たしています。その高い電力密度により、加速時の急速なエネルギーバーストが可能になり、電気自動車全体の性能向上に貢献しています。さらに、ハイブリッドキャパシタは回生ブレーキ・システムにおいて重要な役割を果たし、車両の減速時にエネルギーを回収して蓄えます。この蓄えられたエネルギーは、従来のブレーキ・システムでは熱として放散してしまうが、加速時に効率的に利用されるため、電気自動車のエネルギー効率の向上と航続距離の延長につながります。急速な充放電サイクルを管理するハイブリッドキャパシタの能力は、自動車アプリケーションの動的なエネルギー管理要件に対応する上で特に有用です。
民生用電子機器では、ハイブリッドキャパシタは様々な用途に使用され、効果的で高性能なエネルギー貯蔵ソリューションに対する需要の高まりに対応しています。主な用途は、スマートフォン、ノートパソコン、タブレットなどの携帯電子機器です。ハイブリッドキャパシタは、電力とエネルギー貯蔵の間でバランスの取れた特性を持つため、これらの機器に組み込まれています。ハイブリッドキャパシタの迅速な充放電機能は、電子機器の充電時間の短縮に貢献し、ユーザーの利便性を高めます。さらに、その耐久性とサイクル寿命は、頻繁な充放電が行われる用途に適しています。
医療機器もまた、ハイブリッドキャパシタの組み込みからメリットを得ており、特に急速なエネルギー放出が必要な機器に適しています。除細動器や特定の監視装置などの重要な医療機器は、ハイブリッドキャパシタの迅速な応答とエネルギー供給能力に依存しており、必要不可欠な医療介入の有効性と信頼性を高めています。
ハイブリッドキャパシタ市場は、そのコンパクトなサイズと高密度実装への適合性と相まって、自動車アプリケーションにおけるラジアルタイプ・ハイブリッドキャパシタの採用増加により、大きな成長が見込まれています。さらに、再生可能エネルギー市場の増加と耐振動性の向上は、予測期間中の市場成長に有利な機会を提供すると予想されます。逆に、エネルギー密度が低いことがハイブリッドキャパシタ市場の成長を制限しています。
ハイブリッドキャパシタ市場は、製品タイプ、用途、地域に区分されます。製品タイプ別では、市場はラジアルタイプとラミネートタイプに分けられます。2022年には、ラミネートタイプセグメントが市場を独占し、自動車用途でのハイブリッドキャパシタ使用の増加により、ラジアルタイプが2032年までに主要市場シェアを獲得すると予想されます。用途別では、市場は発電、送電、配電、その他に分類されます。2022年には、発電分野が市場を独占し、公共事業分野への政府および非公開会社の投資の増加により、2032年までに主要市場シェアを獲得すると予想されます。
地域別では、北米(米国、カナダ、メキシコ)、欧州(ドイツ、英国、フランス、スペイン、イタリア、その他欧州地域)、アジア太平洋(中国、日本、インド、韓国、その他アジア太平洋地域)、LAMEA(ブラジル、南アフリカ、サウジアラビア、その他南米地域)のハイブリッドキャパシタ市場動向が分析されています。
利害関係者にとっての主なメリット
- 当レポートでは、2022年から2032年までのハイブリッドコンデンサ市場分析の市場セグメント、現在の動向、推定・動向、ダイナミクスを定量的に分析し、ハイブリッドコンデンサ市場の有力な機会を特定します。
- 市場促進要因、市場抑制要因、市場機会に関連する情報とともに市場調査を提供します。
- ポーターのファイブフォース分析では、利害関係者が利益重視のビジネス決定を下し、サプライヤーとバイヤーのネットワークを強化できるよう、バイヤーとサプライヤーの潜在力を明らかにします。
- ハイブリッドキャパシタ市場のセグメンテーションを詳細に分析することで、市場機会を見極めることができます。
- 各地域の主要国は、世界市場への収益貢献度に応じてマッピングされています。
- 市場プレイヤーのポジショニングはベンチマーキングを容易にし、市場プレイヤーの現在のポジションを明確に理解することができます。
- 地域別および世界のハイブリッドキャパシタ市場動向、主要企業、市場セグメント、応用分野、市場成長戦略などの分析を含みます。
本レポートで可能なカスタマイズ
- サプライチェーン分析とベンダーマージン
- 主要企業の新製品開発/製品マトリックス
- 顧客の関心に応じた追加企業プロファイル
- 輸出入分析/データ
- 世界/地域/国別プレーヤーシェア分析
目次
第1章 イントロダクション
第2章 エグゼクティブサマリー
第3章 市場概要
- 市場の定義と範囲
- 主な調査結果
- 影響要因
- 主な投資機会
- ポーターのファイブフォース分析
- 市場力学
- 促進要因
- 抑制要因
- 機会
第4章 ハイブリッドキャパシタ市場:製品タイプ別
- 概要
- ラジアルタイプ
- ラミネートタイプ
第5章 ハイブリッドキャパシタ市場:用途別
- 概要
- 発電
- 送電
- 配電
- その他
第6章 ハイブリッドキャパシタ市場:地域別
- 概要
- 北米
- 米国
- カナダ
- メキシコ
- 欧州
- ドイツ
- 英国
- フランス
- スペイン
- イタリア
- その他
- アジア太平洋
- 中国
- 日本
- インド
- 韓国
- その他
- ラテンアメリカ
- ボリビア
- アルゼンチン
- その他ラテンアメリカ
- 中東・アフリカ
- サウジアラビア
- アフリカ
- その他中東とアフリカ
第7章 競合情勢
- イントロダクション
- 主要成功戦略
- 主要10社の製品マッピング
- 競合ダッシュボード
- 競合ヒートマップ
- 主要企業のポジショニング、2022年
第8章 企業プロファイル
- JTEKT Corporation
- TAIYO YUDEN CO., LTD.
- Vishay Intertechnology, Inc.
- LICAP Technologies, Inc.
- SOCOMEC GROUP
- EVE Energy Co., Ltd.
- SPEL TECHNOLOGIES PRIVATE LTD.
- Electro Standards Laboratories
- Yunasko
- KEMET Corporation
LIST OF TABLES
- TABLE 01. GLOBAL HYBRID CAPACITOR MARKET, BY PRODUCT TYPE, 2022-2032 ($MILLION)
- TABLE 02. HYBRID CAPACITOR MARKET FOR RADIAL TYPE, BY REGION, 2022-2032 ($MILLION)
- TABLE 03. HYBRID CAPACITOR MARKET FOR LAMINATING TYPE, BY REGION, 2022-2032 ($MILLION)
- TABLE 04. GLOBAL HYBRID CAPACITOR MARKET, BY APPLICATION, 2022-2032 ($MILLION)
- TABLE 05. HYBRID CAPACITOR MARKET FOR POWER GENERATION, BY REGION, 2022-2032 ($MILLION)
- TABLE 06. HYBRID CAPACITOR MARKET FOR TRANSMISSION, BY REGION, 2022-2032 ($MILLION)
- TABLE 07. HYBRID CAPACITOR MARKET FOR DISTRIBUTION, BY REGION, 2022-2032 ($MILLION)
- TABLE 08. HYBRID CAPACITOR MARKET FOR OTHERS, BY REGION, 2022-2032 ($MILLION)
- TABLE 09. HYBRID CAPACITOR MARKET, BY REGION, 2022-2032 ($MILLION)
- TABLE 10. NORTH AMERICA HYBRID CAPACITOR MARKET, BY PRODUCT TYPE, 2022-2032 ($MILLION)
- TABLE 11. NORTH AMERICA HYBRID CAPACITOR MARKET, BY APPLICATION, 2022-2032 ($MILLION)
- TABLE 12. NORTH AMERICA HYBRID CAPACITOR MARKET, BY COUNTRY, 2022-2032 ($MILLION)
- TABLE 13. U.S. HYBRID CAPACITOR MARKET, BY PRODUCT TYPE, 2022-2032 ($MILLION)
- TABLE 14. U.S. HYBRID CAPACITOR MARKET, BY APPLICATION, 2022-2032 ($MILLION)
- TABLE 15. CANADA HYBRID CAPACITOR MARKET, BY PRODUCT TYPE, 2022-2032 ($MILLION)
- TABLE 16. CANADA HYBRID CAPACITOR MARKET, BY APPLICATION, 2022-2032 ($MILLION)
- TABLE 17. MEXICO HYBRID CAPACITOR MARKET, BY PRODUCT TYPE, 2022-2032 ($MILLION)
- TABLE 18. MEXICO HYBRID CAPACITOR MARKET, BY APPLICATION, 2022-2032 ($MILLION)
- TABLE 19. EUROPE HYBRID CAPACITOR MARKET, BY PRODUCT TYPE, 2022-2032 ($MILLION)
- TABLE 20. EUROPE HYBRID CAPACITOR MARKET, BY APPLICATION, 2022-2032 ($MILLION)
- TABLE 21. EUROPE HYBRID CAPACITOR MARKET, BY COUNTRY, 2022-2032 ($MILLION)
- TABLE 22. GERMANY HYBRID CAPACITOR MARKET, BY PRODUCT TYPE, 2022-2032 ($MILLION)
- TABLE 23. GERMANY HYBRID CAPACITOR MARKET, BY APPLICATION, 2022-2032 ($MILLION)
- TABLE 24. UK HYBRID CAPACITOR MARKET, BY PRODUCT TYPE, 2022-2032 ($MILLION)
- TABLE 25. UK HYBRID CAPACITOR MARKET, BY APPLICATION, 2022-2032 ($MILLION)
- TABLE 26. FRANCE HYBRID CAPACITOR MARKET, BY PRODUCT TYPE, 2022-2032 ($MILLION)
- TABLE 27. FRANCE HYBRID CAPACITOR MARKET, BY APPLICATION, 2022-2032 ($MILLION)
- TABLE 28. SPAIN HYBRID CAPACITOR MARKET, BY PRODUCT TYPE, 2022-2032 ($MILLION)
- TABLE 29. SPAIN HYBRID CAPACITOR MARKET, BY APPLICATION, 2022-2032 ($MILLION)
- TABLE 30. ITALY HYBRID CAPACITOR MARKET, BY PRODUCT TYPE, 2022-2032 ($MILLION)
- TABLE 31. ITALY HYBRID CAPACITOR MARKET, BY APPLICATION, 2022-2032 ($MILLION)
- TABLE 32. REST OF EUROPE HYBRID CAPACITOR MARKET, BY PRODUCT TYPE, 2022-2032 ($MILLION)
- TABLE 33. REST OF EUROPE HYBRID CAPACITOR MARKET, BY APPLICATION, 2022-2032 ($MILLION)
- TABLE 34. ASIA-PACIFIC HYBRID CAPACITOR MARKET, BY PRODUCT TYPE, 2022-2032 ($MILLION)
- TABLE 35. ASIA-PACIFIC HYBRID CAPACITOR MARKET, BY APPLICATION, 2022-2032 ($MILLION)
- TABLE 36. ASIA-PACIFIC HYBRID CAPACITOR MARKET, BY COUNTRY, 2022-2032 ($MILLION)
- TABLE 37. CHINA HYBRID CAPACITOR MARKET, BY PRODUCT TYPE, 2022-2032 ($MILLION)
- TABLE 38. CHINA HYBRID CAPACITOR MARKET, BY APPLICATION, 2022-2032 ($MILLION)
- TABLE 39. JAPAN HYBRID CAPACITOR MARKET, BY PRODUCT TYPE, 2022-2032 ($MILLION)
- TABLE 40. JAPAN HYBRID CAPACITOR MARKET, BY APPLICATION, 2022-2032 ($MILLION)
- TABLE 41. INDIA HYBRID CAPACITOR MARKET, BY PRODUCT TYPE, 2022-2032 ($MILLION)
- TABLE 42. INDIA HYBRID CAPACITOR MARKET, BY APPLICATION, 2022-2032 ($MILLION)
- TABLE 43. SOUTH KOREA HYBRID CAPACITOR MARKET, BY PRODUCT TYPE, 2022-2032 ($MILLION)
- TABLE 44. SOUTH KOREA HYBRID CAPACITOR MARKET, BY APPLICATION, 2022-2032 ($MILLION)
- TABLE 45. REST OF ASIA-PACIFIC HYBRID CAPACITOR MARKET, BY PRODUCT TYPE, 2022-2032 ($MILLION)
- TABLE 46. REST OF ASIA-PACIFIC HYBRID CAPACITOR MARKET, BY APPLICATION, 2022-2032 ($MILLION)
- TABLE 47. LATIN AMERICA HYBRID CAPACITOR MARKET, BY PRODUCT TYPE, 2022-2032 ($MILLION)
- TABLE 48. LATIN AMERICA HYBRID CAPACITOR MARKET, BY APPLICATION, 2022-2032 ($MILLION)
- TABLE 49. LATIN AMERICA HYBRID CAPACITOR MARKET, BY COUNTRY, 2022-2032 ($MILLION)
- TABLE 50. BOLIVIA HYBRID CAPACITOR MARKET, BY PRODUCT TYPE, 2022-2032 ($MILLION)
- TABLE 51. BOLIVIA HYBRID CAPACITOR MARKET, BY APPLICATION, 2022-2032 ($MILLION)
- TABLE 52. ARGENTINA HYBRID CAPACITOR MARKET, BY PRODUCT TYPE, 2022-2032 ($MILLION)
- TABLE 53. ARGENTINA HYBRID CAPACITOR MARKET, BY APPLICATION, 2022-2032 ($MILLION)
- TABLE 54. REST OF LATIN AMERICA HYBRID CAPACITOR MARKET, BY PRODUCT TYPE, 2022-2032 ($MILLION)
- TABLE 55. REST OF LATIN AMERICA HYBRID CAPACITOR MARKET, BY APPLICATION, 2022-2032 ($MILLION)
- TABLE 56. MIDDLE EAST AND AFRICA HYBRID CAPACITOR MARKET, BY PRODUCT TYPE, 2022-2032 ($MILLION)
- TABLE 57. MIDDLE EAST AND AFRICA HYBRID CAPACITOR MARKET, BY APPLICATION, 2022-2032 ($MILLION)
- TABLE 58. MIDDLE EAST AND AFRICA HYBRID CAPACITOR MARKET, BY COUNTRY, 2022-2032 ($MILLION)
- TABLE 59. SAUDI ARABIA HYBRID CAPACITOR MARKET, BY PRODUCT TYPE, 2022-2032 ($MILLION)
- TABLE 60. SAUDI ARABIA HYBRID CAPACITOR MARKET, BY APPLICATION, 2022-2032 ($MILLION)
- TABLE 61. AFRICA HYBRID CAPACITOR MARKET, BY PRODUCT TYPE, 2022-2032 ($MILLION)
- TABLE 62. AFRICA HYBRID CAPACITOR MARKET, BY APPLICATION, 2022-2032 ($MILLION)
- TABLE 63. REST OF MIDDLE EAST AND AFRICA HYBRID CAPACITOR MARKET, BY PRODUCT TYPE, 2022-2032 ($MILLION)
- TABLE 64. REST OF MIDDLE EAST AND AFRICA HYBRID CAPACITOR MARKET, BY APPLICATION, 2022-2032 ($MILLION)
- TABLE 65. JTEKT CORPORATION: KEY EXECUTIVES
- TABLE 66. JTEKT CORPORATION: COMPANY SNAPSHOT
- TABLE 67. JTEKT CORPORATION: PRODUCT SEGMENTS
- TABLE 68. JTEKT CORPORATION: SERVICE SEGMENTS
- TABLE 69. JTEKT CORPORATION: PRODUCT PORTFOLIO
- TABLE 70. JTEKT CORPORATION: KEY STRATERGIES
- TABLE 71. TAIYO YUDEN CO., LTD.: KEY EXECUTIVES
- TABLE 72. TAIYO YUDEN CO., LTD.: COMPANY SNAPSHOT
- TABLE 73. TAIYO YUDEN CO., LTD.: PRODUCT SEGMENTS
- TABLE 74. TAIYO YUDEN CO., LTD.: SERVICE SEGMENTS
- TABLE 75. TAIYO YUDEN CO., LTD.: PRODUCT PORTFOLIO
- TABLE 76. TAIYO YUDEN CO., LTD.: KEY STRATERGIES
- TABLE 77. VISHAY INTERTECHNOLOGY, INC.: KEY EXECUTIVES
- TABLE 78. VISHAY INTERTECHNOLOGY, INC.: COMPANY SNAPSHOT
- TABLE 79. VISHAY INTERTECHNOLOGY, INC.: PRODUCT SEGMENTS
- TABLE 80. VISHAY INTERTECHNOLOGY, INC.: SERVICE SEGMENTS
- TABLE 81. VISHAY INTERTECHNOLOGY, INC.: PRODUCT PORTFOLIO
- TABLE 82. VISHAY INTERTECHNOLOGY, INC.: KEY STRATERGIES
- TABLE 83. LICAP TECHNOLOGIES, INC.: KEY EXECUTIVES
- TABLE 84. LICAP TECHNOLOGIES, INC.: COMPANY SNAPSHOT
- TABLE 85. LICAP TECHNOLOGIES, INC.: PRODUCT SEGMENTS
- TABLE 86. LICAP TECHNOLOGIES, INC.: SERVICE SEGMENTS
- TABLE 87. LICAP TECHNOLOGIES, INC.: PRODUCT PORTFOLIO
- TABLE 88. LICAP TECHNOLOGIES, INC.: KEY STRATERGIES
- TABLE 89. SOCOMEC GROUP: KEY EXECUTIVES
- TABLE 90. SOCOMEC GROUP: COMPANY SNAPSHOT
- TABLE 91. SOCOMEC GROUP: PRODUCT SEGMENTS
- TABLE 92. SOCOMEC GROUP: SERVICE SEGMENTS
- TABLE 93. SOCOMEC GROUP: PRODUCT PORTFOLIO
- TABLE 94. SOCOMEC GROUP: KEY STRATERGIES
- TABLE 95. EVE ENERGY CO., LTD.: KEY EXECUTIVES
- TABLE 96. EVE ENERGY CO., LTD.: COMPANY SNAPSHOT
- TABLE 97. EVE ENERGY CO., LTD.: PRODUCT SEGMENTS
- TABLE 98. EVE ENERGY CO., LTD.: SERVICE SEGMENTS
- TABLE 99. EVE ENERGY CO., LTD.: PRODUCT PORTFOLIO
- TABLE 100. EVE ENERGY CO., LTD.: KEY STRATERGIES
- TABLE 101. SPEL TECHNOLOGIES PRIVATE LTD.: KEY EXECUTIVES
- TABLE 102. SPEL TECHNOLOGIES PRIVATE LTD.: COMPANY SNAPSHOT
- TABLE 103. SPEL TECHNOLOGIES PRIVATE LTD.: PRODUCT SEGMENTS
- TABLE 104. SPEL TECHNOLOGIES PRIVATE LTD.: SERVICE SEGMENTS
- TABLE 105. SPEL TECHNOLOGIES PRIVATE LTD.: PRODUCT PORTFOLIO
- TABLE 106. SPEL TECHNOLOGIES PRIVATE LTD.: KEY STRATERGIES
- TABLE 107. ELECTRO STANDARDS LABORATORIES: KEY EXECUTIVES
- TABLE 108. ELECTRO STANDARDS LABORATORIES: COMPANY SNAPSHOT
- TABLE 109. ELECTRO STANDARDS LABORATORIES: PRODUCT SEGMENTS
- TABLE 110. ELECTRO STANDARDS LABORATORIES: SERVICE SEGMENTS
- TABLE 111. ELECTRO STANDARDS LABORATORIES: PRODUCT PORTFOLIO
- TABLE 112. ELECTRO STANDARDS LABORATORIES: KEY STRATERGIES
- TABLE 113. YUNASKO: KEY EXECUTIVES
- TABLE 114. YUNASKO: COMPANY SNAPSHOT
- TABLE 115. YUNASKO: PRODUCT SEGMENTS
- TABLE 116. YUNASKO: SERVICE SEGMENTS
- TABLE 117. YUNASKO: PRODUCT PORTFOLIO
- TABLE 118. YUNASKO: KEY STRATERGIES
- TABLE 119. KEMET CORPORATION: KEY EXECUTIVES
- TABLE 120. KEMET CORPORATION: COMPANY SNAPSHOT
- TABLE 121. KEMET CORPORATION: PRODUCT SEGMENTS
- TABLE 122. KEMET CORPORATION: SERVICE SEGMENTS
- TABLE 123. KEMET CORPORATION: PRODUCT PORTFOLIO
- TABLE 124. KEMET CORPORATION: KEY STRATERGIES
LIST OF FIGURES
- FIGURE 01. HYBRID CAPACITOR MARKET, 2022-2032
- FIGURE 02. SEGMENTATION OF HYBRID CAPACITOR MARKET,2022-2032
- FIGURE 03. TOP IMPACTING FACTORS IN HYBRID CAPACITOR MARKET
- FIGURE 04. TOP INVESTMENT POCKETS IN HYBRID CAPACITOR MARKET (2023-2032)
- FIGURE 05. BARGAINING POWER OF SUPPLIERS
- FIGURE 06. BARGAINING POWER OF BUYERS
- FIGURE 07. THREAT OF SUBSTITUTION
- FIGURE 08. THREAT OF SUBSTITUTION
- FIGURE 09. COMPETITIVE RIVALRY
- FIGURE 10. GLOBAL HYBRID CAPACITOR MARKET:DRIVERS, RESTRAINTS AND OPPORTUNITIES
- FIGURE 11. HYBRID CAPACITOR MARKET, BY PRODUCT TYPE, 2022 AND 2032(%)
- FIGURE 12. COMPARATIVE SHARE ANALYSIS OF HYBRID CAPACITOR MARKET FOR RADIAL TYPE, BY COUNTRY 2022 AND 2032(%)
- FIGURE 13. COMPARATIVE SHARE ANALYSIS OF HYBRID CAPACITOR MARKET FOR LAMINATING TYPE, BY COUNTRY 2022 AND 2032(%)
- FIGURE 14. HYBRID CAPACITOR MARKET, BY APPLICATION, 2022 AND 2032(%)
- FIGURE 15. COMPARATIVE SHARE ANALYSIS OF HYBRID CAPACITOR MARKET FOR POWER GENERATION, BY COUNTRY 2022 AND 2032(%)
- FIGURE 16. COMPARATIVE SHARE ANALYSIS OF HYBRID CAPACITOR MARKET FOR TRANSMISSION, BY COUNTRY 2022 AND 2032(%)
- FIGURE 17. COMPARATIVE SHARE ANALYSIS OF HYBRID CAPACITOR MARKET FOR DISTRIBUTION, BY COUNTRY 2022 AND 2032(%)
- FIGURE 18. COMPARATIVE SHARE ANALYSIS OF HYBRID CAPACITOR MARKET FOR OTHERS, BY COUNTRY 2022 AND 2032(%)
- FIGURE 19. HYBRID CAPACITOR MARKET BY REGION, 2022 AND 2032(%)
- FIGURE 20. U.S. HYBRID CAPACITOR MARKET, 2022-2032 ($MILLION)
- FIGURE 21. CANADA HYBRID CAPACITOR MARKET, 2022-2032 ($MILLION)
- FIGURE 22. MEXICO HYBRID CAPACITOR MARKET, 2022-2032 ($MILLION)
- FIGURE 23. GERMANY HYBRID CAPACITOR MARKET, 2022-2032 ($MILLION)
- FIGURE 24. UK HYBRID CAPACITOR MARKET, 2022-2032 ($MILLION)
- FIGURE 25. FRANCE HYBRID CAPACITOR MARKET, 2022-2032 ($MILLION)
- FIGURE 26. SPAIN HYBRID CAPACITOR MARKET, 2022-2032 ($MILLION)
- FIGURE 27. ITALY HYBRID CAPACITOR MARKET, 2022-2032 ($MILLION)
- FIGURE 28. REST OF EUROPE HYBRID CAPACITOR MARKET, 2022-2032 ($MILLION)
- FIGURE 29. CHINA HYBRID CAPACITOR MARKET, 2022-2032 ($MILLION)
- FIGURE 30. JAPAN HYBRID CAPACITOR MARKET, 2022-2032 ($MILLION)
- FIGURE 31. INDIA HYBRID CAPACITOR MARKET, 2022-2032 ($MILLION)
- FIGURE 32. SOUTH KOREA HYBRID CAPACITOR MARKET, 2022-2032 ($MILLION)
- FIGURE 33. REST OF ASIA-PACIFIC HYBRID CAPACITOR MARKET, 2022-2032 ($MILLION)
- FIGURE 34. BOLIVIA HYBRID CAPACITOR MARKET, 2022-2032 ($MILLION)
- FIGURE 35. ARGENTINA HYBRID CAPACITOR MARKET, 2022-2032 ($MILLION)
- FIGURE 36. REST OF LATIN AMERICA HYBRID CAPACITOR MARKET, 2022-2032 ($MILLION)
- FIGURE 37. SAUDI ARABIA HYBRID CAPACITOR MARKET, 2022-2032 ($MILLION)
- FIGURE 38. AFRICA HYBRID CAPACITOR MARKET, 2022-2032 ($MILLION)
- FIGURE 39. REST OF MIDDLE EAST AND AFRICA HYBRID CAPACITOR MARKET, 2022-2032 ($MILLION)
- FIGURE 40. TOP WINNING STRATEGIES, BY YEAR
- FIGURE 41. TOP WINNING STRATEGIES, BY DEVELOPMENT
- FIGURE 42. TOP WINNING STRATEGIES, BY COMPANY
- FIGURE 43. PRODUCT MAPPING OF TOP 10 PLAYERS
- FIGURE 44. COMPETITIVE DASHBOARD
- FIGURE 45. COMPETITIVE HEATMAP: HYBRID CAPACITOR MARKET
- FIGURE 46. TOP PLAYER POSITIONING, 2022
Hybrid capacitors, also referred to as electrochemical capacitors or supercapacitors, belong to a distinct category of energy storage devices that integrate features from both conventional capacitors and batteries. In contrast to standard capacitors relying on electrode charge separation and batteries involving chemical reactions, hybrid capacitors combine electrostatic double-layer capacitance (EDLC) and pseudo-capacitance mechanisms. This fusion results in a device characterized by high power density, swift charge and discharge capabilities, and an extended cycle life.
Within the automotive sector, hybrid capacitors hold a pivotal role, particularly in electric vehicles (EVs) and hybrid electric vehicles (HEVs). Their elevated power density allows for rapid energy bursts during acceleration, contributing to the overall enhancement of electric vehicle performance. Furthermore, hybrid capacitors play a crucial part in regenerative braking systems, capturing and storing energy during vehicle deceleration. This stored energy, which would otherwise dissipate as heat in traditional braking systems, is efficiently utilized for acceleration, leading to improved energy efficiency and increased range for electric vehicles. The capability of hybrid capacitors to manage rapid charge and discharge cycles proves particularly helpful in addressing the dynamic energy management requirements of automotive applications.
In consumer electronics, hybrid capacitors serve varied purposes, meeting the escalating demand for effective and high-performance energy storage solutions. A primary application lies in portable electronic devices like smartphones, laptops, and tablets. Hybrid capacitors are integrated into these devices due to their balanced attributes between power and energy storage. The swift charging and discharging features of hybrid capacitors contribute to expedited charging times for electronic devices, enhancing user convenience. In addition, their durability and cycle life make them well-suited for applications where frequent charging and discharging are prevalent.
Medical devices also derive benefits from the incorporation of hybrid capacitors, especially those necessitating rapid energy release. Critical medical equipment such as defibrillators and specific monitoring devices rely on the prompt response and energy delivery capabilities of hybrid capacitors, enhancing the efficacy and reliability of essential medical interventions.
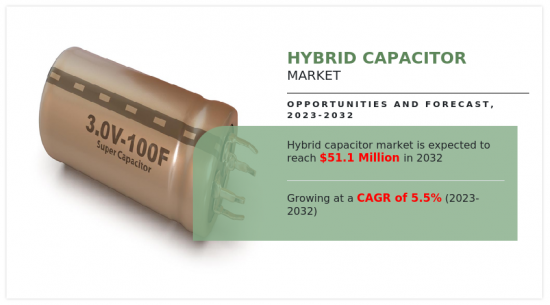
The hybrid capacitor market is expected to witness significant growth, driven by the increase in adoption of radial type hybrid capacitors in automotive applications, coupled with their compact size and compatibility for high-density packaging. Moreover, increase in renewable energy market and improved vibration resistance are expected to provide lucrative opportunities for the growth of the market during the forecast period. On the contrary, low energy density limits the growth of the hybrid capacitor market.
The hybrid capacitor market is segmented into product type, application, and region. On the basis of product type, the market is divided into radial type and laminating type. In 2022, the laminating type segment dominated the market, and radial type is expected to acquire a major market share by 2032 owing to increase in use of hybrid capacitors in automotive application. On the basis of application, the market is categorized into power generation, transmission, distribution, and others. In 2022, the power generation segment dominated the market, and it is expected to acquire a major market share by 2032 due to an increase in investment of government and private companies in utility sector.
On the basis of region, the hybrid capacitor market trends are analyzed across North America (the U.S., Canada, and Mexico), Europe (Germany, UK, France, Spain, Italy, and rest of Europe), Asia-Pacific (China, Japan, India, South Korea, and rest of Asia-Pacific), and LAMEA (Brazil, South Africa, Saudi Arabia, and rest of LAMEA).
Competitive analysis and profiles of the major global Hybrid capacitor market players that have been provided in the report include JTEKT Corporation, TAIYO YUDEN CO., LTD., Vishay Intertechnology, Inc., LICAP Technologies, Inc., SOCOMEC GROUP, EVE Energy Co., Ltd., SPEL TECHNOLOGIES PRIVATE LTD., Electro Standards Laboratories, Yunasko, and KEMET Corporation. The key strategy adopted by the major players of the hybrid capacitor market is product launch.
Key Benefits For Stakeholders
- This report provides a quantitative analysis of the market segments, current trends, estimations, and dynamics of the hybrid capacitor market analysis from 2022 to 2032 to identify the prevailing hybrid capacitor market opportunities.
- The market research is offered along with information related to key drivers, restraints, and opportunities.
- Porter's five forces analysis highlights the potency of buyers and suppliers to enable stakeholders make profit-oriented business decisions and strengthen their supplier-buyer network.
- In-depth analysis of the hybrid capacitor market segmentation assists to determine the prevailing market opportunities.
- Major countries in each region are mapped according to their revenue contribution to the global market.
- Market player positioning facilitates benchmarking and provides a clear understanding of the present position of the market players.
- The report includes the analysis of the regional as well as global hybrid capacitor market trends, key players, market segments, application areas, and market growth strategies.
Additional benefits you will get with this purchase are:
- Quarterly Update and* (only available with a corporate license, on listed price)
- 5 additional Company Profile of client Choice pre- or Post-purchase, as a free update.
- Free Upcoming Version on the Purchase of Five and Enterprise User License.
- 16 analyst hours of support* (post-purchase, if you find additional data requirements upon review of the report, you may receive support amounting to 16 analyst hours to solve questions, and post-sale queries)
- 15% Free Customization* (in case the scope or segment of the report does not match your requirements, 15% is equivalent to 3 working days of free work, applicable once)
- Free data Pack on the Five and Enterprise User License. (Excel version of the report)
- Free Updated report if the report is 6-12 months old or older.
- 24-hour priority response*
- Free Industry updates and white papers.
Possible Customization with this report (with additional cost and timeline, please talk to the sales executive to know more)
- Supply Chain Analysis & Vendor Margins
- New Product Development/ Product Matrix of Key Players
- Additional company profiles with specific to client's interest
- Import Export Analysis/Data
- Market share analysis of players at global/region/country level
Key Market Segments
By Product Type
- Radial Type
- Laminating Type
By Application
- Power Generation
- Transmission
- Distribution
- Others
By Region
- North America
- U.S.
- Canada
- Mexico
- Europe
- Germany
- UK
- France
- Spain
- Italy
- Rest of Europe
- Asia-Pacific
- China
- Japan
- India
- South Korea
- Rest of Asia-Pacific
- Latin America
- Bolivia
- Argentina
- Rest of Latin America
- Middle East and Africa
- Saudi Arabia
- Africa
- Rest of Middle East And Africa
Key Market Players:
- JTEKT Corporation
- TAIYO YUDEN CO., LTD.
- Vishay Intertechnology, Inc.
- LICAP Technologies, Inc.
- SOCOMEC GROUP
- EVE Energy Co., Ltd.
- KEMET Corporation
- SPEL TECHNOLOGIES PRIVATE LTD.
- Yunasko
- Electro Standards Laboratories
TABLE OF CONTENTS
CHAPTER 1: INTRODUCTION
- 1.1. Report description
- 1.2. Key market segments
- 1.3. Key benefits to the stakeholders
- 1.4. Research methodology
- 1.4.1. Primary research
- 1.4.2. Secondary research
- 1.4.3. Analyst tools and models
CHAPTER 2: EXECUTIVE SUMMARY
- 2.1. CXO Perspective
CHAPTER 3: MARKET OVERVIEW
- 3.1. Market definition and scope
- 3.2. Key findings
- 3.2.1. Top impacting factors
- 3.2.2. Top investment pockets
- 3.3. Porter's five forces analysis
- 3.4. Market dynamics
- 3.4.1. Drivers
- 3.4.2. Restraints
- 3.4.3. Opportunities
CHAPTER 4: HYBRID CAPACITOR MARKET, BY PRODUCT TYPE
- 4.1. Overview
- 4.1.1. Market size and forecast
- 4.2. Radial Type
- 4.2.1. Key market trends, growth factors and opportunities
- 4.2.2. Market size and forecast, by region
- 4.2.3. Market share analysis by country
- 4.3. Laminating Type
- 4.3.1. Key market trends, growth factors and opportunities
- 4.3.2. Market size and forecast, by region
- 4.3.3. Market share analysis by country
CHAPTER 5: HYBRID CAPACITOR MARKET, BY APPLICATION
- 5.1. Overview
- 5.1.1. Market size and forecast
- 5.2. Power Generation
- 5.2.1. Key market trends, growth factors and opportunities
- 5.2.2. Market size and forecast, by region
- 5.2.3. Market share analysis by country
- 5.3. Transmission
- 5.3.1. Key market trends, growth factors and opportunities
- 5.3.2. Market size and forecast, by region
- 5.3.3. Market share analysis by country
- 5.4. Distribution
- 5.4.1. Key market trends, growth factors and opportunities
- 5.4.2. Market size and forecast, by region
- 5.4.3. Market share analysis by country
- 5.5. Others
- 5.5.1. Key market trends, growth factors and opportunities
- 5.5.2. Market size and forecast, by region
- 5.5.3. Market share analysis by country
CHAPTER 6: HYBRID CAPACITOR MARKET, BY REGION
- 6.1. Overview
- 6.1.1. Market size and forecast By Region
- 6.2. North America
- 6.2.1. Key market trends, growth factors and opportunities
- 6.2.2. Market size and forecast, by Product Type
- 6.2.3. Market size and forecast, by Application
- 6.2.4. Market size and forecast, by country
- 6.2.4.1. U.S.
- 6.2.4.1.1. Market size and forecast, by Product Type
- 6.2.4.1.2. Market size and forecast, by Application
- 6.2.4.2. Canada
- 6.2.4.2.1. Market size and forecast, by Product Type
- 6.2.4.2.2. Market size and forecast, by Application
- 6.2.4.3. Mexico
- 6.2.4.3.1. Market size and forecast, by Product Type
- 6.2.4.3.2. Market size and forecast, by Application
- 6.3. Europe
- 6.3.1. Key market trends, growth factors and opportunities
- 6.3.2. Market size and forecast, by Product Type
- 6.3.3. Market size and forecast, by Application
- 6.3.4. Market size and forecast, by country
- 6.3.4.1. Germany
- 6.3.4.1.1. Market size and forecast, by Product Type
- 6.3.4.1.2. Market size and forecast, by Application
- 6.3.4.2. UK
- 6.3.4.2.1. Market size and forecast, by Product Type
- 6.3.4.2.2. Market size and forecast, by Application
- 6.3.4.3. France
- 6.3.4.3.1. Market size and forecast, by Product Type
- 6.3.4.3.2. Market size and forecast, by Application
- 6.3.4.4. Spain
- 6.3.4.4.1. Market size and forecast, by Product Type
- 6.3.4.4.2. Market size and forecast, by Application
- 6.3.4.5. Italy
- 6.3.4.5.1. Market size and forecast, by Product Type
- 6.3.4.5.2. Market size and forecast, by Application
- 6.3.4.6. Rest of Europe
- 6.3.4.6.1. Market size and forecast, by Product Type
- 6.3.4.6.2. Market size and forecast, by Application
- 6.4. Asia-Pacific
- 6.4.1. Key market trends, growth factors and opportunities
- 6.4.2. Market size and forecast, by Product Type
- 6.4.3. Market size and forecast, by Application
- 6.4.4. Market size and forecast, by country
- 6.4.4.1. China
- 6.4.4.1.1. Market size and forecast, by Product Type
- 6.4.4.1.2. Market size and forecast, by Application
- 6.4.4.2. Japan
- 6.4.4.2.1. Market size and forecast, by Product Type
- 6.4.4.2.2. Market size and forecast, by Application
- 6.4.4.3. India
- 6.4.4.3.1. Market size and forecast, by Product Type
- 6.4.4.3.2. Market size and forecast, by Application
- 6.4.4.4. South Korea
- 6.4.4.4.1. Market size and forecast, by Product Type
- 6.4.4.4.2. Market size and forecast, by Application
- 6.4.4.5. Rest of Asia-Pacific
- 6.4.4.5.1. Market size and forecast, by Product Type
- 6.4.4.5.2. Market size and forecast, by Application
- 6.5. Latin America
- 6.5.1. Key market trends, growth factors and opportunities
- 6.5.2. Market size and forecast, by Product Type
- 6.5.3. Market size and forecast, by Application
- 6.5.4. Market size and forecast, by country
- 6.5.4.1. Bolivia
- 6.5.4.1.1. Market size and forecast, by Product Type
- 6.5.4.1.2. Market size and forecast, by Application
- 6.5.4.2. Argentina
- 6.5.4.2.1. Market size and forecast, by Product Type
- 6.5.4.2.2. Market size and forecast, by Application
- 6.5.4.3. Rest of Latin America
- 6.5.4.3.1. Market size and forecast, by Product Type
- 6.5.4.3.2. Market size and forecast, by Application
- 6.6. Middle East and Africa
- 6.6.1. Key market trends, growth factors and opportunities
- 6.6.2. Market size and forecast, by Product Type
- 6.6.3. Market size and forecast, by Application
- 6.6.4. Market size and forecast, by country
- 6.6.4.1. Saudi Arabia
- 6.6.4.1.1. Market size and forecast, by Product Type
- 6.6.4.1.2. Market size and forecast, by Application
- 6.6.4.2. Africa
- 6.6.4.2.1. Market size and forecast, by Product Type
- 6.6.4.2.2. Market size and forecast, by Application
- 6.6.4.3. Rest of Middle East And Africa
- 6.6.4.3.1. Market size and forecast, by Product Type
- 6.6.4.3.2. Market size and forecast, by Application
CHAPTER 7: COMPETITIVE LANDSCAPE
- 7.1. Introduction
- 7.2. Top winning strategies
- 7.3. Product mapping of top 10 player
- 7.4. Competitive dashboard
- 7.5. Competitive heatmap
- 7.6. Top player positioning, 2022
CHAPTER 8: COMPANY PROFILES
- 8.1. JTEKT Corporation
- 8.1.1. Company overview
- 8.1.2. Key executives
- 8.1.3. Company snapshot
- 8.1.4. Operating business segments
- 8.1.5. Product portfolio
- 8.1.6. Business performance
- 8.1.7. Key strategic moves and developments
- 8.2. TAIYO YUDEN CO., LTD.
- 8.2.1. Company overview
- 8.2.2. Key executives
- 8.2.3. Company snapshot
- 8.2.4. Operating business segments
- 8.2.5. Product portfolio
- 8.2.6. Business performance
- 8.2.7. Key strategic moves and developments
- 8.3. Vishay Intertechnology, Inc.
- 8.3.1. Company overview
- 8.3.2. Key executives
- 8.3.3. Company snapshot
- 8.3.4. Operating business segments
- 8.3.5. Product portfolio
- 8.3.6. Business performance
- 8.3.7. Key strategic moves and developments
- 8.4. LICAP Technologies, Inc.
- 8.4.1. Company overview
- 8.4.2. Key executives
- 8.4.3. Company snapshot
- 8.4.4. Operating business segments
- 8.4.5. Product portfolio
- 8.4.6. Business performance
- 8.4.7. Key strategic moves and developments
- 8.5. SOCOMEC GROUP
- 8.5.1. Company overview
- 8.5.2. Key executives
- 8.5.3. Company snapshot
- 8.5.4. Operating business segments
- 8.5.5. Product portfolio
- 8.5.6. Business performance
- 8.5.7. Key strategic moves and developments
- 8.6. EVE Energy Co., Ltd.
- 8.6.1. Company overview
- 8.6.2. Key executives
- 8.6.3. Company snapshot
- 8.6.4. Operating business segments
- 8.6.5. Product portfolio
- 8.6.6. Business performance
- 8.6.7. Key strategic moves and developments
- 8.7. SPEL TECHNOLOGIES PRIVATE LTD.
- 8.7.1. Company overview
- 8.7.2. Key executives
- 8.7.3. Company snapshot
- 8.7.4. Operating business segments
- 8.7.5. Product portfolio
- 8.7.6. Business performance
- 8.7.7. Key strategic moves and developments
- 8.8. Electro Standards Laboratories
- 8.8.1. Company overview
- 8.8.2. Key executives
- 8.8.3. Company snapshot
- 8.8.4. Operating business segments
- 8.8.5. Product portfolio
- 8.8.6. Business performance
- 8.8.7. Key strategic moves and developments
- 8.9. Yunasko
- 8.9.1. Company overview
- 8.9.2. Key executives
- 8.9.3. Company snapshot
- 8.9.4. Operating business segments
- 8.9.5. Product portfolio
- 8.9.6. Business performance
- 8.9.7. Key strategic moves and developments
- 8.10. KEMET Corporation
- 8.10.1. Company overview
- 8.10.2. Key executives
- 8.10.3. Company snapshot
- 8.10.4. Operating business segments
- 8.10.5. Product portfolio
- 8.10.6. Business performance
- 8.10.7. Key strategic moves and developments
