
|
市場調査レポート
商品コード
1446430
犯罪保険市場:補償内容別、エンドユーザー別:世界の機会分析と産業予測、2023年~2032年Crime Insurance Market By Coverage (Fraud Cover, Forgery Cover, Theft Cover, Kidnapping Cover, Others), By End User (Individuals, Business): Global Opportunity Analysis and Industry Forecast, 2023-2032 |
||||||
|
|||||||

| 犯罪保険市場:補償内容別、エンドユーザー別:世界の機会分析と産業予測、2023年~2032年 |
|
出版日: 2024年01月30日
発行: Allied Market Research
ページ情報: 英文 400 Pages
納期: 2~3営業日
|

- 全表示
- 概要
- 図表
- 目次
重要な企業は、犯罪保険業界で生き残り、競争するために様々な商品を発売しています。
例えば、2022年9月、InsurTech Counterpartは中小企業向けの犯罪商品を発売しました。この新商品は、カウンターパートが独自に開発したMLベースの引受システムを活用することで、従業員の窃盗やソーシャル・エンジニアリングによる危険の特定を支援するもので、積極的なリスク軽減ガイドラインを含む従業員の感情分析も含まれています。さらにEmborker社は、2021年9月にサイバー保険と商業犯罪保険という新しいデジタル保険ソリューションを発表しました。サイバー保険は、データ漏洩やサイバー脅威の結果、第一および第三者が被る金銭的損害を補償するものです。また、犯罪保険は、従業員や外部組織による犯罪に関連した問題による損害賠償請求や損失を補償するものです。さらに、2020年10月、ビットスタンプは、ウッドラフ・ソーヤのサポートのもと、専門保険ブローカーであるパラゴン・インターナショナル・インシュアランス・ブローカーズを通じて、新たな犯罪保険補償保険を提供しました。この保険は、従業員の窃盗、輸送中の資産保管、コンピューター詐欺による損失、資金移動に関する詐欺、弁護士費用に関する損失など、犯罪に関連するさまざまなケースをカバーしています。さらに2023年2月、コーポレーションはチューリッヒ・インシュアランス・グループと提携し、犯罪および受託者責任保険に関連する新たな提案を開始しました。この新しいソリューションは、不必要な受託者責任賠償請求につながる可能性のある、給付制度の過失や誤った管理に取り組むものです。さらに、このソリューションは、過大な手数料の補償、設定者の補償、対象となる民事罰の数々など、顧客が従業員給付制度に関連するリスクを管理するのに役立ちます。この戦略は、犯罪保険市場における両社の地位強化に役立つと期待されます。したがって、主要企業が採用するこのような戦略は、予測期間中の犯罪保険市場の成長を促進すると予想されます。
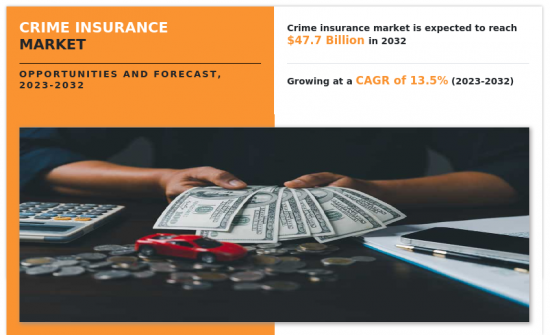
テクノロジーの進歩と世界化の進展は、犯罪保険市場の成長を促進する2つの主な要因です。さらに、請求プロセスの複雑化と政策規制の進化が、犯罪保険市場の成長を妨げる2つの主要な抑制要因となっています。さらに、サイバー保険に対する需要の高まりは、犯罪保険市場の成長に大きな機会を提供しています。
犯罪保険市場は、補償範囲、エンドユーザー、地域に区分されます。補償範囲ベースでは、市場は詐欺カバー、偽造カバー、盗難カバー、誘拐カバー、その他に分類されます。エンドユーザー別では、市場は個人と企業に二分されます。地域別では、犯罪保険市場は北米、欧州、アジア太平洋、ラテンアメリカ、中東・アフリカで調査されています。
利害関係者にとっての主なメリット
- 当レポートでは、2022年から2032年までの犯罪保険市場分析の市場セグメント、現在の動向、推定・動向分析、ダイナミクスを定量的に分析し、犯罪保険市場の実勢機会を明らかにします。
- 市場促進要因、市場抑制要因、市場機会に関連する情報とともに市場調査を提供します。
- ポーターのファイブフォース分析では、利害関係者が利益重視のビジネス決定を下し、サプライヤーとバイヤーのネットワークを強化できるよう、バイヤーとサプライヤーの潜在力を明らかにします。
- 犯罪保険市場のセグメンテーションを詳細に分析することで、市場機会を見極めることができます。
- 各地域の主要国を世界市場への収益貢献度に応じてマッピングしています。
- 市場プレイヤーのポジショニングはベンチマーキングを容易にし、市場プレイヤーの現在のポジションを明確に理解することができます。
- 本レポートには、地域別および世界の犯罪保険市場動向、主要企業、市場セグメント、応用分野、市場成長戦略の分析が含まれています。
本レポートのカスタマイズが可能です(別途費用と期間がかかりますので、詳細は営業担当者にお問い合わせください)。
- 投資機会
- 製品/セグメント別のプレイヤーの市場シェア分析
- 主要プレイヤーの新製品開発/製品マトリックス
- 主要企業の詳細(所在地、連絡先、サプライヤー/ベンダーネットワークなどを含む、エクセル形式)
- 世界/地域/国別レベルでの企業の市場シェア分析
目次
第1章 イントロダクション
第2章 エグゼクティブサマリー
第3章 市場概要
- 市場の定義と範囲
- 主な調査結果
- 影響要因
- 主な投資機会
- ポーターのファイブフォース分析
- 市場力学
- 促進要因
- 抑制要因
- 機会
第4章 犯罪保険市場:補償内容別
- 概要
- 詐欺保険
- 偽造保険
- 盗難保険
- 誘拐保険
- その他
第5章 犯罪保険市場:エンドユーザー別
- 概要
- 個人
- ビジネス
第6章 犯罪保険市場:地域別
- 概要
- 北米
- 米国
- カナダ
- 欧州
- 英国
- ドイツ
- フランス
- イタリア
- スペイン
- その他
- アジア太平洋
- 中国
- 日本
- インド
- オーストラリア
- 韓国
- その他
- ラテンアメリカ
- ブラジル
- アルゼンチン
- その他ラテンアメリカ
- 中東・アフリカ
- Gcc諸国
- 南アフリカ
- その他の中東・アフリカ
第7章 競合情勢
- イントロダクション
- 主要成功戦略
- 主要10社の製品マッピング
- 競合ダッシュボード
- 競合ヒートマップ
- 主要企業のポジショニング、2022年
第8章 企業プロファイル
- JS Downey Insurance Service
- Nationwide Mutual Insurance Company
- Chubb
- Morris & Reynolds Insurance
- American International Group, Inc.
- HDFC ERGO General Insurance Company Ltd.
- Allianz SE
- The Guarantee Company of North America
- The Travellers Companies, Inc.
- Aon plc.
LIST OF TABLES
- TABLE 01. GLOBAL CRIME INSURANCE MARKET, BY COVERAGE, 2022-2032 ($MILLION)
- TABLE 02. CRIME INSURANCE MARKET FOR FRAUD COVER, BY REGION, 2022-2032 ($MILLION)
- TABLE 03. CRIME INSURANCE MARKET FOR FORGERY COVER, BY REGION, 2022-2032 ($MILLION)
- TABLE 04. CRIME INSURANCE MARKET FOR THEFT COVER, BY REGION, 2022-2032 ($MILLION)
- TABLE 05. CRIME INSURANCE MARKET FOR KIDNAPPING COVER, BY REGION, 2022-2032 ($MILLION)
- TABLE 06. CRIME INSURANCE MARKET FOR OTHERS, BY REGION, 2022-2032 ($MILLION)
- TABLE 07. GLOBAL CRIME INSURANCE MARKET, BY END USER, 2022-2032 ($MILLION)
- TABLE 08. CRIME INSURANCE MARKET FOR INDIVIDUALS, BY REGION, 2022-2032 ($MILLION)
- TABLE 09. CRIME INSURANCE MARKET FOR BUSINESS, BY REGION, 2022-2032 ($MILLION)
- TABLE 10. CRIME INSURANCE MARKET, BY REGION, 2022-2032 ($MILLION)
- TABLE 11. NORTH AMERICA CRIME INSURANCE MARKET, BY COVERAGE, 2022-2032 ($MILLION)
- TABLE 12. NORTH AMERICA CRIME INSURANCE MARKET, BY END USER, 2022-2032 ($MILLION)
- TABLE 13. NORTH AMERICA CRIME INSURANCE MARKET, BY COUNTRY, 2022-2032 ($MILLION)
- TABLE 14. U.S. CRIME INSURANCE MARKET, BY COVERAGE, 2022-2032 ($MILLION)
- TABLE 15. U.S. CRIME INSURANCE MARKET, BY END USER, 2022-2032 ($MILLION)
- TABLE 16. CANADA CRIME INSURANCE MARKET, BY COVERAGE, 2022-2032 ($MILLION)
- TABLE 17. CANADA CRIME INSURANCE MARKET, BY END USER, 2022-2032 ($MILLION)
- TABLE 18. EUROPE CRIME INSURANCE MARKET, BY COVERAGE, 2022-2032 ($MILLION)
- TABLE 19. EUROPE CRIME INSURANCE MARKET, BY END USER, 2022-2032 ($MILLION)
- TABLE 20. EUROPE CRIME INSURANCE MARKET, BY COUNTRY, 2022-2032 ($MILLION)
- TABLE 21. UK CRIME INSURANCE MARKET, BY COVERAGE, 2022-2032 ($MILLION)
- TABLE 22. UK CRIME INSURANCE MARKET, BY END USER, 2022-2032 ($MILLION)
- TABLE 23. GERMANY CRIME INSURANCE MARKET, BY COVERAGE, 2022-2032 ($MILLION)
- TABLE 24. GERMANY CRIME INSURANCE MARKET, BY END USER, 2022-2032 ($MILLION)
- TABLE 25. FRANCE CRIME INSURANCE MARKET, BY COVERAGE, 2022-2032 ($MILLION)
- TABLE 26. FRANCE CRIME INSURANCE MARKET, BY END USER, 2022-2032 ($MILLION)
- TABLE 27. ITALY CRIME INSURANCE MARKET, BY COVERAGE, 2022-2032 ($MILLION)
- TABLE 28. ITALY CRIME INSURANCE MARKET, BY END USER, 2022-2032 ($MILLION)
- TABLE 29. SPAIN CRIME INSURANCE MARKET, BY COVERAGE, 2022-2032 ($MILLION)
- TABLE 30. SPAIN CRIME INSURANCE MARKET, BY END USER, 2022-2032 ($MILLION)
- TABLE 31. REST OF EUROPE CRIME INSURANCE MARKET, BY COVERAGE, 2022-2032 ($MILLION)
- TABLE 32. REST OF EUROPE CRIME INSURANCE MARKET, BY END USER, 2022-2032 ($MILLION)
- TABLE 33. ASIA-PACIFIC CRIME INSURANCE MARKET, BY COVERAGE, 2022-2032 ($MILLION)
- TABLE 34. ASIA-PACIFIC CRIME INSURANCE MARKET, BY END USER, 2022-2032 ($MILLION)
- TABLE 35. ASIA-PACIFIC CRIME INSURANCE MARKET, BY COUNTRY, 2022-2032 ($MILLION)
- TABLE 36. CHINA CRIME INSURANCE MARKET, BY COVERAGE, 2022-2032 ($MILLION)
- TABLE 37. CHINA CRIME INSURANCE MARKET, BY END USER, 2022-2032 ($MILLION)
- TABLE 38. JAPAN CRIME INSURANCE MARKET, BY COVERAGE, 2022-2032 ($MILLION)
- TABLE 39. JAPAN CRIME INSURANCE MARKET, BY END USER, 2022-2032 ($MILLION)
- TABLE 40. INDIA CRIME INSURANCE MARKET, BY COVERAGE, 2022-2032 ($MILLION)
- TABLE 41. INDIA CRIME INSURANCE MARKET, BY END USER, 2022-2032 ($MILLION)
- TABLE 42. AUSTRALIA CRIME INSURANCE MARKET, BY COVERAGE, 2022-2032 ($MILLION)
- TABLE 43. AUSTRALIA CRIME INSURANCE MARKET, BY END USER, 2022-2032 ($MILLION)
- TABLE 44. SOUTH KOREA CRIME INSURANCE MARKET, BY COVERAGE, 2022-2032 ($MILLION)
- TABLE 45. SOUTH KOREA CRIME INSURANCE MARKET, BY END USER, 2022-2032 ($MILLION)
- TABLE 46. REST OF ASIA-PACIFIC CRIME INSURANCE MARKET, BY COVERAGE, 2022-2032 ($MILLION)
- TABLE 47. REST OF ASIA-PACIFIC CRIME INSURANCE MARKET, BY END USER, 2022-2032 ($MILLION)
- TABLE 48. LATIN AMERICA CRIME INSURANCE MARKET, BY COVERAGE, 2022-2032 ($MILLION)
- TABLE 49. LATIN AMERICA CRIME INSURANCE MARKET, BY END USER, 2022-2032 ($MILLION)
- TABLE 50. LATIN AMERICA CRIME INSURANCE MARKET, BY COUNTRY, 2022-2032 ($MILLION)
- TABLE 51. BRAZIL CRIME INSURANCE MARKET, BY COVERAGE, 2022-2032 ($MILLION)
- TABLE 52. BRAZIL CRIME INSURANCE MARKET, BY END USER, 2022-2032 ($MILLION)
- TABLE 53. ARGENTINA CRIME INSURANCE MARKET, BY COVERAGE, 2022-2032 ($MILLION)
- TABLE 54. ARGENTINA CRIME INSURANCE MARKET, BY END USER, 2022-2032 ($MILLION)
- TABLE 55. REST OF LATIN AMERICA CRIME INSURANCE MARKET, BY COVERAGE, 2022-2032 ($MILLION)
- TABLE 56. REST OF LATIN AMERICA CRIME INSURANCE MARKET, BY END USER, 2022-2032 ($MILLION)
- TABLE 57. MIDDLE EAST AND AFRICA CRIME INSURANCE MARKET, BY COVERAGE, 2022-2032 ($MILLION)
- TABLE 58. MIDDLE EAST AND AFRICA CRIME INSURANCE MARKET, BY END USER, 2022-2032 ($MILLION)
- TABLE 59. MIDDLE EAST AND AFRICA CRIME INSURANCE MARKET, BY COUNTRY, 2022-2032 ($MILLION)
- TABLE 60. GCC COUNTRIES CRIME INSURANCE MARKET, BY COVERAGE, 2022-2032 ($MILLION)
- TABLE 61. GCC COUNTRIES CRIME INSURANCE MARKET, BY END USER, 2022-2032 ($MILLION)
- TABLE 62. SOUTH AFRICA CRIME INSURANCE MARKET, BY COVERAGE, 2022-2032 ($MILLION)
- TABLE 63. SOUTH AFRICA CRIME INSURANCE MARKET, BY END USER, 2022-2032 ($MILLION)
- TABLE 64. REST OF MIDDLE EAST AND AFRICA CRIME INSURANCE MARKET, BY COVERAGE, 2022-2032 ($MILLION)
- TABLE 65. REST OF MIDDLE EAST AND AFRICA CRIME INSURANCE MARKET, BY END USER, 2022-2032 ($MILLION)
- TABLE 66. JS DOWNEY INSURANCE SERVICE: KEY EXECUTIVES
- TABLE 67. JS DOWNEY INSURANCE SERVICE: COMPANY SNAPSHOT
- TABLE 68. JS DOWNEY INSURANCE SERVICE: PRODUCT SEGMENTS
- TABLE 69. JS DOWNEY INSURANCE SERVICE: SERVICE SEGMENTS
- TABLE 70. JS DOWNEY INSURANCE SERVICE: PRODUCT PORTFOLIO
- TABLE 71. JS DOWNEY INSURANCE SERVICE: KEY STRATERGIES
- TABLE 72. NATIONWIDE MUTUAL INSURANCE COMPANY: KEY EXECUTIVES
- TABLE 73. NATIONWIDE MUTUAL INSURANCE COMPANY: COMPANY SNAPSHOT
- TABLE 74. NATIONWIDE MUTUAL INSURANCE COMPANY: PRODUCT SEGMENTS
- TABLE 75. NATIONWIDE MUTUAL INSURANCE COMPANY: SERVICE SEGMENTS
- TABLE 76. NATIONWIDE MUTUAL INSURANCE COMPANY: PRODUCT PORTFOLIO
- TABLE 77. NATIONWIDE MUTUAL INSURANCE COMPANY: KEY STRATERGIES
- TABLE 78. CHUBB: KEY EXECUTIVES
- TABLE 79. CHUBB: COMPANY SNAPSHOT
- TABLE 80. CHUBB: PRODUCT SEGMENTS
- TABLE 81. CHUBB: SERVICE SEGMENTS
- TABLE 82. CHUBB: PRODUCT PORTFOLIO
- TABLE 83. CHUBB: KEY STRATERGIES
- TABLE 84. MORRIS & REYNOLDS INSURANCE: KEY EXECUTIVES
- TABLE 85. MORRIS & REYNOLDS INSURANCE: COMPANY SNAPSHOT
- TABLE 86. MORRIS & REYNOLDS INSURANCE: PRODUCT SEGMENTS
- TABLE 87. MORRIS & REYNOLDS INSURANCE: SERVICE SEGMENTS
- TABLE 88. MORRIS & REYNOLDS INSURANCE: PRODUCT PORTFOLIO
- TABLE 89. MORRIS & REYNOLDS INSURANCE: KEY STRATERGIES
- TABLE 90. AMERICAN INTERNATIONAL GROUP, INC.: KEY EXECUTIVES
- TABLE 91. AMERICAN INTERNATIONAL GROUP, INC.: COMPANY SNAPSHOT
- TABLE 92. AMERICAN INTERNATIONAL GROUP, INC.: PRODUCT SEGMENTS
- TABLE 93. AMERICAN INTERNATIONAL GROUP, INC.: SERVICE SEGMENTS
- TABLE 94. AMERICAN INTERNATIONAL GROUP, INC.: PRODUCT PORTFOLIO
- TABLE 95. AMERICAN INTERNATIONAL GROUP, INC.: KEY STRATERGIES
- TABLE 96. HDFC ERGO GENERAL INSURANCE COMPANY LTD.: KEY EXECUTIVES
- TABLE 97. HDFC ERGO GENERAL INSURANCE COMPANY LTD.: COMPANY SNAPSHOT
- TABLE 98. HDFC ERGO GENERAL INSURANCE COMPANY LTD.: PRODUCT SEGMENTS
- TABLE 99. HDFC ERGO GENERAL INSURANCE COMPANY LTD.: SERVICE SEGMENTS
- TABLE 100. HDFC ERGO GENERAL INSURANCE COMPANY LTD.: PRODUCT PORTFOLIO
- TABLE 101. HDFC ERGO GENERAL INSURANCE COMPANY LTD.: KEY STRATERGIES
- TABLE 102. ALLIANZ SE: KEY EXECUTIVES
- TABLE 103. ALLIANZ SE: COMPANY SNAPSHOT
- TABLE 104. ALLIANZ SE: PRODUCT SEGMENTS
- TABLE 105. ALLIANZ SE: SERVICE SEGMENTS
- TABLE 106. ALLIANZ SE: PRODUCT PORTFOLIO
- TABLE 107. ALLIANZ SE: KEY STRATERGIES
- TABLE 108. THE GUARANTEE COMPANY OF NORTH AMERICA: KEY EXECUTIVES
- TABLE 109. THE GUARANTEE COMPANY OF NORTH AMERICA: COMPANY SNAPSHOT
- TABLE 110. THE GUARANTEE COMPANY OF NORTH AMERICA: PRODUCT SEGMENTS
- TABLE 111. THE GUARANTEE COMPANY OF NORTH AMERICA: SERVICE SEGMENTS
- TABLE 112. THE GUARANTEE COMPANY OF NORTH AMERICA: PRODUCT PORTFOLIO
- TABLE 113. THE GUARANTEE COMPANY OF NORTH AMERICA: KEY STRATERGIES
- TABLE 114. THE TRAVELLERS COMPANIES, INC.: KEY EXECUTIVES
- TABLE 115. THE TRAVELLERS COMPANIES, INC.: COMPANY SNAPSHOT
- TABLE 116. THE TRAVELLERS COMPANIES, INC.: PRODUCT SEGMENTS
- TABLE 117. THE TRAVELLERS COMPANIES, INC.: SERVICE SEGMENTS
- TABLE 118. THE TRAVELLERS COMPANIES, INC.: PRODUCT PORTFOLIO
- TABLE 119. THE TRAVELLERS COMPANIES, INC.: KEY STRATERGIES
- TABLE 120. AON PLC.: KEY EXECUTIVES
- TABLE 121. AON PLC.: COMPANY SNAPSHOT
- TABLE 122. AON PLC.: PRODUCT SEGMENTS
- TABLE 123. AON PLC.: SERVICE SEGMENTS
- TABLE 124. AON PLC.: PRODUCT PORTFOLIO
- TABLE 125. AON PLC.: KEY STRATERGIES
LIST OF FIGURES
- FIGURE 01. CRIME INSURANCE MARKET, 2022-2032
- FIGURE 02. SEGMENTATION OF CRIME INSURANCE MARKET,2022-2032
- FIGURE 03. TOP IMPACTING FACTORS IN CRIME INSURANCE MARKET
- FIGURE 04. TOP INVESTMENT POCKETS IN CRIME INSURANCE MARKET (2023-2032)
- FIGURE 05. BARGAINING POWER OF SUPPLIERS
- FIGURE 06. BARGAINING POWER OF BUYERS
- FIGURE 07. THREAT OF SUBSTITUTION
- FIGURE 08. THREAT OF SUBSTITUTION
- FIGURE 09. COMPETITIVE RIVALRY
- FIGURE 10. GLOBAL CRIME INSURANCE MARKET:DRIVERS, RESTRAINTS AND OPPORTUNITIES
- FIGURE 11. CRIME INSURANCE MARKET, BY COVERAGE, 2022 AND 2032(%)
- FIGURE 12. COMPARATIVE SHARE ANALYSIS OF CRIME INSURANCE MARKET FOR FRAUD COVER, BY COUNTRY 2022 AND 2032(%)
- FIGURE 13. COMPARATIVE SHARE ANALYSIS OF CRIME INSURANCE MARKET FOR FORGERY COVER, BY COUNTRY 2022 AND 2032(%)
- FIGURE 14. COMPARATIVE SHARE ANALYSIS OF CRIME INSURANCE MARKET FOR THEFT COVER, BY COUNTRY 2022 AND 2032(%)
- FIGURE 15. COMPARATIVE SHARE ANALYSIS OF CRIME INSURANCE MARKET FOR KIDNAPPING COVER, BY COUNTRY 2022 AND 2032(%)
- FIGURE 16. COMPARATIVE SHARE ANALYSIS OF CRIME INSURANCE MARKET FOR OTHERS, BY COUNTRY 2022 AND 2032(%)
- FIGURE 17. CRIME INSURANCE MARKET, BY END USER, 2022 AND 2032(%)
- FIGURE 18. COMPARATIVE SHARE ANALYSIS OF CRIME INSURANCE MARKET FOR INDIVIDUALS, BY COUNTRY 2022 AND 2032(%)
- FIGURE 19. COMPARATIVE SHARE ANALYSIS OF CRIME INSURANCE MARKET FOR BUSINESS, BY COUNTRY 2022 AND 2032(%)
- FIGURE 20. CRIME INSURANCE MARKET BY REGION, 2022 AND 2032(%)
- FIGURE 21. U.S. CRIME INSURANCE MARKET, 2022-2032 ($MILLION)
- FIGURE 22. CANADA CRIME INSURANCE MARKET, 2022-2032 ($MILLION)
- FIGURE 23. UK CRIME INSURANCE MARKET, 2022-2032 ($MILLION)
- FIGURE 24. GERMANY CRIME INSURANCE MARKET, 2022-2032 ($MILLION)
- FIGURE 25. FRANCE CRIME INSURANCE MARKET, 2022-2032 ($MILLION)
- FIGURE 26. ITALY CRIME INSURANCE MARKET, 2022-2032 ($MILLION)
- FIGURE 27. SPAIN CRIME INSURANCE MARKET, 2022-2032 ($MILLION)
- FIGURE 28. REST OF EUROPE CRIME INSURANCE MARKET, 2022-2032 ($MILLION)
- FIGURE 29. CHINA CRIME INSURANCE MARKET, 2022-2032 ($MILLION)
- FIGURE 30. JAPAN CRIME INSURANCE MARKET, 2022-2032 ($MILLION)
- FIGURE 31. INDIA CRIME INSURANCE MARKET, 2022-2032 ($MILLION)
- FIGURE 32. AUSTRALIA CRIME INSURANCE MARKET, 2022-2032 ($MILLION)
- FIGURE 33. SOUTH KOREA CRIME INSURANCE MARKET, 2022-2032 ($MILLION)
- FIGURE 34. REST OF ASIA-PACIFIC CRIME INSURANCE MARKET, 2022-2032 ($MILLION)
- FIGURE 35. BRAZIL CRIME INSURANCE MARKET, 2022-2032 ($MILLION)
- FIGURE 36. ARGENTINA CRIME INSURANCE MARKET, 2022-2032 ($MILLION)
- FIGURE 37. REST OF LATIN AMERICA CRIME INSURANCE MARKET, 2022-2032 ($MILLION)
- FIGURE 38. GCC COUNTRIES CRIME INSURANCE MARKET, 2022-2032 ($MILLION)
- FIGURE 39. SOUTH AFRICA CRIME INSURANCE MARKET, 2022-2032 ($MILLION)
- FIGURE 40. REST OF MIDDLE EAST AND AFRICA CRIME INSURANCE MARKET, 2022-2032 ($MILLION)
- FIGURE 41. TOP WINNING STRATEGIES, BY YEAR
- FIGURE 42. TOP WINNING STRATEGIES, BY DEVELOPMENT
- FIGURE 43. TOP WINNING STRATEGIES, BY COMPANY
- FIGURE 44. PRODUCT MAPPING OF TOP 10 PLAYERS
- FIGURE 45. COMPETITIVE DASHBOARD
- FIGURE 46. COMPETITIVE HEATMAP: CRIME INSURANCE MARKET
- FIGURE 47. TOP PLAYER POSITIONING, 2022
Important players have launched various products to survive and compete in the crime insurance industry. For instance, in September 2022, InsurTech Counterpart launched a crime product for small and medium scale businesses. The new offering helps in identifying employee theft, and social engineering perils by utilizing proprietary ML based underwriting system of Counterpart that includes employee sentiment analysis including proactive risk mitigation guidelines. Furthermore, Emborker company released new digital insurance solutions namely cyber insurance and commercial crime insurance in September 2021. Cyber insurance comprises of first and third party financial damages as a result of data breach and cyber threats. In addition, crime insurance products offer claims and losses due to crime-related issues committed by both employees and outside entities. Moreover, in October 2020, Bitstamp offered the new crime insurance coverage policy through specialist insurance brokers, Paragon International Insurance Brokers with support from Woodruff Sawyer. The policy covers a range of crime-related cases including employee theft, asset storage during transit, loss due to computer fraud, fraud related to fund transfer, and loss related to legal fees and expenses. In addition, in February 2023, Coalition collaborated with Zurich Insurance Group and launched new offerings related to crime and fiduciary liability insurance. The new solution tackles negligence and mismanagement of benefit plans, that might lead to unnecessary fiduciary liability claims. In addition, the solution helps the client to manage risk related to their employee benefit plan including excessive fee coverage, settlor coverage, and an array of covered civil penalties. This strategy is expected to help both the companies to strengthen their position in the crime insurance market. Therefore, such strategies adopted by key players are expected to propel the growth of the crime insurance market for the forecast period.
Growing advancements in technology and increase in globalization are two main significant factors that drive the growth of the crime insurance market. Furthermore, rise in complexities of claimed process and surge in evolution of regulation of policy are two main significant restraints hampering the growth of the crime insurance market. Moreover, growth in demand for cyber insurance has provided a significant opportunity for the crime insurance market growth.
The crime insurance market is segmented into coverage, end user, and region. On the basis of coverage, the market is categorized into fraud cover, forgery cover, theft cover, kidnapping cover, and others. On the basis of end user, the market is bifurcated into individuals and business. On the basis of region, the crime insurance market is studied across North America, Europe, Asia-Pacific, Latin America, Middle East and Africa.
The key players in the crime insurance market include JS Downey Insurance Service, Nationwide Mutual Insurance Company, Chubb, Morris & Reynolds Insurance, American International Group, Inc., HDFC ERGO General Insurance Company Limited, Allianz SE, The Guarantee Company of North America, The Travelers Companies, Inc. These players have adopted numerous strategies to increase their marketplace penetration and strengthen their position in the crime insurance market.
Key Benefits For Stakeholders
- This report provides a quantitative analysis of the market segments, current trends, estimations, and dynamics of the crime insurance market analysis from 2022 to 2032 to identify the prevailing crime insurance market opportunities.
- The market research is offered along with information related to key drivers, restraints, and opportunities.
- Porter's five forces analysis highlights the potency of buyers and suppliers to enable stakeholders make profit-oriented business decisions and strengthen their supplier-buyer network.
- In-depth analysis of the crime insurance market segmentation assists to determine the prevailing market opportunities.
- Major countries in each region are mapped according to their revenue contribution to the global market.
- Market player positioning facilitates benchmarking and provides a clear understanding of the present position of the market players.
- The report includes the analysis of the regional as well as global crime insurance market trends, key players, market segments, application areas, and market growth strategies.
Additional benefits you will get with this purchase are:
- Quarterly Update and* (only available with a corporate license, on listed price)
- 5 additional Company Profile of client Choice pre- or Post-purchase, as a free update.
- Free Upcoming Version on the Purchase of Five and Enterprise User License.
- 16 analyst hours of support* (post-purchase, if you find additional data requirements upon review of the report, you may receive support amounting to 16 analyst hours to solve questions, and post-sale queries)
- 15% Free Customization* (in case the scope or segment of the report does not match your requirements, 15% is equivalent to 3 working days of free work, applicable once)
- Free data Pack on the Five and Enterprise User License. (Excel version of the report)
- Free Updated report if the report is 6-12 months old or older.
- 24-hour priority response*
- Free Industry updates and white papers.
Possible Customization with this report (with additional cost and timeline, please talk to the sales executive to know more)
- Investment Opportunities
- Market share analysis of players by products/segments
- New Product Development/ Product Matrix of Key Players
- Key player details (including location, contact details, supplier/vendor network etc. in excel format)
- Market share analysis of players at global/region/country level
Key Market Segments
By Coverage
- Fraud Cover
- Forgery Cover
- Theft Cover
- Kidnapping Cover
- Others
By End User
- Individuals
- Business
By Region
- North America
- U.S.
- Canada
- Europe
- UK
- Germany
- France
- Italy
- Spain
- Rest of Europe
- Asia-Pacific
- China
- Japan
- India
- Australia
- South Korea
- Rest of Asia-Pacific
- Latin America
- Brazil
- Argentina
- Rest of Latin America
- Middle East and Africa
- Gcc Countries
- South Africa
- Rest of Middle East And Africa
Key Market Players:
- JS Downey Insurance Service
- Nationwide Mutual Insurance Company
- Chubb
- Morris & Reynolds Insurance
- American International Group, Inc.
- HDFC ERGO General Insurance Company Ltd.
- Allianz SE
- The Guarantee Company of North America
- The Travellers Companies, Inc.
- Aon plc.
TABLE OF CONTENTS
CHAPTER 1: INTRODUCTION
- 1.1. Report description
- 1.2. Key market segments
- 1.3. Key benefits to the stakeholders
- 1.4. Research methodology
- 1.4.1. Primary research
- 1.4.2. Secondary research
- 1.4.3. Analyst tools and models
CHAPTER 2: EXECUTIVE SUMMARY
- 2.1. CXO Perspective
CHAPTER 3: MARKET OVERVIEW
- 3.1. Market definition and scope
- 3.2. Key findings
- 3.2.1. Top impacting factors
- 3.2.2. Top investment pockets
- 3.3. Porter's five forces analysis
- 3.4. Market dynamics
- 3.4.1. Drivers
- 3.4.2. Restraints
- 3.4.3. Opportunities
CHAPTER 4: CRIME INSURANCE MARKET, BY COVERAGE
- 4.1. Overview
- 4.1.1. Market size and forecast
- 4.2. Fraud Cover
- 4.2.1. Key market trends, growth factors and opportunities
- 4.2.2. Market size and forecast, by region
- 4.2.3. Market share analysis by country
- 4.3. Forgery Cover
- 4.3.1. Key market trends, growth factors and opportunities
- 4.3.2. Market size and forecast, by region
- 4.3.3. Market share analysis by country
- 4.4. Theft Cover
- 4.4.1. Key market trends, growth factors and opportunities
- 4.4.2. Market size and forecast, by region
- 4.4.3. Market share analysis by country
- 4.5. Kidnapping Cover
- 4.5.1. Key market trends, growth factors and opportunities
- 4.5.2. Market size and forecast, by region
- 4.5.3. Market share analysis by country
- 4.6. Others
- 4.6.1. Key market trends, growth factors and opportunities
- 4.6.2. Market size and forecast, by region
- 4.6.3. Market share analysis by country
CHAPTER 5: CRIME INSURANCE MARKET, BY END USER
- 5.1. Overview
- 5.1.1. Market size and forecast
- 5.2. Individuals
- 5.2.1. Key market trends, growth factors and opportunities
- 5.2.2. Market size and forecast, by region
- 5.2.3. Market share analysis by country
- 5.3. Business
- 5.3.1. Key market trends, growth factors and opportunities
- 5.3.2. Market size and forecast, by region
- 5.3.3. Market share analysis by country
CHAPTER 6: CRIME INSURANCE MARKET, BY REGION
- 6.1. Overview
- 6.1.1. Market size and forecast By Region
- 6.2. North America
- 6.2.1. Key market trends, growth factors and opportunities
- 6.2.2. Market size and forecast, by Coverage
- 6.2.3. Market size and forecast, by End User
- 6.2.4. Market size and forecast, by country
- 6.2.4.1. U.S.
- 6.2.4.1.1. Market size and forecast, by Coverage
- 6.2.4.1.2. Market size and forecast, by End User
- 6.2.4.2. Canada
- 6.2.4.2.1. Market size and forecast, by Coverage
- 6.2.4.2.2. Market size and forecast, by End User
- 6.3. Europe
- 6.3.1. Key market trends, growth factors and opportunities
- 6.3.2. Market size and forecast, by Coverage
- 6.3.3. Market size and forecast, by End User
- 6.3.4. Market size and forecast, by country
- 6.3.4.1. UK
- 6.3.4.1.1. Market size and forecast, by Coverage
- 6.3.4.1.2. Market size and forecast, by End User
- 6.3.4.2. Germany
- 6.3.4.2.1. Market size and forecast, by Coverage
- 6.3.4.2.2. Market size and forecast, by End User
- 6.3.4.3. France
- 6.3.4.3.1. Market size and forecast, by Coverage
- 6.3.4.3.2. Market size and forecast, by End User
- 6.3.4.4. Italy
- 6.3.4.4.1. Market size and forecast, by Coverage
- 6.3.4.4.2. Market size and forecast, by End User
- 6.3.4.5. Spain
- 6.3.4.5.1. Market size and forecast, by Coverage
- 6.3.4.5.2. Market size and forecast, by End User
- 6.3.4.6. Rest of Europe
- 6.3.4.6.1. Market size and forecast, by Coverage
- 6.3.4.6.2. Market size and forecast, by End User
- 6.4. Asia-Pacific
- 6.4.1. Key market trends, growth factors and opportunities
- 6.4.2. Market size and forecast, by Coverage
- 6.4.3. Market size and forecast, by End User
- 6.4.4. Market size and forecast, by country
- 6.4.4.1. China
- 6.4.4.1.1. Market size and forecast, by Coverage
- 6.4.4.1.2. Market size and forecast, by End User
- 6.4.4.2. Japan
- 6.4.4.2.1. Market size and forecast, by Coverage
- 6.4.4.2.2. Market size and forecast, by End User
- 6.4.4.3. India
- 6.4.4.3.1. Market size and forecast, by Coverage
- 6.4.4.3.2. Market size and forecast, by End User
- 6.4.4.4. Australia
- 6.4.4.4.1. Market size and forecast, by Coverage
- 6.4.4.4.2. Market size and forecast, by End User
- 6.4.4.5. South Korea
- 6.4.4.5.1. Market size and forecast, by Coverage
- 6.4.4.5.2. Market size and forecast, by End User
- 6.4.4.6. Rest of Asia-Pacific
- 6.4.4.6.1. Market size and forecast, by Coverage
- 6.4.4.6.2. Market size and forecast, by End User
- 6.5. Latin America
- 6.5.1. Key market trends, growth factors and opportunities
- 6.5.2. Market size and forecast, by Coverage
- 6.5.3. Market size and forecast, by End User
- 6.5.4. Market size and forecast, by country
- 6.5.4.1. Brazil
- 6.5.4.1.1. Market size and forecast, by Coverage
- 6.5.4.1.2. Market size and forecast, by End User
- 6.5.4.2. Argentina
- 6.5.4.2.1. Market size and forecast, by Coverage
- 6.5.4.2.2. Market size and forecast, by End User
- 6.5.4.3. Rest of Latin America
- 6.5.4.3.1. Market size and forecast, by Coverage
- 6.5.4.3.2. Market size and forecast, by End User
- 6.6. Middle East and Africa
- 6.6.1. Key market trends, growth factors and opportunities
- 6.6.2. Market size and forecast, by Coverage
- 6.6.3. Market size and forecast, by End User
- 6.6.4. Market size and forecast, by country
- 6.6.4.1. Gcc Countries
- 6.6.4.1.1. Market size and forecast, by Coverage
- 6.6.4.1.2. Market size and forecast, by End User
- 6.6.4.2. South Africa
- 6.6.4.2.1. Market size and forecast, by Coverage
- 6.6.4.2.2. Market size and forecast, by End User
- 6.6.4.3. Rest of Middle East And Africa
- 6.6.4.3.1. Market size and forecast, by Coverage
- 6.6.4.3.2. Market size and forecast, by End User
CHAPTER 7: COMPETITIVE LANDSCAPE
- 7.1. Introduction
- 7.2. Top winning strategies
- 7.3. Product mapping of top 10 player
- 7.4. Competitive dashboard
- 7.5. Competitive heatmap
- 7.6. Top player positioning, 2022
CHAPTER 8: COMPANY PROFILES
- 8.1. JS Downey Insurance Service
- 8.1.1. Company overview
- 8.1.2. Key executives
- 8.1.3. Company snapshot
- 8.1.4. Operating business segments
- 8.1.5. Product portfolio
- 8.1.6. Business performance
- 8.1.7. Key strategic moves and developments
- 8.2. Nationwide Mutual Insurance Company
- 8.2.1. Company overview
- 8.2.2. Key executives
- 8.2.3. Company snapshot
- 8.2.4. Operating business segments
- 8.2.5. Product portfolio
- 8.2.6. Business performance
- 8.2.7. Key strategic moves and developments
- 8.3. Chubb
- 8.3.1. Company overview
- 8.3.2. Key executives
- 8.3.3. Company snapshot
- 8.3.4. Operating business segments
- 8.3.5. Product portfolio
- 8.3.6. Business performance
- 8.3.7. Key strategic moves and developments
- 8.4. Morris & Reynolds Insurance
- 8.4.1. Company overview
- 8.4.2. Key executives
- 8.4.3. Company snapshot
- 8.4.4. Operating business segments
- 8.4.5. Product portfolio
- 8.4.6. Business performance
- 8.4.7. Key strategic moves and developments
- 8.5. American International Group, Inc.
- 8.5.1. Company overview
- 8.5.2. Key executives
- 8.5.3. Company snapshot
- 8.5.4. Operating business segments
- 8.5.5. Product portfolio
- 8.5.6. Business performance
- 8.5.7. Key strategic moves and developments
- 8.6. HDFC ERGO General Insurance Company Ltd.
- 8.6.1. Company overview
- 8.6.2. Key executives
- 8.6.3. Company snapshot
- 8.6.4. Operating business segments
- 8.6.5. Product portfolio
- 8.6.6. Business performance
- 8.6.7. Key strategic moves and developments
- 8.7. Allianz SE
- 8.7.1. Company overview
- 8.7.2. Key executives
- 8.7.3. Company snapshot
- 8.7.4. Operating business segments
- 8.7.5. Product portfolio
- 8.7.6. Business performance
- 8.7.7. Key strategic moves and developments
- 8.8. The Guarantee Company of North America
- 8.8.1. Company overview
- 8.8.2. Key executives
- 8.8.3. Company snapshot
- 8.8.4. Operating business segments
- 8.8.5. Product portfolio
- 8.8.6. Business performance
- 8.8.7. Key strategic moves and developments
- 8.9. The Travellers Companies, Inc.
- 8.9.1. Company overview
- 8.9.2. Key executives
- 8.9.3. Company snapshot
- 8.9.4. Operating business segments
- 8.9.5. Product portfolio
- 8.9.6. Business performance
- 8.9.7. Key strategic moves and developments
- 8.10. Aon plc.
- 8.10.1. Company overview
- 8.10.2. Key executives
- 8.10.3. Company snapshot
- 8.10.4. Operating business segments
- 8.10.5. Product portfolio
- 8.10.6. Business performance
- 8.10.7. Key strategic moves and developments
