 |
市場調査レポート
商品コード
1414918
集光型太陽光発電市場:技術別、最終用途産業別:世界の機会分析と産業予測、2023-2032年Concentrated Solar Power Market By Technology (Parabolic Trough, Solar Power Tower, Fresnel Reflectors, Dish Stirling), By End Use Industry (Residential, Commercial, Industrial): Global Opportunity Analysis and Industry Forecast, 2023-2032 |
||||||

| 集光型太陽光発電市場:技術別、最終用途産業別:世界の機会分析と産業予測、2023-2032年 |
|
出版日: 2023年11月30日
発行: Allied Market Research
ページ情報: 英文 250 Pages
納期: 2~3営業日
|
- 全表示
- 概要
- 図表
- 目次
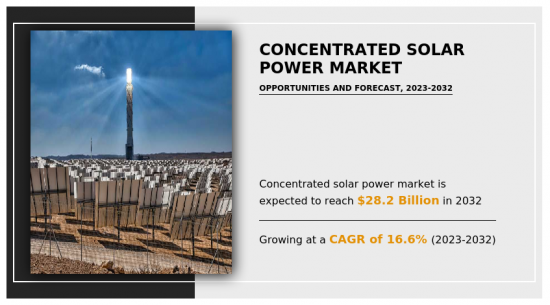
集光型太陽光発電の市場規模は、2022年に61億米ドルと評価され、2023年から2032年にかけて16.6%のCAGRで成長し、2032年には282億米ドルに達すると推定されています。
集光型太陽電池パネル(CSP)は、太陽光を鏡やレンズを通して利用し、より小さな面積に集光して発電や熱エネルギーを得るように設計された太陽電池技術の一種です。このシステムは、半導体材料を使って太陽光を直接電気に変換する従来の太陽光発電(PV)ソーラーパネルとは異なります。
集光型太陽光発電は、世界のエネルギー情勢において、再生可能エネルギーとして重要な位置を占める、いくつかの明確な利点を有しています。太陽光とクリーンなエネルギーを使って、効率的かつ確実に発電できるのです。CSPシステムは、鏡やレンズを使って太陽光をレシーバーに集光し、流体を加熱して蒸気を発生させ、タービンを動かして発電します。さらに、CSP技術のスケーラビリティは大きな利点です。CSPプラントは、小規模なものから広い地域をカバーするユーティリティ・スケールの発電所まで、さまざまな規模で建設されます。この拡張性により、個々の地域社会向けであれ、地域の送電網に大きく貢献するためであれ、さまざまなエネルギー需要に柔軟に対応することができます。
CSPの環境面でのメリットは大きいです。温室効果ガスやその他の有害な汚染物質を排出することなく電力を生産し、気候変動の緩和と大気汚染の軽減に大きく貢献します。化石燃料による発電を代替することで、CSPは再生不可能な資源への依存を減らし、従来のエネルギー発電に伴う環境への影響を最小限に抑えることができます。これらすべての要因が、予測期間中に集光型集光型太陽光発電の需要を増加させる。
ハイブリッド・システムは、CSPを従来の発電所や、送電網の信頼性と安定性を高める風力や太陽光発電のような他の再生可能エネルギーと組み合わせたものです。CSPをエネルギー貯蔵ソリューションと組み合わせることで、24時間電力供給が可能になり、グリッドバランシングやピークカットが容易になるため、太陽エネルギーに関連する断続性の課題に対処できます。これらすべての要因が、予測期間中に集光型太陽光発電市場に新たな成長機会をもたらすと予想されます。
集光型太陽光発電市場は、技術、最終用途産業、地域によって区分されます。技術別では、パラボラトラフ型、ソーラーパワータワー型、フレネルリフレクター型、ディッシュスターリング型に分類されます。ソーラーパワータワー技術は、2022年の世界の集光型太陽光発電市場の収益の半分以上を占め、予測期間中もその優位性を維持すると予測されています。ソーラーパワータワーは、他のCSP技術に比べて高温を達成できる可能性があります。これにより、蒸気タービンによる効率的な発電が可能になり、設置容量当たりのエネルギー出力が高くなります。
最終用途産業別に見ると、市場は住宅用、商業用、産業用に分けられます。産業用セグメントは、2022年の集光型太陽光発電市場収益の半分を占め、予測期間中もその優位性を維持すると予想されます。産業界では、以下のようなさまざまな製造工程で高温の熱を必要とすることが多いです。
- セメント、鉄鋼、化学薬品、海水淡水化などの製造。CSPシステムは、この高温の熱を効率的に供給し、化石燃料を使用する暖房方法に代わるものを提供します。さらに、厳しい環境規制や企業の持続可能性への取り組みが、産業界をよりクリーンなエネルギー源へと移行させる。カーボンニュートラルで環境に優しいエネルギーソリューションであるCSPは、こうした目標に合致しており、産業界の二酸化炭素排出量削減に貢献しています。
地域別では、北米、欧州、アジア太平洋、LAMEAの市場が分析されています。地域別では、アジア太平洋地域が2022年の世界の集光型太陽光発電市場の成長収益の半分以上を占めており、予測期間中もその優位性を維持すると見られています。アジア太平洋地域は、大幅な経済成長と工業化が進み、エネルギー需要が増加しています。CSPは、特に電力不足に直面している国やエネルギー・ミックスの多様化を模索している国において、この増大するエネルギー需要を持続的に満たす機会を提供します。
- 集光型太陽光発電業界の主要企業には、Aalborg CSP、Acciona、ACWA Power、Atlantica Sustainable Infrastructure plc.、Brightsource、FRENELL GMBH、General Electric、Rioglass Solar Inc.、Sener、Siemens Energy AGなどがあります。また、市場促進要因、市場抑制要因、市場機会についても解説しています。
- これらの主要企業以外にも、集光型太陽光発電市場分析における主要企業が存在します。これらには、Abengoa Solar、SolarReserve、TSK Flagsol Engineering GmbH、Schott AG、Therminol、Cobra Group、Idhelio、Novatec Biosol、Enel Green Powerが含まれます。
- 技術別では、フレネルリフレクターセグメントは予測期間中、収益ベースでCAGR 17.6%で成長すると予測されます。
- 最終用途産業別では、産業用セグメントは予測期間中、収益ベースでCAGR 16.3%で成長すると予測されます。
- 地域別では、アジア太平洋地域が収益ベースで2022年に最も高いシェアを占めています。
目次
第1章 イントロダクション
第2章 エグゼクティブサマリー
第3章 市場概要
- 市場の定義と範囲
- 主な調査結果
- 影響要因
- 主な投資機会
- ポーターのファイブフォース分析
- 市場力学
- 促進要因
- 再生可能エネルギー需要の急増
- 政府のインセンティブ、補助金、政策
- 抑制要因
- 投資コストの高さ
- 機会
- ハイブリッド化とシステム統合
- 促進要因
- バリューチェーン分析
- 主要規制分析
- 特許情勢
第4章 集積型集光型太陽光発電市場:技術別
- 概要
- パラボラトラフ
- 太陽光発電タワー
- フレネル反射鏡
- ディッシュスターリング
第5章 集光型太陽光発電市場:エンドユーザー産業別
- 概要
- 住宅用
- 商業用
- 産業用
第6章 集光型太陽光発電市場:地域別
- 概要
- 北米
- 米国
- カナダ
- メキシコ
- 欧州
- ドイツ
- イタリア
- スペイン
- 英国
- フランス
- その他
- アジア太平洋
- 中国
- 日本
- インド
- 韓国
- その他
- ラテンアメリカ・中東・アフリカ
- ブラジル
- サウジアラビア
- 南アフリカ
- その他
第7章 競合情勢
- イントロダクション
- 主要成功戦略
- 主要10社の製品マッピング
- 競合ダッシュボード
- 競合ヒートマップ
- 主要企業のポジショニング 2022年
第8章 企業プロファイル
- Acciona
- Aalborg CSP
- ACWA Power
- Atlantica Sustainable Infrastructure plc.
- Brightsource
- FRENELL GMBH
- General Electric
- Rioglass Solar Inc.
- Sener
- Siemens Energy AG
LIST OF TABLES
- TABLE 01. GLOBAL CONCENTRATED SOLAR POWER MARKET, BY TECHNOLOGY, 2022-2032 ($MILLION)
- TABLE 02. CONCENTRATED SOLAR POWER MARKET FOR PARABOLIC TROUGH, BY REGION, 2022-2032 ($MILLION)
- TABLE 03. CONCENTRATED SOLAR POWER MARKET FOR SOLAR POWER TOWER, BY REGION, 2022-2032 ($MILLION)
- TABLE 04. CONCENTRATED SOLAR POWER MARKET FOR FRESNEL REFLECTORS, BY REGION, 2022-2032 ($MILLION)
- TABLE 05. CONCENTRATED SOLAR POWER MARKET FOR DISH STIRLING, BY REGION, 2022-2032 ($MILLION)
- TABLE 06. GLOBAL CONCENTRATED SOLAR POWER MARKET, BY END USE INDUSTRY, 2022-2032 ($MILLION)
- TABLE 07. CONCENTRATED SOLAR POWER MARKET FOR RESIDENTIAL, BY REGION, 2022-2032 ($MILLION)
- TABLE 08. CONCENTRATED SOLAR POWER MARKET FOR COMMERCIAL, BY REGION, 2022-2032 ($MILLION)
- TABLE 09. CONCENTRATED SOLAR POWER MARKET FOR INDUSTRIAL, BY REGION, 2022-2032 ($MILLION)
- TABLE 10. CONCENTRATED SOLAR POWER MARKET, BY REGION, 2022-2032 ($MILLION)
- TABLE 11. NORTH AMERICA CONCENTRATED SOLAR POWER MARKET, BY TECHNOLOGY, 2022-2032 ($MILLION)
- TABLE 12. NORTH AMERICA CONCENTRATED SOLAR POWER MARKET, BY END USE INDUSTRY, 2022-2032 ($MILLION)
- TABLE 13. NORTH AMERICA CONCENTRATED SOLAR POWER MARKET, BY COUNTRY, 2022-2032 ($MILLION)
- TABLE 14. U.S. CONCENTRATED SOLAR POWER MARKET, BY TECHNOLOGY, 2022-2032 ($MILLION)
- TABLE 15. U.S. CONCENTRATED SOLAR POWER MARKET, BY END USE INDUSTRY, 2022-2032 ($MILLION)
- TABLE 16. CANADA CONCENTRATED SOLAR POWER MARKET, BY TECHNOLOGY, 2022-2032 ($MILLION)
- TABLE 17. CANADA CONCENTRATED SOLAR POWER MARKET, BY END USE INDUSTRY, 2022-2032 ($MILLION)
- TABLE 18. MEXICO CONCENTRATED SOLAR POWER MARKET, BY TECHNOLOGY, 2022-2032 ($MILLION)
- TABLE 19. MEXICO CONCENTRATED SOLAR POWER MARKET, BY END USE INDUSTRY, 2022-2032 ($MILLION)
- TABLE 20. EUROPE CONCENTRATED SOLAR POWER MARKET, BY TECHNOLOGY, 2022-2032 ($MILLION)
- TABLE 21. EUROPE CONCENTRATED SOLAR POWER MARKET, BY END USE INDUSTRY, 2022-2032 ($MILLION)
- TABLE 22. EUROPE CONCENTRATED SOLAR POWER MARKET, BY COUNTRY, 2022-2032 ($MILLION)
- TABLE 23. GERMANY CONCENTRATED SOLAR POWER MARKET, BY TECHNOLOGY, 2022-2032 ($MILLION)
- TABLE 24. GERMANY CONCENTRATED SOLAR POWER MARKET, BY END USE INDUSTRY, 2022-2032 ($MILLION)
- TABLE 25. ITALY CONCENTRATED SOLAR POWER MARKET, BY TECHNOLOGY, 2022-2032 ($MILLION)
- TABLE 26. ITALY CONCENTRATED SOLAR POWER MARKET, BY END USE INDUSTRY, 2022-2032 ($MILLION)
- TABLE 27. SPAIN CONCENTRATED SOLAR POWER MARKET, BY TECHNOLOGY, 2022-2032 ($MILLION)
- TABLE 28. SPAIN CONCENTRATED SOLAR POWER MARKET, BY END USE INDUSTRY, 2022-2032 ($MILLION)
- TABLE 29. UK CONCENTRATED SOLAR POWER MARKET, BY TECHNOLOGY, 2022-2032 ($MILLION)
- TABLE 30. UK CONCENTRATED SOLAR POWER MARKET, BY END USE INDUSTRY, 2022-2032 ($MILLION)
- TABLE 31. FRANCE CONCENTRATED SOLAR POWER MARKET, BY TECHNOLOGY, 2022-2032 ($MILLION)
- TABLE 32. FRANCE CONCENTRATED SOLAR POWER MARKET, BY END USE INDUSTRY, 2022-2032 ($MILLION)
- TABLE 33. REST OF EUROPE CONCENTRATED SOLAR POWER MARKET, BY TECHNOLOGY, 2022-2032 ($MILLION)
- TABLE 34. REST OF EUROPE CONCENTRATED SOLAR POWER MARKET, BY END USE INDUSTRY, 2022-2032 ($MILLION)
- TABLE 35. ASIA-PACIFIC CONCENTRATED SOLAR POWER MARKET, BY TECHNOLOGY, 2022-2032 ($MILLION)
- TABLE 36. ASIA-PACIFIC CONCENTRATED SOLAR POWER MARKET, BY END USE INDUSTRY, 2022-2032 ($MILLION)
- TABLE 37. ASIA-PACIFIC CONCENTRATED SOLAR POWER MARKET, BY COUNTRY, 2022-2032 ($MILLION)
- TABLE 38. CHINA CONCENTRATED SOLAR POWER MARKET, BY TECHNOLOGY, 2022-2032 ($MILLION)
- TABLE 39. CHINA CONCENTRATED SOLAR POWER MARKET, BY END USE INDUSTRY, 2022-2032 ($MILLION)
- TABLE 40. JAPAN CONCENTRATED SOLAR POWER MARKET, BY TECHNOLOGY, 2022-2032 ($MILLION)
- TABLE 41. JAPAN CONCENTRATED SOLAR POWER MARKET, BY END USE INDUSTRY, 2022-2032 ($MILLION)
- TABLE 42. INDIA CONCENTRATED SOLAR POWER MARKET, BY TECHNOLOGY, 2022-2032 ($MILLION)
- TABLE 43. INDIA CONCENTRATED SOLAR POWER MARKET, BY END USE INDUSTRY, 2022-2032 ($MILLION)
- TABLE 44. SOUTH KOREA CONCENTRATED SOLAR POWER MARKET, BY TECHNOLOGY, 2022-2032 ($MILLION)
- TABLE 45. SOUTH KOREA CONCENTRATED SOLAR POWER MARKET, BY END USE INDUSTRY, 2022-2032 ($MILLION)
- TABLE 46. REST OF ASIA-PACIFIC CONCENTRATED SOLAR POWER MARKET, BY TECHNOLOGY, 2022-2032 ($MILLION)
- TABLE 47. REST OF ASIA-PACIFIC CONCENTRATED SOLAR POWER MARKET, BY END USE INDUSTRY, 2022-2032 ($MILLION)
- TABLE 48. LAMEA CONCENTRATED SOLAR POWER MARKET, BY TECHNOLOGY, 2022-2032 ($MILLION)
- TABLE 49. LAMEA CONCENTRATED SOLAR POWER MARKET, BY END USE INDUSTRY, 2022-2032 ($MILLION)
- TABLE 50. LAMEA CONCENTRATED SOLAR POWER MARKET, BY COUNTRY, 2022-2032 ($MILLION)
- TABLE 51. BRAZIL CONCENTRATED SOLAR POWER MARKET, BY TECHNOLOGY, 2022-2032 ($MILLION)
- TABLE 52. BRAZIL CONCENTRATED SOLAR POWER MARKET, BY END USE INDUSTRY, 2022-2032 ($MILLION)
- TABLE 53. SAUDI ARABIA CONCENTRATED SOLAR POWER MARKET, BY TECHNOLOGY, 2022-2032 ($MILLION)
- TABLE 54. SAUDI ARABIA CONCENTRATED SOLAR POWER MARKET, BY END USE INDUSTRY, 2022-2032 ($MILLION)
- TABLE 55. SOUTH AFRICA CONCENTRATED SOLAR POWER MARKET, BY TECHNOLOGY, 2022-2032 ($MILLION)
- TABLE 56. SOUTH AFRICA CONCENTRATED SOLAR POWER MARKET, BY END USE INDUSTRY, 2022-2032 ($MILLION)
- TABLE 57. REST OF LAMEA CONCENTRATED SOLAR POWER MARKET, BY TECHNOLOGY, 2022-2032 ($MILLION)
- TABLE 58. REST OF LAMEA CONCENTRATED SOLAR POWER MARKET, BY END USE INDUSTRY, 2022-2032 ($MILLION)
- TABLE 59. ACCIONA: KEY EXECUTIVES
- TABLE 60. ACCIONA: COMPANY SNAPSHOT
- TABLE 61. ACCIONA: SERVICE SEGMENTS
- TABLE 62. ACCIONA: PRODUCT PORTFOLIO
- TABLE 63. ACCIONA: KEY STRATERGIES
- TABLE 64. AALBORG CSP: KEY EXECUTIVES
- TABLE 65. AALBORG CSP: COMPANY SNAPSHOT
- TABLE 66. AALBORG CSP: PRODUCT SEGMENTS
- TABLE 67. AALBORG CSP: PRODUCT PORTFOLIO
- TABLE 68. ACWA POWER: KEY EXECUTIVES
- TABLE 69. ACWA POWER: COMPANY SNAPSHOT
- TABLE 70. ACWA POWER: PRODUCT SEGMENTS
- TABLE 71. ACWA POWER: PRODUCT PORTFOLIO
- TABLE 72. ACWA POWER: KEY STRATERGIES
- TABLE 73. ATLANTICA SUSTAINABLE INFRASTRUCTURE PLC.: KEY EXECUTIVES
- TABLE 74. ATLANTICA SUSTAINABLE INFRASTRUCTURE PLC.: COMPANY SNAPSHOT
- TABLE 75. ATLANTICA SUSTAINABLE INFRASTRUCTURE PLC.: PRODUCT SEGMENTS
- TABLE 76. ATLANTICA SUSTAINABLE INFRASTRUCTURE PLC.: PRODUCT PORTFOLIO
- TABLE 77. BRIGHTSOURCE: KEY EXECUTIVES
- TABLE 78. BRIGHTSOURCE: COMPANY SNAPSHOT
- TABLE 79. BRIGHTSOURCE: PRODUCT SEGMENTS
- TABLE 80. BRIGHTSOURCE: PRODUCT PORTFOLIO
- TABLE 81. FRENELL GMBH: KEY EXECUTIVES
- TABLE 82. FRENELL GMBH: COMPANY SNAPSHOT
- TABLE 83. FRENELL GMBH: PRODUCT SEGMENTS
- TABLE 84. FRENELL GMBH: SERVICE SEGMENTS
- TABLE 85. FRENELL GMBH: PRODUCT PORTFOLIO
- TABLE 86. GENERAL ELECTRIC: KEY EXECUTIVES
- TABLE 87. GENERAL ELECTRIC: COMPANY SNAPSHOT
- TABLE 88. GENERAL ELECTRIC: PRODUCT SEGMENTS
- TABLE 89. GENERAL ELECTRIC: PRODUCT PORTFOLIO
- TABLE 90. GENERAL ELECTRIC: KEY STRATERGIES
- TABLE 91. RIOGLASS SOLAR INC.: KEY EXECUTIVES
- TABLE 92. RIOGLASS SOLAR INC.: COMPANY SNAPSHOT
- TABLE 93. RIOGLASS SOLAR INC.: PRODUCT SEGMENTS
- TABLE 94. RIOGLASS SOLAR INC.: PRODUCT PORTFOLIO
- TABLE 95. SENER: KEY EXECUTIVES
- TABLE 96. SENER: COMPANY SNAPSHOT
- TABLE 97. SENER: PRODUCT SEGMENTS
- TABLE 98. SENER: PRODUCT PORTFOLIO
- TABLE 99. SIEMENS ENERGY AG: KEY EXECUTIVES
- TABLE 100. SIEMENS ENERGY AG: COMPANY SNAPSHOT
- TABLE 101. SIEMENS ENERGY AG: PRODUCT SEGMENTS
- TABLE 102. SIEMENS ENERGY AG: PRODUCT PORTFOLIO
- TABLE 103. SIEMENS ENERGY AG: KEY STRATERGIES
LIST OF FIGURES
- FIGURE 01. CONCENTRATED SOLAR POWER MARKET, 2022-2032
- FIGURE 02. SEGMENTATION OF CONCENTRATED SOLAR POWER MARKET,2022-2032
- FIGURE 03. TOP IMPACTING FACTORS IN CONCENTRATED SOLAR POWER MARKET (2022 TO 2032)
- FIGURE 04. TOP INVESTMENT POCKETS IN CONCENTRATED SOLAR POWER MARKET (2023-2032)
- FIGURE 05. MODERATE BARGAINING POWER OF SUPPLIERS
- FIGURE 06. MODERATE THREAT OF NEW ENTRANTS
- FIGURE 07. LOW THREAT OF SUBSTITUTES
- FIGURE 08. MODERATE INTENSITY OF RIVALRY
- FIGURE 09. MODERATE BARGAINING POWER OF BUYERS
- FIGURE 10. GLOBAL CONCENTRATED SOLAR POWER MARKET:DRIVERS, RESTRAINTS AND OPPORTUNITIES
- FIGURE 11. IMPACT OF KEY REGULATION: CONCENTRATED SOLAR POWER MARKET
- FIGURE 12. PATENT ANALYSIS BY COMPANY
- FIGURE 13. PATENT ANALYSIS BY COUNTRY
- FIGURE 14. CONCENTRATED SOLAR POWER MARKET, BY TECHNOLOGY, 2022 AND 2032(%)
- FIGURE 15. COMPARATIVE SHARE ANALYSIS OF CONCENTRATED SOLAR POWER MARKET FOR PARABOLIC TROUGH, BY COUNTRY 2022 AND 2032(%)
- FIGURE 16. COMPARATIVE SHARE ANALYSIS OF CONCENTRATED SOLAR POWER MARKET FOR SOLAR POWER TOWER, BY COUNTRY 2022 AND 2032(%)
- FIGURE 17. COMPARATIVE SHARE ANALYSIS OF CONCENTRATED SOLAR POWER MARKET FOR FRESNEL REFLECTORS, BY COUNTRY 2022 AND 2032(%)
- FIGURE 18. COMPARATIVE SHARE ANALYSIS OF CONCENTRATED SOLAR POWER MARKET FOR DISH STIRLING, BY COUNTRY 2022 AND 2032(%)
- FIGURE 19. CONCENTRATED SOLAR POWER MARKET, BY END USE INDUSTRY, 2022 AND 2032(%)
- FIGURE 20. COMPARATIVE SHARE ANALYSIS OF CONCENTRATED SOLAR POWER MARKET FOR RESIDENTIAL, BY COUNTRY 2022 AND 2032(%)
- FIGURE 21. COMPARATIVE SHARE ANALYSIS OF CONCENTRATED SOLAR POWER MARKET FOR COMMERCIAL, BY COUNTRY 2022 AND 2032(%)
- FIGURE 22. COMPARATIVE SHARE ANALYSIS OF CONCENTRATED SOLAR POWER MARKET FOR INDUSTRIAL, BY COUNTRY 2022 AND 2032(%)
- FIGURE 23. CONCENTRATED SOLAR POWER MARKET BY REGION, 2022 AND 2032(%)
- FIGURE 24. U.S. CONCENTRATED SOLAR POWER MARKET, 2022-2032 ($MILLION)
- FIGURE 25. CANADA CONCENTRATED SOLAR POWER MARKET, 2022-2032 ($MILLION)
- FIGURE 26. MEXICO CONCENTRATED SOLAR POWER MARKET, 2022-2032 ($MILLION)
- FIGURE 27. GERMANY CONCENTRATED SOLAR POWER MARKET, 2022-2032 ($MILLION)
- FIGURE 28. ITALY CONCENTRATED SOLAR POWER MARKET, 2022-2032 ($MILLION)
- FIGURE 29. SPAIN CONCENTRATED SOLAR POWER MARKET, 2022-2032 ($MILLION)
- FIGURE 30. UK CONCENTRATED SOLAR POWER MARKET, 2022-2032 ($MILLION)
- FIGURE 31. FRANCE CONCENTRATED SOLAR POWER MARKET, 2022-2032 ($MILLION)
- FIGURE 32. REST OF EUROPE CONCENTRATED SOLAR POWER MARKET, 2022-2032 ($MILLION)
- FIGURE 33. CHINA CONCENTRATED SOLAR POWER MARKET, 2022-2032 ($MILLION)
- FIGURE 34. JAPAN CONCENTRATED SOLAR POWER MARKET, 2022-2032 ($MILLION)
- FIGURE 35. INDIA CONCENTRATED SOLAR POWER MARKET, 2022-2032 ($MILLION)
- FIGURE 36. SOUTH KOREA CONCENTRATED SOLAR POWER MARKET, 2022-2032 ($MILLION)
- FIGURE 37. REST OF ASIA-PACIFIC CONCENTRATED SOLAR POWER MARKET, 2022-2032 ($MILLION)
- FIGURE 38. BRAZIL CONCENTRATED SOLAR POWER MARKET, 2022-2032 ($MILLION)
- FIGURE 39. SAUDI ARABIA CONCENTRATED SOLAR POWER MARKET, 2022-2032 ($MILLION)
- FIGURE 40. SOUTH AFRICA CONCENTRATED SOLAR POWER MARKET, 2022-2032 ($MILLION)
- FIGURE 41. REST OF LAMEA CONCENTRATED SOLAR POWER MARKET, 2022-2032 ($MILLION)
- FIGURE 42. TOP WINNING STRATEGIES, BY YEAR (2022-2023)
- FIGURE 43. TOP WINNING STRATEGIES, BY DEVELOPMENT (2022-2023)
- FIGURE 44. TOP WINNING STRATEGIES, BY COMPANY (2022-2023)
- FIGURE 45. PRODUCT MAPPING OF TOP 10 PLAYERS
- FIGURE 46. COMPETITIVE DASHBOARD
- FIGURE 47. COMPETITIVE HEATMAP: CONCENTRATED SOLAR POWER MARKET
- FIGURE 48. TOP PLAYER POSITIONING, 2022
- FIGURE 49. ACCIONA: NET REVENUE, 2020-2022 ($MILLION)
- FIGURE 50. ACCIONA: REVENUE SHARE BY SEGMENT, 2022 (%)
- FIGURE 51. ACWA POWER: NET REVENUE, 2020-2022 ($MILLION)
- FIGURE 52. ACWA POWER: REVENUE SHARE BY SEGMENT, 2022 (%)
- FIGURE 53. ACWA POWER: REVENUE SHARE BY REGION, 2022 (%)
- FIGURE 54. ATLANTICA SUSTAINABLE INFRASTRUCTURE PLC.: NET REVENUE, 2020-2022 ($MILLION)
- FIGURE 55. ATLANTICA SUSTAINABLE INFRASTRUCTURE PLC.: REVENUE SHARE BY REGION, 2022 (%)
- FIGURE 56. GENERAL ELECTRIC: NET REVENUE, 2020-2022 ($MILLION)
- FIGURE 57. GENERAL ELECTRIC: RESEARCH & DEVELOPMENT EXPENDITURE, 2020-2022 ($MILLION)
- FIGURE 58. GENERAL ELECTRIC: REVENUE SHARE BY SEGMENT, 2022 (%)
- FIGURE 59. GENERAL ELECTRIC: REVENUE SHARE BY REGION, 2022 (%)
- FIGURE 60. SIEMENS ENERGY AG: NET SALES, 2020-2022 ($MILLION)
- FIGURE 61. SIEMENS ENERGY AG: RESEARCH & DEVELOPMENT EXPENDITURE, 2020-2022 ($MILLION)
- FIGURE 62. SIEMENS ENERGY AG: REVENUE SHARE BY SEGMENT, 2022 (%)
- FIGURE 63. SIEMENS ENERGY AG: REVENUE SHARE BY REGION, 2022 (%)
According to a new report published by Allied Market Research, titled, "Concentrated Solar Power Market," The concentrated solar power market size was valued at $6.1 billion in 2022, and is estimated to reach $28.2 billion by 2032, growing at a CAGR of 16.6% from 2023 to 2032.
Concentrated solar panels (CSP) represent a category of solar technology designed to harness sunlight through mirrors or lenses, concentrating sunlight onto a smaller area to generate electricity or thermal energy. These systems differ from traditional photovoltaic (PV) solar panels, which convert sunlight directly into electricity using semiconductor materials.
Concentrated solar power holds several distinct advantages that position it as a prominent renewable energy source in the global energy landscape. It has the ability to generate electricity efficiently and reliably using sunlight and clean energy. CSP systems use mirrors or lenses to concentrate sunlight onto receivers, heating a fluid to produce steam that drives turbines and generates electricity. Moreover, the scalability of CSP technology is a significant advantage. CSP plants are built at various scales, from small-scale installations to utility-scale power plants covering large areas. This scalability enables flexibility in meeting different energy demands, whether for individual communities or to contribute significantly to a regional power grid.
The environmental benefits of CSP are substantial. It produces electricity without emitting greenhouse gases or other harmful pollutants, contributing significantly to mitigating climate change and reducing air pollution. By displacing fossil fuel-based power generation, CSP helps decrease reliance on non-renewable resources and minimizes the environmental impact associated with conventional energy production. All these factors increase the demand for concentrated solar power during the forecast period.
Hybrid systems combine CSP with conventional power plants or other renewables like wind or PV that offer enhanced reliability and stability to the grid. Coupling CSP with energy storage solutions enables round-the-clock electricity supply and facilitates grid balancing and peak shaving, thereby addressing intermittency challenges associated with solar energy. All these factors are anticipated to offer new growth opportunities for the concentrated solar power market during the forecast period.
The concentrated solar power market is segmented on the basis of technology, end-use industry, and region. By technology, the market is classified into parabolic trough, solar power tower, Fresnel reflectors, and dish stirling. The solar power tower technology accounted for more than half of the global concentrated solar power market revenue in 2022 and is expected to maintain its dominance during the forecast period. Solar power towers have the potential to achieve higher temperatures compared to other CSP technologies. This allows for efficient electricity generation through steam turbines, resulting in higher energy output per unit of installed capacity.
By end-use industry, the market is divided into residential, commercial, and industrial. The industrial segment accounted for half of the concentrated solar power market revenue in 2022 and is expected to maintain its dominance during the forecast period. Industries often require high-temperature heat for various manufacturing processes, such as in the production of cement, steel, chemicals, or desalination. CSP systemsw provide this high-temperature heat efficiently, offering an alternative to fossil fuel-based heating methods. In addition, stringent environmental regulations and corporate sustainability initiatives drive industries to transition towards cleaner energy sources. CSP, being a carbon-neutral and environmentally friendly energy solution, aligns with these goals, helping industries reduce their carbon footprint.
By region, the market is analyzed across North America, Europe, Asia-Pacific, and LAMEA. On the basis of region, Asia-Pacific accounted for more than half of the global concentrated solar power market growth revenue in 2022 and is expected to maintain its dominance during the forecast period. The Asia-Pacific region experiences substantial economic growth and industrialization, leading to an increasing demand for energy. CSP presents an opportunity to meet this growing energy demand sustainably, especially in countries facing power shortages or seeking to diversify their energy mix.
- Key players in the concentrated solar power industry include Aalborg CSP, Acciona, ACWA Power, Atlantica Sustainable Infrastructure plc., Brightsource, FRENELL GMBH, General Electric, Rioglass Solar Inc., Sener, and Siemens Energy AG. In addition, the market drivers, restraints, and opportunities are explained in the report.
- Apart from these major players, there are other key players in the concentrated solar power market analysis. These include Abengoa Solar, SolarReserve, TSK Flagsol Engineering GmbH, Schott AG, Therminol, Cobra Group, Idhelio, Novatec Biosol, and Enel Green Power.
- Key findings of the study
- On the basis of technology, the Fresnel reflectors segment is expected to grow at a CAGR of 17.6%, in terms of revenue, during the forecast period.
- On the basis of end-use industry, the industrial segment is expected to grow at a CAGR of 16.3%, in terms of revenue, during the forecast period.
- Region-wise, Asia-Pacific has the highest share in 2022 in terms of revenue.
Key Benefits For Stakeholders
- This report provides a quantitative analysis of the market segments, current trends, estimations, and dynamics of the concentrated solar power market share analysis from 2022 to 2032 to identify the prevailing concentrated solar power market opportunities.
- The market research is offered along with information related to key drivers, restraints, and opportunities.
- Porter's five forces analysis highlights the potency of buyers and suppliers to enable stakeholders make profit-oriented business decisions and strengthen their supplier-buyer network.
- In-depth analysis of the concentrated solar power market forecast, and segmentation assists to determine the prevailing market opportunities.
- Major countries in each region are mapped according to their revenue contribution to the global market.
- Market player positioning facilitates benchmarking and provides a clear understanding of the present position of the market players.
- The report includes the analysis of the regional as well as global concentrated solar power market trends, key players, market segments, application areas, and market growth strategies.
Additional benefits you will get with this purchase are:
- Quarterly Update and* (only available with a corporate license, on listed price)
- 5 additional Company Profile of client Choice pre- or Post-purchase, as a free update.
- Free Upcoming Version on the Purchase of Five and Enterprise User License.
- 16 analyst hours of support* (post-purchase, if you find additional data requirements upon review of the report, you may receive support amounting to 16 analyst hours to solve questions, and post-sale queries)
- 15% Free Customization* (in case the scope or segment of the report does not match your requirements, 15% is equivalent to 3 working days of free work, applicable once)
- Free data Pack on the Five and Enterprise User License. (Excel version of the report)
- Free Updated report if the report is 6-12 months old or older.
- 24-hour priority response*
- Free Industry updates and white papers.
Possible Customization with this report (with additional cost and timeline, please talk to the sales executive to know more)
- Manufacturing Capacity
- Capital Investment breakdown
- End user preferences and pain points
- Installed Base analysis
- Investment Opportunities
- Technology Trend Analysis
- Go To Market Strategy
- Market share analysis of players by products/segments
- New Product Development/ Product Matrix of Key Players
- Regulatory Guidelines
- Strategic Recommedations
- Additional company profiles with specific to client's interest
- Additional country or region analysis- market size and forecast
- Expanded list for Company Profiles
- Key player details (including location, contact details, supplier/vendor network etc. in excel format)
- Market share analysis of players at global/region/country level
- SWOT Analysis
Key Market Segments
By Technology
- Parabolic Trough
- Solar Power Tower
- Fresnel Reflectors
- Dish Stirling
By End Use Industry
- Residential
- Commercial
- Industrial
By Region
- North America
- U.S.
- Canada
- Mexico
- Europe
- Germany
- Italy
- Spain
- UK
- France
- Rest of Europe
- Asia-Pacific
- China
- Japan
- India
- South Korea
- Rest of Asia-Pacific
- LAMEA
- Brazil
- Saudi Arabia
- South Africa
- Rest of LAMEA
Key Market Players:
- Siemens Energy AG
- FRENELL GMBH
- ACWA Power
- Acciona
- Atlantica Sustainable Infrastructure plc.
- Brightsource
- Rioglass Solar Inc.
- General Electric
- Aalborg CSP
- Sener
TABLE OF CONTENTS
CHAPTER 1: INTRODUCTION
- 1.1. Report description
- 1.2. Key market segments
- 1.3. Key benefits to the stakeholders
- 1.4. Research methodology
- 1.4.1. Primary research
- 1.4.2. Secondary research
- 1.4.3. Analyst tools and models
CHAPTER 2: EXECUTIVE SUMMARY
- 2.1. CXO Perspective
CHAPTER 3: MARKET OVERVIEW
- 3.1. Market definition and scope
- 3.2. Key findings
- 3.2.1. Top impacting factors
- 3.2.2. Top investment pockets
- 3.3. Porter's five forces analysis
- 3.3.1. Moderate bargaining power of suppliers
- 3.3.2. Moderate threat of new entrants
- 3.3.3. Low threat of substitutes
- 3.3.4. Moderate intensity of rivalry
- 3.3.5. Moderate bargaining power of buyers
- 3.4. Market dynamics
- 3.4.1. Drivers
- 3.4.1.1. Surge in demand for renewable energy
- 3.4.1.2. Government incentives, subsidies, and policies
- 3.4.2. Restraints
- 3.4.2.1. High cost of investment
- 3.4.3. Opportunities
- 3.4.3.1. Hybridization and system integration
- 3.4.1. Drivers
- 3.5. Value Chain Analysis
- 3.6. Key Regulation Analysis
- 3.7. Patent Landscape
CHAPTER 4: CONCENTRATED SOLAR POWER MARKET, BY TECHNOLOGY
- 4.1. Overview
- 4.1.1. Market size and forecast
- 4.2. Parabolic Trough
- 4.2.1. Key market trends, growth factors and opportunities
- 4.2.2. Market size and forecast, by region
- 4.2.3. Market share analysis by country
- 4.3. Solar Power Tower
- 4.3.1. Key market trends, growth factors and opportunities
- 4.3.2. Market size and forecast, by region
- 4.3.3. Market share analysis by country
- 4.4. Fresnel Reflectors
- 4.4.1. Key market trends, growth factors and opportunities
- 4.4.2. Market size and forecast, by region
- 4.4.3. Market share analysis by country
- 4.5. Dish Stirling
- 4.5.1. Key market trends, growth factors and opportunities
- 4.5.2. Market size and forecast, by region
- 4.5.3. Market share analysis by country
CHAPTER 5: CONCENTRATED SOLAR POWER MARKET, BY END USE INDUSTRY
- 5.1. Overview
- 5.1.1. Market size and forecast
- 5.2. Residential
- 5.2.1. Key market trends, growth factors and opportunities
- 5.2.2. Market size and forecast, by region
- 5.2.3. Market share analysis by country
- 5.3. Commercial
- 5.3.1. Key market trends, growth factors and opportunities
- 5.3.2. Market size and forecast, by region
- 5.3.3. Market share analysis by country
- 5.4. Industrial
- 5.4.1. Key market trends, growth factors and opportunities
- 5.4.2. Market size and forecast, by region
- 5.4.3. Market share analysis by country
CHAPTER 6: CONCENTRATED SOLAR POWER MARKET, BY REGION
- 6.1. Overview
- 6.1.1. Market size and forecast By Region
- 6.2. North America
- 6.2.1. Key market trends, growth factors and opportunities
- 6.2.2. Market size and forecast, by Technology
- 6.2.3. Market size and forecast, by End Use Industry
- 6.2.4. Market size and forecast, by country
- 6.2.4.1. U.S.
- 6.2.4.1.1. Market size and forecast, by Technology
- 6.2.4.1.2. Market size and forecast, by End Use Industry
- 6.2.4.2. Canada
- 6.2.4.2.1. Market size and forecast, by Technology
- 6.2.4.2.2. Market size and forecast, by End Use Industry
- 6.2.4.3. Mexico
- 6.2.4.3.1. Market size and forecast, by Technology
- 6.2.4.3.2. Market size and forecast, by End Use Industry
- 6.3. Europe
- 6.3.1. Key market trends, growth factors and opportunities
- 6.3.2. Market size and forecast, by Technology
- 6.3.3. Market size and forecast, by End Use Industry
- 6.3.4. Market size and forecast, by country
- 6.3.4.1. Germany
- 6.3.4.1.1. Market size and forecast, by Technology
- 6.3.4.1.2. Market size and forecast, by End Use Industry
- 6.3.4.2. Italy
- 6.3.4.2.1. Market size and forecast, by Technology
- 6.3.4.2.2. Market size and forecast, by End Use Industry
- 6.3.4.3. Spain
- 6.3.4.3.1. Market size and forecast, by Technology
- 6.3.4.3.2. Market size and forecast, by End Use Industry
- 6.3.4.4. UK
- 6.3.4.4.1. Market size and forecast, by Technology
- 6.3.4.4.2. Market size and forecast, by End Use Industry
- 6.3.4.5. France
- 6.3.4.5.1. Market size and forecast, by Technology
- 6.3.4.5.2. Market size and forecast, by End Use Industry
- 6.3.4.6. Rest of Europe
- 6.3.4.6.1. Market size and forecast, by Technology
- 6.3.4.6.2. Market size and forecast, by End Use Industry
- 6.4. Asia-Pacific
- 6.4.1. Key market trends, growth factors and opportunities
- 6.4.2. Market size and forecast, by Technology
- 6.4.3. Market size and forecast, by End Use Industry
- 6.4.4. Market size and forecast, by country
- 6.4.4.1. China
- 6.4.4.1.1. Market size and forecast, by Technology
- 6.4.4.1.2. Market size and forecast, by End Use Industry
- 6.4.4.2. Japan
- 6.4.4.2.1. Market size and forecast, by Technology
- 6.4.4.2.2. Market size and forecast, by End Use Industry
- 6.4.4.3. India
- 6.4.4.3.1. Market size and forecast, by Technology
- 6.4.4.3.2. Market size and forecast, by End Use Industry
- 6.4.4.4. South Korea
- 6.4.4.4.1. Market size and forecast, by Technology
- 6.4.4.4.2. Market size and forecast, by End Use Industry
- 6.4.4.5. Rest of Asia-Pacific
- 6.4.4.5.1. Market size and forecast, by Technology
- 6.4.4.5.2. Market size and forecast, by End Use Industry
- 6.5. LAMEA
- 6.5.1. Key market trends, growth factors and opportunities
- 6.5.2. Market size and forecast, by Technology
- 6.5.3. Market size and forecast, by End Use Industry
- 6.5.4. Market size and forecast, by country
- 6.5.4.1. Brazil
- 6.5.4.1.1. Market size and forecast, by Technology
- 6.5.4.1.2. Market size and forecast, by End Use Industry
- 6.5.4.2. Saudi Arabia
- 6.5.4.2.1. Market size and forecast, by Technology
- 6.5.4.2.2. Market size and forecast, by End Use Industry
- 6.5.4.3. South Africa
- 6.5.4.3.1. Market size and forecast, by Technology
- 6.5.4.3.2. Market size and forecast, by End Use Industry
- 6.5.4.4. Rest of LAMEA
- 6.5.4.4.1. Market size and forecast, by Technology
- 6.5.4.4.2. Market size and forecast, by End Use Industry
CHAPTER 7: COMPETITIVE LANDSCAPE
- 7.1. Introduction
- 7.2. Top winning strategies
- 7.3. Product mapping of top 10 player
- 7.4. Competitive dashboard
- 7.5. Competitive heatmap
- 7.6. Top player positioning, 2022
CHAPTER 8: COMPANY PROFILES
- 8.1. Acciona
- 8.1.1. Company overview
- 8.1.2. Key executives
- 8.1.3. Company snapshot
- 8.1.4. Operating business segments
- 8.1.5. Product portfolio
- 8.1.6. Business performance
- 8.1.7. Key strategic moves and developments
- 8.2. Aalborg CSP
- 8.2.1. Company overview
- 8.2.2. Key executives
- 8.2.3. Company snapshot
- 8.2.4. Operating business segments
- 8.2.5. Product portfolio
- 8.3. ACWA Power
- 8.3.1. Company overview
- 8.3.2. Key executives
- 8.3.3. Company snapshot
- 8.3.4. Operating business segments
- 8.3.5. Product portfolio
- 8.3.6. Business performance
- 8.3.7. Key strategic moves and developments
- 8.4. Atlantica Sustainable Infrastructure plc.
- 8.4.1. Company overview
- 8.4.2. Key executives
- 8.4.3. Company snapshot
- 8.4.4. Operating business segments
- 8.4.5. Product portfolio
- 8.4.6. Business performance
- 8.5. Brightsource
- 8.5.1. Company overview
- 8.5.2. Key executives
- 8.5.3. Company snapshot
- 8.5.4. Operating business segments
- 8.5.5. Product portfolio
- 8.6. FRENELL GMBH
- 8.6.1. Company overview
- 8.6.2. Key executives
- 8.6.3. Company snapshot
- 8.6.4. Operating business segments
- 8.6.5. Product portfolio
- 8.7. General Electric
- 8.7.1. Company overview
- 8.7.2. Key executives
- 8.7.3. Company snapshot
- 8.7.4. Operating business segments
- 8.7.5. Product portfolio
- 8.7.6. Business performance
- 8.7.7. Key strategic moves and developments
- 8.8. Rioglass Solar Inc.
- 8.8.1. Company overview
- 8.8.2. Key executives
- 8.8.3. Company snapshot
- 8.8.4. Operating business segments
- 8.8.5. Product portfolio
- 8.9. Sener
- 8.9.1. Company overview
- 8.9.2. Key executives
- 8.9.3. Company snapshot
- 8.9.4. Operating business segments
- 8.9.5. Product portfolio
- 8.10. Siemens Energy AG
- 8.10.1. Company overview
- 8.10.2. Key executives
- 8.10.3. Company snapshot
- 8.10.4. Operating business segments
- 8.10.5. Product portfolio
- 8.10.6. Business performance
- 8.10.7. Key strategic moves and developments