
|
市場調査レポート
商品コード
1414912
クリケット分析ソフトウェア市場:提供サービス別、展開別、エンドユーザー別:世界の機会分析と産業予測、2023-2032年Cricket Analysis Software Market By Offering (Software, Service), By Deployment Mode (On-premise, Cloud), By End-User (Sport Associations, Coaching Institution, Others): Global Opportunity Analysis and Industry Forecast, 2023-2032 |
||||||
|
|||||||

| クリケット分析ソフトウェア市場:提供サービス別、展開別、エンドユーザー別:世界の機会分析と産業予測、2023-2032年 |
|
出版日: 2023年11月30日
発行: Allied Market Research
ページ情報: 英文 245 Pages
納期: 2~3営業日
|

- 全表示
- 概要
- 図表
- 目次
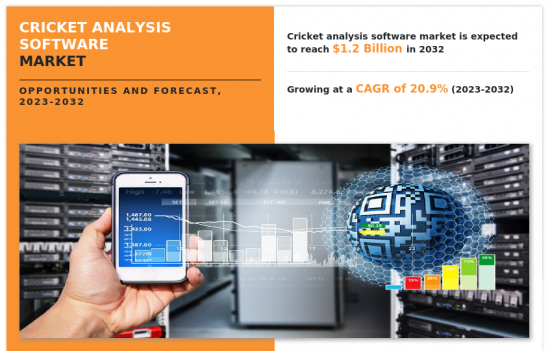
クリケット分析ソフトウェア市場は、2022年には1億8,154万米ドルと評価され、2023年から2032年までのCAGRは20.9%で成長し、2032年には12億米ドルに達すると予測されています。
クリケットのコーチングや戦略におけるデータ主導の洞察に対する需要の増加、選手育成のためのパフォーマンス分析重視の高まりが、クリケット分析ソフトウェア市場の成長にプラスの影響を与えました。
さらに、ボールトラッキングやビデオ分析などのテクノロジーの進歩、T20やその他のショートフォーマットクリケットの人気の高まりが、迅速で正確な意思決定の必要性を高めています。このような動向は、予測期間中のクリケット分析ソフトウェア市場の成長を促進すると予想されます。さらに、クリケットリーグやトーナメントの世界の拡大により、分析ソフトウェアの市場規模が拡大しています。くわえて、ソフトウェア開発者とクリケット委員会との間で、オーダーメイドのソリューションを提供するための協力機会や、より高度な予測分析のための人工知能(AI)と機械学習(ML)の統合が、予測期間中のクリケット分析ソフトウェア市場の成長に有利な成長機会を提供すると予想されます。
また、才能の発掘や市場開拓のために草の根やアマチュアクリケットで分析ソフトウェアを使用するケースが増加していることも、今後数年間でクリケット分析ソフトウェア市場の成長に数多くの機会をもたらすと予想されます。しかし、伝統的なクリケットのセットアップにおける技術導入への抵抗や、正確な分析のための高品質で一貫性のあるデータへの依存は、今後数年間の市場成長を制限します。加えて、一部のクリケット地域では認知度が低く、洗練された分析ツールへのアクセスが限られていることも、クリケット分析ソフトウェア市場の成長を妨げる可能性があります。
目次
第1章 イントロダクション
第2章 エグゼクティブサマリー
第3章 市場概要
- 市場の定義と範囲
- 主な調査結果
- 影響要因
- 主な投資機会
- ポーターのファイブフォース分析
- 市場力学
- 促進要因
- T20やその他のショートフォーマットクリケットの人気上昇
- クリケットのコーチングや戦略におけるデータ主導の洞察に対する需要の増加
- 抑制要因
- 高度な分析ソフトウェアの入手と導入に伴うコスト負担
- 機会
- より高度な予測分析のためのAIとMLの統合
- 促進要因
- 規制ガイドライン
第4章 クリケット分析ソフトウェア市場:提供サービス別
- 概要
- ソフトウェア
- サービス
第5章 クリケット分析ソフトウェア市場:展開別
- 概要
- オンプレミス
- クラウド
第6章 クリケット分析ソフトウェア市場:エンドユーザー別
- 概要
- スポーツ協会
- コーチング機関
- その他
第7章 クリケット分析ソフトウェア市場:地域別
- 概要
- 北米
- 米国
- カナダ
- 欧州
- 英国
- ドイツ
- フランス
- イタリア
- スペイン
- その他
- アジア太平洋
- 中国
- 日本
- インド
- オーストラリア
- 韓国
- その他
- ラテンアメリカ
- ラテンアメリカ
- 中東
- アフリカ
第8章 競合情勢
- イントロダクション
- 主要成功戦略
- 主要10社の製品マッピング
- 競合ダッシュボード
- 競合ヒートマップ
- 主要企業のポジショニング、2022年
第9章 企業プロファイル
- SportsMechanics
- Nacsport
- Catapult Sports Pty Ltd.
- CricViz Ltd.
- Cricket-21
- IBM Corporation
- SAP SE
- Genius Sports Group
- Oracle Corporation
- SAS Institute Inc.
LIST OF TABLES
- TABLE 01. GLOBAL CRICKET ANALYSIS SOFTWARE MARKET, BY OFFERING, 2022-2032 ($MILLION)
- TABLE 02. CRICKET ANALYSIS SOFTWARE MARKET FOR SOFTWARE, BY REGION, 2022-2032 ($MILLION)
- TABLE 03. CRICKET ANALYSIS SOFTWARE MARKET FOR SERVICE, BY REGION, 2022-2032 ($MILLION)
- TABLE 04. GLOBAL CRICKET ANALYSIS SOFTWARE MARKET, BY DEPLOYMENT MODE, 2022-2032 ($MILLION)
- TABLE 05. CRICKET ANALYSIS SOFTWARE MARKET FOR ON-PREMISE, BY REGION, 2022-2032 ($MILLION)
- TABLE 06. CRICKET ANALYSIS SOFTWARE MARKET FOR CLOUD, BY REGION, 2022-2032 ($MILLION)
- TABLE 07. GLOBAL CRICKET ANALYSIS SOFTWARE MARKET, BY END-USER, 2022-2032 ($MILLION)
- TABLE 08. CRICKET ANALYSIS SOFTWARE MARKET FOR SPORT ASSOCIATIONS, BY REGION, 2022-2032 ($MILLION)
- TABLE 09. CRICKET ANALYSIS SOFTWARE MARKET FOR COACHING INSTITUTION, BY REGION, 2022-2032 ($MILLION)
- TABLE 10. CRICKET ANALYSIS SOFTWARE MARKET FOR OTHERS, BY REGION, 2022-2032 ($MILLION)
- TABLE 11. CRICKET ANALYSIS SOFTWARE MARKET, BY REGION, 2022-2032 ($MILLION)
- TABLE 12. NORTH AMERICA CRICKET ANALYSIS SOFTWARE MARKET, BY OFFERING, 2022-2032 ($MILLION)
- TABLE 13. NORTH AMERICA CRICKET ANALYSIS SOFTWARE MARKET, BY DEPLOYMENT MODE, 2022-2032 ($MILLION)
- TABLE 14. NORTH AMERICA CRICKET ANALYSIS SOFTWARE MARKET, BY END-USER, 2022-2032 ($MILLION)
- TABLE 15. NORTH AMERICA CRICKET ANALYSIS SOFTWARE MARKET, BY COUNTRY, 2022-2032 ($MILLION)
- TABLE 16. U.S. CRICKET ANALYSIS SOFTWARE MARKET, BY OFFERING, 2022-2032 ($MILLION)
- TABLE 17. U.S. CRICKET ANALYSIS SOFTWARE MARKET, BY DEPLOYMENT MODE, 2022-2032 ($MILLION)
- TABLE 18. U.S. CRICKET ANALYSIS SOFTWARE MARKET, BY END-USER, 2022-2032 ($MILLION)
- TABLE 19. CANADA CRICKET ANALYSIS SOFTWARE MARKET, BY OFFERING, 2022-2032 ($MILLION)
- TABLE 20. CANADA CRICKET ANALYSIS SOFTWARE MARKET, BY DEPLOYMENT MODE, 2022-2032 ($MILLION)
- TABLE 21. CANADA CRICKET ANALYSIS SOFTWARE MARKET, BY END-USER, 2022-2032 ($MILLION)
- TABLE 22. EUROPE CRICKET ANALYSIS SOFTWARE MARKET, BY OFFERING, 2022-2032 ($MILLION)
- TABLE 23. EUROPE CRICKET ANALYSIS SOFTWARE MARKET, BY DEPLOYMENT MODE, 2022-2032 ($MILLION)
- TABLE 24. EUROPE CRICKET ANALYSIS SOFTWARE MARKET, BY END-USER, 2022-2032 ($MILLION)
- TABLE 25. EUROPE CRICKET ANALYSIS SOFTWARE MARKET, BY COUNTRY, 2022-2032 ($MILLION)
- TABLE 26. UK CRICKET ANALYSIS SOFTWARE MARKET, BY OFFERING, 2022-2032 ($MILLION)
- TABLE 27. UK CRICKET ANALYSIS SOFTWARE MARKET, BY DEPLOYMENT MODE, 2022-2032 ($MILLION)
- TABLE 28. UK CRICKET ANALYSIS SOFTWARE MARKET, BY END-USER, 2022-2032 ($MILLION)
- TABLE 29. GERMANY CRICKET ANALYSIS SOFTWARE MARKET, BY OFFERING, 2022-2032 ($MILLION)
- TABLE 30. GERMANY CRICKET ANALYSIS SOFTWARE MARKET, BY DEPLOYMENT MODE, 2022-2032 ($MILLION)
- TABLE 31. GERMANY CRICKET ANALYSIS SOFTWARE MARKET, BY END-USER, 2022-2032 ($MILLION)
- TABLE 32. FRANCE CRICKET ANALYSIS SOFTWARE MARKET, BY OFFERING, 2022-2032 ($MILLION)
- TABLE 33. FRANCE CRICKET ANALYSIS SOFTWARE MARKET, BY DEPLOYMENT MODE, 2022-2032 ($MILLION)
- TABLE 34. FRANCE CRICKET ANALYSIS SOFTWARE MARKET, BY END-USER, 2022-2032 ($MILLION)
- TABLE 35. ITALY CRICKET ANALYSIS SOFTWARE MARKET, BY OFFERING, 2022-2032 ($MILLION)
- TABLE 36. ITALY CRICKET ANALYSIS SOFTWARE MARKET, BY DEPLOYMENT MODE, 2022-2032 ($MILLION)
- TABLE 37. ITALY CRICKET ANALYSIS SOFTWARE MARKET, BY END-USER, 2022-2032 ($MILLION)
- TABLE 38. SPAIN CRICKET ANALYSIS SOFTWARE MARKET, BY OFFERING, 2022-2032 ($MILLION)
- TABLE 39. SPAIN CRICKET ANALYSIS SOFTWARE MARKET, BY DEPLOYMENT MODE, 2022-2032 ($MILLION)
- TABLE 40. SPAIN CRICKET ANALYSIS SOFTWARE MARKET, BY END-USER, 2022-2032 ($MILLION)
- TABLE 41. REST OF EUROPE CRICKET ANALYSIS SOFTWARE MARKET, BY OFFERING, 2022-2032 ($MILLION)
- TABLE 42. REST OF EUROPE CRICKET ANALYSIS SOFTWARE MARKET, BY DEPLOYMENT MODE, 2022-2032 ($MILLION)
- TABLE 43. REST OF EUROPE CRICKET ANALYSIS SOFTWARE MARKET, BY END-USER, 2022-2032 ($MILLION)
- TABLE 44. ASIA-PACIFIC CRICKET ANALYSIS SOFTWARE MARKET, BY OFFERING, 2022-2032 ($MILLION)
- TABLE 45. ASIA-PACIFIC CRICKET ANALYSIS SOFTWARE MARKET, BY DEPLOYMENT MODE, 2022-2032 ($MILLION)
- TABLE 46. ASIA-PACIFIC CRICKET ANALYSIS SOFTWARE MARKET, BY END-USER, 2022-2032 ($MILLION)
- TABLE 47. ASIA-PACIFIC CRICKET ANALYSIS SOFTWARE MARKET, BY COUNTRY, 2022-2032 ($MILLION)
- TABLE 48. CHINA CRICKET ANALYSIS SOFTWARE MARKET, BY OFFERING, 2022-2032 ($MILLION)
- TABLE 49. CHINA CRICKET ANALYSIS SOFTWARE MARKET, BY DEPLOYMENT MODE, 2022-2032 ($MILLION)
- TABLE 50. CHINA CRICKET ANALYSIS SOFTWARE MARKET, BY END-USER, 2022-2032 ($MILLION)
- TABLE 51. JAPAN CRICKET ANALYSIS SOFTWARE MARKET, BY OFFERING, 2022-2032 ($MILLION)
- TABLE 52. JAPAN CRICKET ANALYSIS SOFTWARE MARKET, BY DEPLOYMENT MODE, 2022-2032 ($MILLION)
- TABLE 53. JAPAN CRICKET ANALYSIS SOFTWARE MARKET, BY END-USER, 2022-2032 ($MILLION)
- TABLE 54. INDIA CRICKET ANALYSIS SOFTWARE MARKET, BY OFFERING, 2022-2032 ($MILLION)
- TABLE 55. INDIA CRICKET ANALYSIS SOFTWARE MARKET, BY DEPLOYMENT MODE, 2022-2032 ($MILLION)
- TABLE 56. INDIA CRICKET ANALYSIS SOFTWARE MARKET, BY END-USER, 2022-2032 ($MILLION)
- TABLE 57. AUSTRALIA CRICKET ANALYSIS SOFTWARE MARKET, BY OFFERING, 2022-2032 ($MILLION)
- TABLE 58. AUSTRALIA CRICKET ANALYSIS SOFTWARE MARKET, BY DEPLOYMENT MODE, 2022-2032 ($MILLION)
- TABLE 59. AUSTRALIA CRICKET ANALYSIS SOFTWARE MARKET, BY END-USER, 2022-2032 ($MILLION)
- TABLE 60. SOUTH KOREA CRICKET ANALYSIS SOFTWARE MARKET, BY OFFERING, 2022-2032 ($MILLION)
- TABLE 61. SOUTH KOREA CRICKET ANALYSIS SOFTWARE MARKET, BY DEPLOYMENT MODE, 2022-2032 ($MILLION)
- TABLE 62. SOUTH KOREA CRICKET ANALYSIS SOFTWARE MARKET, BY END-USER, 2022-2032 ($MILLION)
- TABLE 63. REST OF ASIA-PACIFIC CRICKET ANALYSIS SOFTWARE MARKET, BY OFFERING, 2022-2032 ($MILLION)
- TABLE 64. REST OF ASIA-PACIFIC CRICKET ANALYSIS SOFTWARE MARKET, BY DEPLOYMENT MODE, 2022-2032 ($MILLION)
- TABLE 65. REST OF ASIA-PACIFIC CRICKET ANALYSIS SOFTWARE MARKET, BY END-USER, 2022-2032 ($MILLION)
- TABLE 66. LAMEA CRICKET ANALYSIS SOFTWARE MARKET, BY OFFERING, 2022-2032 ($MILLION)
- TABLE 67. LAMEA CRICKET ANALYSIS SOFTWARE MARKET, BY DEPLOYMENT MODE, 2022-2032 ($MILLION)
- TABLE 68. LAMEA CRICKET ANALYSIS SOFTWARE MARKET, BY END-USER, 2022-2032 ($MILLION)
- TABLE 69. LAMEA CRICKET ANALYSIS SOFTWARE MARKET, BY COUNTRY, 2022-2032 ($MILLION)
- TABLE 70. LATIN AMERICA CRICKET ANALYSIS SOFTWARE MARKET, BY OFFERING, 2022-2032 ($MILLION)
- TABLE 71. LATIN AMERICA CRICKET ANALYSIS SOFTWARE MARKET, BY DEPLOYMENT MODE, 2022-2032 ($MILLION)
- TABLE 72. LATIN AMERICA CRICKET ANALYSIS SOFTWARE MARKET, BY END-USER, 2022-2032 ($MILLION)
- TABLE 73. MIDDLE EAST CRICKET ANALYSIS SOFTWARE MARKET, BY OFFERING, 2022-2032 ($MILLION)
- TABLE 74. MIDDLE EAST CRICKET ANALYSIS SOFTWARE MARKET, BY DEPLOYMENT MODE, 2022-2032 ($MILLION)
- TABLE 75. MIDDLE EAST CRICKET ANALYSIS SOFTWARE MARKET, BY END-USER, 2022-2032 ($MILLION)
- TABLE 76. AFRICA CRICKET ANALYSIS SOFTWARE MARKET, BY OFFERING, 2022-2032 ($MILLION)
- TABLE 77. AFRICA CRICKET ANALYSIS SOFTWARE MARKET, BY DEPLOYMENT MODE, 2022-2032 ($MILLION)
- TABLE 78. AFRICA CRICKET ANALYSIS SOFTWARE MARKET, BY END-USER, 2022-2032 ($MILLION)
- TABLE 79. SPORTSMECHANICS: KEY EXECUTIVES
- TABLE 80. SPORTSMECHANICS: COMPANY SNAPSHOT
- TABLE 81. SPORTSMECHANICS: PRODUCT SEGMENTS
- TABLE 82. SPORTSMECHANICS: PRODUCT PORTFOLIO
- TABLE 83. NACSPORT: KEY EXECUTIVES
- TABLE 84. NACSPORT: COMPANY SNAPSHOT
- TABLE 85. NACSPORT: PRODUCT SEGMENTS
- TABLE 86. NACSPORT: PRODUCT PORTFOLIO
- TABLE 87. CATAPULT SPORTS PTY LTD.: KEY EXECUTIVES
- TABLE 88. CATAPULT SPORTS PTY LTD.: COMPANY SNAPSHOT
- TABLE 89. CATAPULT SPORTS PTY LTD.: SERVICE SEGMENTS
- TABLE 90. CATAPULT SPORTS PTY LTD.: PRODUCT PORTFOLIO
- TABLE 91. CATAPULT SPORTS PTY LTD.: KEY STRATERGIES
- TABLE 92. CRICVIZ LTD.: KEY EXECUTIVES
- TABLE 93. CRICVIZ LTD.: COMPANY SNAPSHOT
- TABLE 94. CRICVIZ LTD.: PRODUCT SEGMENTS
- TABLE 95. CRICVIZ LTD.: SERVICE SEGMENTS
- TABLE 96. CRICVIZ LTD.: PRODUCT PORTFOLIO
- TABLE 97. CRICVIZ LTD.: KEY STRATERGIES
- TABLE 98. CRICKET-21: KEY EXECUTIVES
- TABLE 99. CRICKET-21: COMPANY SNAPSHOT
- TABLE 100. CRICKET-21: PRODUCT SEGMENTS
- TABLE 101. CRICKET-21: PRODUCT PORTFOLIO
- TABLE 102. IBM CORPORATION: KEY EXECUTIVES
- TABLE 103. IBM CORPORATION: COMPANY SNAPSHOT
- TABLE 104. IBM CORPORATION: PRODUCT SEGMENTS
- TABLE 105. IBM CORPORATION: PRODUCT PORTFOLIO
- TABLE 106. SAP SE: KEY EXECUTIVES
- TABLE 107. SAP SE: COMPANY SNAPSHOT
- TABLE 108. SAP SE: PRODUCT SEGMENTS
- TABLE 109. SAP SE: PRODUCT PORTFOLIO
- TABLE 110. GENIUS SPORTS GROUP: KEY EXECUTIVES
- TABLE 111. GENIUS SPORTS GROUP: COMPANY SNAPSHOT
- TABLE 112. GENIUS SPORTS GROUP: PRODUCT SEGMENTS
- TABLE 113. GENIUS SPORTS GROUP: PRODUCT PORTFOLIO
- TABLE 114. GENIUS SPORTS GROUP: KEY STRATERGIES
- TABLE 115. ORACLE CORPORATION: KEY EXECUTIVES
- TABLE 116. ORACLE CORPORATION: COMPANY SNAPSHOT
- TABLE 117. ORACLE CORPORATION: SERVICE SEGMENTS
- TABLE 118. ORACLE CORPORATION: PRODUCT PORTFOLIO
- TABLE 119. SAS INSTITUTE INC.: KEY EXECUTIVES
- TABLE 120. SAS INSTITUTE INC.: COMPANY SNAPSHOT
- TABLE 121. SAS INSTITUTE INC.: PRODUCT SEGMENTS
- TABLE 122. SAS INSTITUTE INC.: PRODUCT PORTFOLIO
LIST OF FIGURES
- FIGURE 01. CRICKET ANALYSIS SOFTWARE MARKET, 2022-2032
- FIGURE 02. SEGMENTATION OF CRICKET ANALYSIS SOFTWARE MARKET,2022-2032
- FIGURE 03. TOP IMPACTING FACTORS IN CRICKET ANALYSIS SOFTWARE MARKET (2022 TO 2032)
- FIGURE 04. TOP INVESTMENT POCKETS IN CRICKET ANALYSIS SOFTWARE MARKET (2023-2032)
- FIGURE 05. LOW BARGAINING POWER OF SUPPLIERS
- FIGURE 06. LOW THREAT OF NEW ENTRANTS
- FIGURE 07. LOW THREAT OF SUBSTITUTES
- FIGURE 08. LOW INTENSITY OF RIVALRY
- FIGURE 09. LOW BARGAINING POWER OF BUYERS
- FIGURE 10. GLOBAL CRICKET ANALYSIS SOFTWARE MARKET:DRIVERS, RESTRAINTS AND OPPORTUNITIES
- FIGURE 11. REGULATORY GUIDELINES: CRICKET ANALYSIS SOFTWARE MARKET
- FIGURE 12. CRICKET ANALYSIS SOFTWARE MARKET, BY OFFERING, 2022 AND 2032(%)
- FIGURE 13. COMPARATIVE SHARE ANALYSIS OF CRICKET ANALYSIS SOFTWARE MARKET FOR SOFTWARE, BY COUNTRY 2022 AND 2032(%)
- FIGURE 14. COMPARATIVE SHARE ANALYSIS OF CRICKET ANALYSIS SOFTWARE MARKET FOR SERVICE, BY COUNTRY 2022 AND 2032(%)
- FIGURE 15. CRICKET ANALYSIS SOFTWARE MARKET, BY DEPLOYMENT MODE, 2022 AND 2032(%)
- FIGURE 16. COMPARATIVE SHARE ANALYSIS OF CRICKET ANALYSIS SOFTWARE MARKET FOR ON-PREMISE, BY COUNTRY 2022 AND 2032(%)
- FIGURE 17. COMPARATIVE SHARE ANALYSIS OF CRICKET ANALYSIS SOFTWARE MARKET FOR CLOUD, BY COUNTRY 2022 AND 2032(%)
- FIGURE 18. CRICKET ANALYSIS SOFTWARE MARKET, BY END-USER, 2022 AND 2032(%)
- FIGURE 19. COMPARATIVE SHARE ANALYSIS OF CRICKET ANALYSIS SOFTWARE MARKET FOR SPORT ASSOCIATIONS, BY COUNTRY 2022 AND 2032(%)
- FIGURE 20. COMPARATIVE SHARE ANALYSIS OF CRICKET ANALYSIS SOFTWARE MARKET FOR COACHING INSTITUTION, BY COUNTRY 2022 AND 2032(%)
- FIGURE 21. COMPARATIVE SHARE ANALYSIS OF CRICKET ANALYSIS SOFTWARE MARKET FOR OTHERS, BY COUNTRY 2022 AND 2032(%)
- FIGURE 22. CRICKET ANALYSIS SOFTWARE MARKET BY REGION, 2022 AND 2032(%)
- FIGURE 23. U.S. CRICKET ANALYSIS SOFTWARE MARKET, 2022-2032 ($MILLION)
- FIGURE 24. CANADA CRICKET ANALYSIS SOFTWARE MARKET, 2022-2032 ($MILLION)
- FIGURE 25. UK CRICKET ANALYSIS SOFTWARE MARKET, 2022-2032 ($MILLION)
- FIGURE 26. GERMANY CRICKET ANALYSIS SOFTWARE MARKET, 2022-2032 ($MILLION)
- FIGURE 27. FRANCE CRICKET ANALYSIS SOFTWARE MARKET, 2022-2032 ($MILLION)
- FIGURE 28. ITALY CRICKET ANALYSIS SOFTWARE MARKET, 2022-2032 ($MILLION)
- FIGURE 29. SPAIN CRICKET ANALYSIS SOFTWARE MARKET, 2022-2032 ($MILLION)
- FIGURE 30. REST OF EUROPE CRICKET ANALYSIS SOFTWARE MARKET, 2022-2032 ($MILLION)
- FIGURE 31. CHINA CRICKET ANALYSIS SOFTWARE MARKET, 2022-2032 ($MILLION)
- FIGURE 32. JAPAN CRICKET ANALYSIS SOFTWARE MARKET, 2022-2032 ($MILLION)
- FIGURE 33. INDIA CRICKET ANALYSIS SOFTWARE MARKET, 2022-2032 ($MILLION)
- FIGURE 34. AUSTRALIA CRICKET ANALYSIS SOFTWARE MARKET, 2022-2032 ($MILLION)
- FIGURE 35. SOUTH KOREA CRICKET ANALYSIS SOFTWARE MARKET, 2022-2032 ($MILLION)
- FIGURE 36. REST OF ASIA-PACIFIC CRICKET ANALYSIS SOFTWARE MARKET, 2022-2032 ($MILLION)
- FIGURE 37. LATIN AMERICA CRICKET ANALYSIS SOFTWARE MARKET, 2022-2032 ($MILLION)
- FIGURE 38. MIDDLE EAST CRICKET ANALYSIS SOFTWARE MARKET, 2022-2032 ($MILLION)
- FIGURE 39. AFRICA CRICKET ANALYSIS SOFTWARE MARKET, 2022-2032 ($MILLION)
- FIGURE 40. TOP WINNING STRATEGIES, BY YEAR (2021-2023)
- FIGURE 41. TOP WINNING STRATEGIES, BY DEVELOPMENT (2021-2023)
- FIGURE 42. TOP WINNING STRATEGIES, BY COMPANY (2021-2023)
- FIGURE 43. PRODUCT MAPPING OF TOP 10 PLAYERS
- FIGURE 44. COMPETITIVE DASHBOARD
- FIGURE 45. COMPETITIVE HEATMAP: CRICKET ANALYSIS SOFTWARE MARKET
- FIGURE 46. TOP PLAYER POSITIONING, 2022
- FIGURE 47. CATAPULT: NET REVENUE, 2018-2020 ($MILLION)
- FIGURE 48. CATAPULT: REVENUE SHARE BY SEGMENT, 2020 (%)
- FIGURE 49. CATAPULT: REVENUE SHARE BY REGION, 2020 (%)
- FIGURE 50. IBM CORPORATION: NET REVENUE, 2020-2022 ($MILLION)
- FIGURE 51. IBM CORPORATION: RESEARCH & DEVELOPMENT EXPENDITURE, 2020-2022 ($MILLION)
- FIGURE 52. IBM CORPORATION: REVENUE SHARE BY SEGMENT, 2022 (%)
- FIGURE 53. IBM CORPORATION: REVENUE SHARE BY REGION, 2022 (%)
- FIGURE 54. SAP SE: NET REVENUE, 2020-2022 ($MILLION)
- FIGURE 55. SAP SE: RESEARCH & DEVELOPMENT EXPENDITURE, 2020-2022 ($MILLION)
- FIGURE 56. SAP SE: REVENUE SHARE BY SEGMENT, 2022 (%)
- FIGURE 57. SAP SE: REVENUE SHARE BY REGION, 2022 (%)
- FIGURE 58. GENIUS SPORTS GROUP: NET REVENUE, 2020-2022 ($MILLION)
- FIGURE 59. GENIUS SPORTS GROUP: REVENUE SHARE BY SEGMENT, 2022 (%)
- FIGURE 60. ORACLE CORPORATION: NET REVENUE, 2020-2022 ($MILLION)
- FIGURE 61. ORACLE CORPORATION: REVENUE SHARE BY SEGMENT, 2022 (%)
- FIGURE 62. ORACLE CORPORATION: REVENUE SHARE BY REGION, 2022 (%)
According to a new report published by Allied Market Research, titled, "Cricket Analysis Software Market," The cricket analysis software market was valued at $181.54 million in 2022, and is estimated to reach $1.2 billion by 2032, growing at a CAGR of 20.9% from 2023 to 2032.
Factors such as the increase in demand for data-driven insights in cricket coaching & strategy, and growth in emphasis on performance analysis for player development positively impacted the growth of the cricket analysis software market. In addition, advancements in technology, including ball tracking & video analysis, and the rise in popularity of T20 & other short-format cricket, have driven the need for quick and accurate decision-making. Such trends are expected to propel the growth of the cricket analysis software market during the forecast period. Furthermore, expansion of cricket leagues and tournaments globally, creating a larger market for analysis software. Moreover, collaboration opportunities between software developers and cricket boards for tailored solutions and integration of artificial intelligence (AI) and machine learning (ML) for more advanced predictive analysis are anticipated to provide lucrative growth opportunities for the cricket analysis software market growth during the forecast period. In addition, an increase in the use of analysis software in grassroots and amateur cricket for talent identification and development is also expected to create numerous opportunities for cricket analysis software market growth in the coming years. However, resistance to technology adoption in traditional cricket setups and dependence on high-quality and consistent data for accurate analysis, limit the market growth in the coming years. In additon, limited awareness, and access to sophisticated analysis tools in some cricketing regions, may also hamper the growth of the cricket analysis software market.
The cricket analysis software market is segmented into offering, deployment mode, end-user, and region. On the basis of offering, the market is bifurcated into software and service. On the basis of deployment mode, cricket analysis software market is bifurcated into on-premise and cloud. On the basis of end-user, the market is classified into sport associations, coaching institution, and others. On the basis of region, the cricket analysis software market is analyzed across North America, Europe, Asia-Pacific, and LAMEA.
The market players operating in the cricket analysis software market are SportsMechanics, Nacsport, Catapult Sports, CricViz Ltd, Cricket-21, IBM Corporation, SAP SE, Genius Sports Group, Oracle Corporation, and SAS Institute Inc. These major players have adopted various key development strategies such as business expansion, new product launches, and partnerships, which help to drive the growth of the cricket analysis software market globally.
Key Benefits for Stakeholders
- The study provides an in-depth analysis of the cricket analysis software market along with the current trends and future estimations to elucidate the imminent investment pockets.
- Information about key drivers, restrains, and opportunities and their impact analysis on the cricket analysis software market size is provided in the report.
- The Porter's five forces analysis illustrates the potency of buyers and suppliers operating in the cricket analysis software industry.
- The quantitative analysis of the global cricket analysis software market for the period 2022-2032 is provided to determine the cricket analysis software market potential.
Additional benefits you will get with this purchase are:
- Quarterly Update and* (only available with a corporate license, on listed price)
- 5 additional Company Profile of client Choice pre- or Post-purchase, as a free update.
- Free Upcoming Version on the Purchase of Five and Enterprise User License.
- 16 analyst hours of support* (post-purchase, if you find additional data requirements upon review of the report, you may receive support amounting to 16 analyst hours to solve questions, and post-sale queries)
- 15% Free Customization* (in case the scope or segment of the report does not match your requirements, 15% is equivalent to 3 working days of free work, applicable once)
- Free data Pack on the Five and Enterprise User License. (Excel version of the report)
- Free Updated report if the report is 6-12 months old or older.
- 24-hour priority response*
- Free Industry updates and white papers.
Possible Customization with this report (with additional cost and timeline, please talk to the sales executive to know more)
- Investment Opportunities
- Technology Trend Analysis
- Regulatory Guidelines
- Strategic Recommedations
- SWOT Analysis
Key Market Segments
By Offering
- Software
- Service
By Deployment Mode
- On-premise
- Cloud
By End-User
- Sport Associations
- Coaching Institution
- Others
By Region
- North America
- U.S.
- Canada
- Europe
- UK
- Germany
- France
- Italy
- Spain
- Rest of Europe
- Asia-Pacific
- China
- Japan
- India
- Australia
- South Korea
- Rest of Asia-Pacific
- LAMEA
- Latin America
- Middle East
- Africa
Key Market Players:
- IBM Corporation
- SAP SE
- SAS Institute Inc.
- Nacsport
- CricViz Ltd.
- Cricket-21
- Catapult Sports Pty Ltd.
- Oracle Corporation
- SportsMechanics
- Genius Sports Group
TABLE OF CONTENTS
CHAPTER 1: INTRODUCTION
- 1.1. Report description
- 1.2. Key market segments
- 1.3. Key benefits to the stakeholders
- 1.4. Research methodology
- 1.4.1. Primary research
- 1.4.2. Secondary research
- 1.4.3. Analyst tools and models
CHAPTER 2: EXECUTIVE SUMMARY
- 2.1. CXO Perspective
CHAPTER 3: MARKET OVERVIEW
- 3.1. Market definition and scope
- 3.2. Key findings
- 3.2.1. Top impacting factors
- 3.2.2. Top investment pockets
- 3.3. Porter's five forces analysis
- 3.3.1. Low bargaining power of suppliers
- 3.3.2. Low threat of new entrants
- 3.3.3. Low threat of substitutes
- 3.3.4. Low intensity of rivalry
- 3.3.5. Low bargaining power of buyers
- 3.4. Market dynamics
- 3.4.1. Drivers
- 3.4.1.1. Rise in popularity of T20 and other short-format cricket
- 3.4.1.2. Increase in demand for data-driven insights in cricket coaching and strategy
- 3.4.2. Restraints
- 3.4.2.1. Cost implications associated with acquiring and implementing advanced analysis software
- 3.4.3. Opportunities
- 3.4.3.1. Integration of AI and ML for more advanced predictive analysis
- 3.4.1. Drivers
- 3.5. Regulatory Guidelines
CHAPTER 4: CRICKET ANALYSIS SOFTWARE MARKET, BY OFFERING
- 4.1. Overview
- 4.1.1. Market size and forecast
- 4.2. Software
- 4.2.1. Key market trends, growth factors and opportunities
- 4.2.2. Market size and forecast, by region
- 4.2.3. Market share analysis by country
- 4.3. Service
- 4.3.1. Key market trends, growth factors and opportunities
- 4.3.2. Market size and forecast, by region
- 4.3.3. Market share analysis by country
CHAPTER 5: CRICKET ANALYSIS SOFTWARE MARKET, BY DEPLOYMENT MODE
- 5.1. Overview
- 5.1.1. Market size and forecast
- 5.2. On-premise
- 5.2.1. Key market trends, growth factors and opportunities
- 5.2.2. Market size and forecast, by region
- 5.2.3. Market share analysis by country
- 5.3. Cloud
- 5.3.1. Key market trends, growth factors and opportunities
- 5.3.2. Market size and forecast, by region
- 5.3.3. Market share analysis by country
CHAPTER 6: CRICKET ANALYSIS SOFTWARE MARKET, BY END-USER
- 6.1. Overview
- 6.1.1. Market size and forecast
- 6.2. Sport Associations
- 6.2.1. Key market trends, growth factors and opportunities
- 6.2.2. Market size and forecast, by region
- 6.2.3. Market share analysis by country
- 6.3. Coaching Institution
- 6.3.1. Key market trends, growth factors and opportunities
- 6.3.2. Market size and forecast, by region
- 6.3.3. Market share analysis by country
- 6.4. Others
- 6.4.1. Key market trends, growth factors and opportunities
- 6.4.2. Market size and forecast, by region
- 6.4.3. Market share analysis by country
CHAPTER 7: CRICKET ANALYSIS SOFTWARE MARKET, BY REGION
- 7.1. Overview
- 7.1.1. Market size and forecast By Region
- 7.2. North America
- 7.2.1. Key market trends, growth factors and opportunities
- 7.2.2. Market size and forecast, by Offering
- 7.2.3. Market size and forecast, by Deployment Mode
- 7.2.4. Market size and forecast, by End-User
- 7.2.5. Market size and forecast, by country
- 7.2.5.1. U.S.
- 7.2.5.1.1. Market size and forecast, by Offering
- 7.2.5.1.2. Market size and forecast, by Deployment Mode
- 7.2.5.1.3. Market size and forecast, by End-User
- 7.2.5.2. Canada
- 7.2.5.2.1. Market size and forecast, by Offering
- 7.2.5.2.2. Market size and forecast, by Deployment Mode
- 7.2.5.2.3. Market size and forecast, by End-User
- 7.3. Europe
- 7.3.1. Key market trends, growth factors and opportunities
- 7.3.2. Market size and forecast, by Offering
- 7.3.3. Market size and forecast, by Deployment Mode
- 7.3.4. Market size and forecast, by End-User
- 7.3.5. Market size and forecast, by country
- 7.3.5.1. UK
- 7.3.5.1.1. Market size and forecast, by Offering
- 7.3.5.1.2. Market size and forecast, by Deployment Mode
- 7.3.5.1.3. Market size and forecast, by End-User
- 7.3.5.2. Germany
- 7.3.5.2.1. Market size and forecast, by Offering
- 7.3.5.2.2. Market size and forecast, by Deployment Mode
- 7.3.5.2.3. Market size and forecast, by End-User
- 7.3.5.3. France
- 7.3.5.3.1. Market size and forecast, by Offering
- 7.3.5.3.2. Market size and forecast, by Deployment Mode
- 7.3.5.3.3. Market size and forecast, by End-User
- 7.3.5.4. Italy
- 7.3.5.4.1. Market size and forecast, by Offering
- 7.3.5.4.2. Market size and forecast, by Deployment Mode
- 7.3.5.4.3. Market size and forecast, by End-User
- 7.3.5.5. Spain
- 7.3.5.5.1. Market size and forecast, by Offering
- 7.3.5.5.2. Market size and forecast, by Deployment Mode
- 7.3.5.5.3. Market size and forecast, by End-User
- 7.3.5.6. Rest of Europe
- 7.3.5.6.1. Market size and forecast, by Offering
- 7.3.5.6.2. Market size and forecast, by Deployment Mode
- 7.3.5.6.3. Market size and forecast, by End-User
- 7.4. Asia-Pacific
- 7.4.1. Key market trends, growth factors and opportunities
- 7.4.2. Market size and forecast, by Offering
- 7.4.3. Market size and forecast, by Deployment Mode
- 7.4.4. Market size and forecast, by End-User
- 7.4.5. Market size and forecast, by country
- 7.4.5.1. China
- 7.4.5.1.1. Market size and forecast, by Offering
- 7.4.5.1.2. Market size and forecast, by Deployment Mode
- 7.4.5.1.3. Market size and forecast, by End-User
- 7.4.5.2. Japan
- 7.4.5.2.1. Market size and forecast, by Offering
- 7.4.5.2.2. Market size and forecast, by Deployment Mode
- 7.4.5.2.3. Market size and forecast, by End-User
- 7.4.5.3. India
- 7.4.5.3.1. Market size and forecast, by Offering
- 7.4.5.3.2. Market size and forecast, by Deployment Mode
- 7.4.5.3.3. Market size and forecast, by End-User
- 7.4.5.4. Australia
- 7.4.5.4.1. Market size and forecast, by Offering
- 7.4.5.4.2. Market size and forecast, by Deployment Mode
- 7.4.5.4.3. Market size and forecast, by End-User
- 7.4.5.5. South Korea
- 7.4.5.5.1. Market size and forecast, by Offering
- 7.4.5.5.2. Market size and forecast, by Deployment Mode
- 7.4.5.5.3. Market size and forecast, by End-User
- 7.4.5.6. Rest of Asia-Pacific
- 7.4.5.6.1. Market size and forecast, by Offering
- 7.4.5.6.2. Market size and forecast, by Deployment Mode
- 7.4.5.6.3. Market size and forecast, by End-User
- 7.5. LAMEA
- 7.5.1. Key market trends, growth factors and opportunities
- 7.5.2. Market size and forecast, by Offering
- 7.5.3. Market size and forecast, by Deployment Mode
- 7.5.4. Market size and forecast, by End-User
- 7.5.5. Market size and forecast, by country
- 7.5.5.1. Latin America
- 7.5.5.1.1. Market size and forecast, by Offering
- 7.5.5.1.2. Market size and forecast, by Deployment Mode
- 7.5.5.1.3. Market size and forecast, by End-User
- 7.5.5.2. Middle East
- 7.5.5.2.1. Market size and forecast, by Offering
- 7.5.5.2.2. Market size and forecast, by Deployment Mode
- 7.5.5.2.3. Market size and forecast, by End-User
- 7.5.5.3. Africa
- 7.5.5.3.1. Market size and forecast, by Offering
- 7.5.5.3.2. Market size and forecast, by Deployment Mode
- 7.5.5.3.3. Market size and forecast, by End-User
CHAPTER 8: COMPETITIVE LANDSCAPE
- 8.1. Introduction
- 8.2. Top winning strategies
- 8.3. Product mapping of top 10 player
- 8.4. Competitive dashboard
- 8.5. Competitive heatmap
- 8.6. Top player positioning, 2022
CHAPTER 9: COMPANY PROFILES
- 9.1. SportsMechanics
- 9.1.1. Company overview
- 9.1.2. Key executives
- 9.1.3. Company snapshot
- 9.1.4. Operating business segments
- 9.1.5. Product portfolio
- 9.2. Nacsport
- 9.2.1. Company overview
- 9.2.2. Key executives
- 9.2.3. Company snapshot
- 9.2.4. Operating business segments
- 9.2.5. Product portfolio
- 9.3. Catapult Sports Pty Ltd.
- 9.3.1. Company overview
- 9.3.2. Key executives
- 9.3.3. Company snapshot
- 9.3.4. Operating business segments
- 9.3.5. Product portfolio
- 9.3.6. Business performance
- 9.3.7. Key strategic moves and developments
- 9.4. CricViz Ltd.
- 9.4.1. Company overview
- 9.4.2. Key executives
- 9.4.3. Company snapshot
- 9.4.4. Operating business segments
- 9.4.5. Product portfolio
- 9.4.6. Key strategic moves and developments
- 9.5. Cricket-21
- 9.5.1. Company overview
- 9.5.2. Key executives
- 9.5.3. Company snapshot
- 9.5.4. Operating business segments
- 9.5.5. Product portfolio
- 9.6. IBM Corporation
- 9.6.1. Company overview
- 9.6.2. Key executives
- 9.6.3. Company snapshot
- 9.6.4. Operating business segments
- 9.6.5. Product portfolio
- 9.6.6. Business performance
- 9.7. SAP SE
- 9.7.1. Company overview
- 9.7.2. Key executives
- 9.7.3. Company snapshot
- 9.7.4. Operating business segments
- 9.7.5. Product portfolio
- 9.7.6. Business performance
- 9.8. Genius Sports Group
- 9.8.1. Company overview
- 9.8.2. Key executives
- 9.8.3. Company snapshot
- 9.8.4. Operating business segments
- 9.8.5. Product portfolio
- 9.8.6. Business performance
- 9.8.7. Key strategic moves and developments
- 9.9. Oracle Corporation
- 9.9.1. Company overview
- 9.9.2. Key executives
- 9.9.3. Company snapshot
- 9.9.4. Operating business segments
- 9.9.5. Product portfolio
- 9.9.6. Business performance
- 9.10. SAS Institute Inc.
- 9.10.1. Company overview
- 9.10.2. Key executives
- 9.10.3. Company snapshot
- 9.10.4. Operating business segments
- 9.10.5. Product portfolio
