 |
市場調査レポート
商品コード
1414890
データセンターセキュリティ市場:構成別、データセンタータイプ別、業界別2023年~2032年の世界機会分析と産業予測Data Center Security Market By Component, By Data Center Type, By Industry Vertical : Global Opportunity Analysis and Industry Forecast, 2023-2032 |
||||||

| データセンターセキュリティ市場:構成別、データセンタータイプ別、業界別2023年~2032年の世界機会分析と産業予測 |
|
出版日: 2023年11月30日
発行: Allied Market Research
ページ情報: 英文 290 Pages
納期: 2~3営業日
|
- 全表示
- 概要
- 図表
- 目次
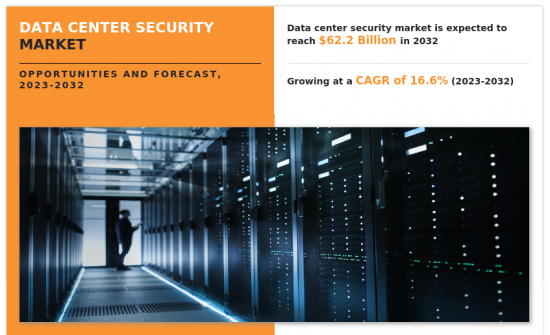
データセンターセキュリティ市場の2022年の市場規模は138億米ドルで、2023年から2032年までのCAGRは16.6%で、2032年には622億米ドルに達すると予測されています。
データセンターセキュリティ市場を牽引しているのは、デジタル情報の量と重要性の高まりであり、企業はデータ保管・処理施設の安全確保を迫られています。さらに、サイバー脅威の高まりと巧妙な攻撃の頻度増加が、高度なセキュリティ・ソリューションへの需要を後押しし、市場の成長を促進しています。さらに、厳しい規制要件やコンプライアンス基準により、強固なセキュリティ対策が義務付けられているため、データセンターセキュリティ・ソリューションの採用がさらに加速しています。ランサムウェア攻撃から巧妙な侵害に至るまで、サイバー脅威の急増に伴い、企業は機密情報の保護を優先しているため、高度なセキュリティ・ソリューションの需要が高まっています。また、厳しい規制要件やコンプライアンス基準により、包括的なセキュリティ・プロトコルが義務付けられているため、さまざまな業界でデータセンターセキュリティ・ソリューションの導入が促進されています。また、データ漏洩による金銭的損害や風評被害に対する意識の高まりは、企業が最先端のセキュリティ技術に投資する動機付けとなっており、効果的なデータセンターセキュリティ・ソリューションに対する市場の需要が持続的に拡大しています。しかし、包括的なセキュリティ・インフラの導入に伴う初期投資の高さや、継続的な更新とセキュリティ技術への投資を必要とするサイバー脅威の進化が、市場の成長を妨げると予想されます。逆に、技術開拓と高度なアルゴリズムとの統合は、今後数年間で市場を押し上げると予想されます。さらに、クラウド・コンピューティングの採用拡大やデータセンター施設の世界の拡張は、市場プレーヤーに活路をもたらします。企業がデータ保護を優先する中、データセンターセキュリティ市場は、セキュリティ課題への対応と新たなビジネスチャンスへの資本投入の微妙なバランスにより、引き続きダイナミックな動きを見せています。
目次
第1章 イントロダクション
第2章 エグゼクティブサマリー
第3章 市場概要
- 市場の定義と範囲
- 主な調査結果
- 影響要因
- 主な投資機会
- ポーターのファイブフォース分析
- 市場力学
- 促進要因
- サイバーセキュリティの脅威の高まり
- クラウドの採用拡大
- ユーザーデータ量の増加
- 抑制要因
- 導入コストの高さ
- 熟練労働者の不足
- 機会
- 技術の進歩
- 促進要因
第4章 データセンターセキュリティ市場:構成別
- 概要
- ソリューション
- サービス
第5章 データセンターセキュリティ市場:データセンタータイプ別
- 概要
- 小規模データセンター
- 中規模データセンター
- 大規模データセンター
第6章 データセンターセキュリティ市場:業界別
- 概要
- BFSI
- ITおよび電気通信
- ヘルスケア
- 小売・eコマース
- メディア・エンターテイメント
- 政府機関
- その他
第7章 データセンターセキュリティ市場:地域別
- 概要
- 北米
- 米国
- カナダ
- 欧州
- 英国
- ドイツ
- フランス
- イタリア
- スペイン
- その他
- アジア太平洋
- 中国
- 日本
- インド
- オーストラリア
- 韓国
- その他
- ラテンアメリカ
- ラテンアメリカ
- 中東
- アフリカ
第8章 競合情勢
- イントロダクション
- 主要成功戦略
- 主要10社の製品マッピング
- 競合ダッシュボード
- 競合ヒートマップ
- 主要企業のポジショニング、2022年
第9章 企業プロファイル
- Cisco Systems, Inc.
- IBM Corporation
- Broadcom
- Dell Inc.
- Siemens
- Schneider Electric
- Juniper Networks, Inc.
- Fortinet, Inc.
- Honeywell International Inc.
- Palo Alto Networks, Inc.
LIST OF TABLES
- TABLE 01. GLOBAL DATA CENTER SECURITY MARKET, BY COMPONENT, 2022-2032 ($MILLION)
- TABLE 02. DATA CENTER SECURITY MARKET FOR SOLUTION, BY REGION, 2022-2032 ($MILLION)
- TABLE 03. DATA CENTER SECURITY MARKET FOR SERVICE, BY REGION, 2022-2032 ($MILLION)
- TABLE 04. GLOBAL DATA CENTER SECURITY MARKET, BY DATA CENTER TYPE, 2022-2032 ($MILLION)
- TABLE 05. DATA CENTER SECURITY MARKET FOR SMALL DATA CENTER, BY REGION, 2022-2032 ($MILLION)
- TABLE 06. DATA CENTER SECURITY MARKET FOR MEDIUM DATA CENTER, BY REGION, 2022-2032 ($MILLION)
- TABLE 07. DATA CENTER SECURITY MARKET FOR LARGE DATA CENTER, BY REGION, 2022-2032 ($MILLION)
- TABLE 08. GLOBAL DATA CENTER SECURITY MARKET, BY INDUSTRY VERTICAL, 2022-2032 ($MILLION)
- TABLE 09. DATA CENTER SECURITY MARKET FOR BFSI, BY REGION, 2022-2032 ($MILLION)
- TABLE 10. DATA CENTER SECURITY MARKET FOR IT AND TELECOM, BY REGION, 2022-2032 ($MILLION)
- TABLE 11. DATA CENTER SECURITY MARKET FOR HEALTHCARE, BY REGION, 2022-2032 ($MILLION)
- TABLE 12. DATA CENTER SECURITY MARKET FOR RETAIL AND E-COMMERCE, BY REGION, 2022-2032 ($MILLION)
- TABLE 13. DATA CENTER SECURITY MARKET FOR MEDIA AND ENTERTAINMENT, BY REGION, 2022-2032 ($MILLION)
- TABLE 14. DATA CENTER SECURITY MARKET FOR GOVERNMENT, BY REGION, 2022-2032 ($MILLION)
- TABLE 15. DATA CENTER SECURITY MARKET FOR OTHERS, BY REGION, 2022-2032 ($MILLION)
- TABLE 16. DATA CENTER SECURITY MARKET, BY REGION, 2022-2032 ($MILLION)
- TABLE 17. NORTH AMERICA DATA CENTER SECURITY MARKET, BY COMPONENT, 2022-2032 ($MILLION)
- TABLE 18. NORTH AMERICA DATA CENTER SECURITY MARKET, BY DATA CENTER TYPE, 2022-2032 ($MILLION)
- TABLE 19. NORTH AMERICA DATA CENTER SECURITY MARKET, BY INDUSTRY VERTICAL, 2022-2032 ($MILLION)
- TABLE 20. NORTH AMERICA DATA CENTER SECURITY MARKET, BY COUNTRY, 2022-2032 ($MILLION)
- TABLE 21. U.S. DATA CENTER SECURITY MARKET, BY COMPONENT, 2022-2032 ($MILLION)
- TABLE 22. U.S. DATA CENTER SECURITY MARKET, BY DATA CENTER TYPE, 2022-2032 ($MILLION)
- TABLE 23. U.S. DATA CENTER SECURITY MARKET, BY INDUSTRY VERTICAL, 2022-2032 ($MILLION)
- TABLE 24. CANADA DATA CENTER SECURITY MARKET, BY COMPONENT, 2022-2032 ($MILLION)
- TABLE 25. CANADA DATA CENTER SECURITY MARKET, BY DATA CENTER TYPE, 2022-2032 ($MILLION)
- TABLE 26. CANADA DATA CENTER SECURITY MARKET, BY INDUSTRY VERTICAL, 2022-2032 ($MILLION)
- TABLE 27. EUROPE DATA CENTER SECURITY MARKET, BY COMPONENT, 2022-2032 ($MILLION)
- TABLE 28. EUROPE DATA CENTER SECURITY MARKET, BY DATA CENTER TYPE, 2022-2032 ($MILLION)
- TABLE 29. EUROPE DATA CENTER SECURITY MARKET, BY INDUSTRY VERTICAL, 2022-2032 ($MILLION)
- TABLE 30. EUROPE DATA CENTER SECURITY MARKET, BY COUNTRY, 2022-2032 ($MILLION)
- TABLE 31. UK DATA CENTER SECURITY MARKET, BY COMPONENT, 2022-2032 ($MILLION)
- TABLE 32. UK DATA CENTER SECURITY MARKET, BY DATA CENTER TYPE, 2022-2032 ($MILLION)
- TABLE 33. UK DATA CENTER SECURITY MARKET, BY INDUSTRY VERTICAL, 2022-2032 ($MILLION)
- TABLE 34. GERMANY DATA CENTER SECURITY MARKET, BY COMPONENT, 2022-2032 ($MILLION)
- TABLE 35. GERMANY DATA CENTER SECURITY MARKET, BY DATA CENTER TYPE, 2022-2032 ($MILLION)
- TABLE 36. GERMANY DATA CENTER SECURITY MARKET, BY INDUSTRY VERTICAL, 2022-2032 ($MILLION)
- TABLE 37. FRANCE DATA CENTER SECURITY MARKET, BY COMPONENT, 2022-2032 ($MILLION)
- TABLE 38. FRANCE DATA CENTER SECURITY MARKET, BY DATA CENTER TYPE, 2022-2032 ($MILLION)
- TABLE 39. FRANCE DATA CENTER SECURITY MARKET, BY INDUSTRY VERTICAL, 2022-2032 ($MILLION)
- TABLE 40. ITALY DATA CENTER SECURITY MARKET, BY COMPONENT, 2022-2032 ($MILLION)
- TABLE 41. ITALY DATA CENTER SECURITY MARKET, BY DATA CENTER TYPE, 2022-2032 ($MILLION)
- TABLE 42. ITALY DATA CENTER SECURITY MARKET, BY INDUSTRY VERTICAL, 2022-2032 ($MILLION)
- TABLE 43. SPAIN DATA CENTER SECURITY MARKET, BY COMPONENT, 2022-2032 ($MILLION)
- TABLE 44. SPAIN DATA CENTER SECURITY MARKET, BY DATA CENTER TYPE, 2022-2032 ($MILLION)
- TABLE 45. SPAIN DATA CENTER SECURITY MARKET, BY INDUSTRY VERTICAL, 2022-2032 ($MILLION)
- TABLE 46. REST OF EUROPE DATA CENTER SECURITY MARKET, BY COMPONENT, 2022-2032 ($MILLION)
- TABLE 47. REST OF EUROPE DATA CENTER SECURITY MARKET, BY DATA CENTER TYPE, 2022-2032 ($MILLION)
- TABLE 48. REST OF EUROPE DATA CENTER SECURITY MARKET, BY INDUSTRY VERTICAL, 2022-2032 ($MILLION)
- TABLE 49. ASIA-PACIFIC DATA CENTER SECURITY MARKET, BY COMPONENT, 2022-2032 ($MILLION)
- TABLE 50. ASIA-PACIFIC DATA CENTER SECURITY MARKET, BY DATA CENTER TYPE, 2022-2032 ($MILLION)
- TABLE 51. ASIA-PACIFIC DATA CENTER SECURITY MARKET, BY INDUSTRY VERTICAL, 2022-2032 ($MILLION)
- TABLE 52. ASIA-PACIFIC DATA CENTER SECURITY MARKET, BY COUNTRY, 2022-2032 ($MILLION)
- TABLE 53. CHINA DATA CENTER SECURITY MARKET, BY COMPONENT, 2022-2032 ($MILLION)
- TABLE 54. CHINA DATA CENTER SECURITY MARKET, BY DATA CENTER TYPE, 2022-2032 ($MILLION)
- TABLE 55. CHINA DATA CENTER SECURITY MARKET, BY INDUSTRY VERTICAL, 2022-2032 ($MILLION)
- TABLE 56. JAPAN DATA CENTER SECURITY MARKET, BY COMPONENT, 2022-2032 ($MILLION)
- TABLE 57. JAPAN DATA CENTER SECURITY MARKET, BY DATA CENTER TYPE, 2022-2032 ($MILLION)
- TABLE 58. JAPAN DATA CENTER SECURITY MARKET, BY INDUSTRY VERTICAL, 2022-2032 ($MILLION)
- TABLE 59. INDIA DATA CENTER SECURITY MARKET, BY COMPONENT, 2022-2032 ($MILLION)
- TABLE 60. INDIA DATA CENTER SECURITY MARKET, BY DATA CENTER TYPE, 2022-2032 ($MILLION)
- TABLE 61. INDIA DATA CENTER SECURITY MARKET, BY INDUSTRY VERTICAL, 2022-2032 ($MILLION)
- TABLE 62. AUSTRALIA DATA CENTER SECURITY MARKET, BY COMPONENT, 2022-2032 ($MILLION)
- TABLE 63. AUSTRALIA DATA CENTER SECURITY MARKET, BY DATA CENTER TYPE, 2022-2032 ($MILLION)
- TABLE 64. AUSTRALIA DATA CENTER SECURITY MARKET, BY INDUSTRY VERTICAL, 2022-2032 ($MILLION)
- TABLE 65. SOUTH KOREA DATA CENTER SECURITY MARKET, BY COMPONENT, 2022-2032 ($MILLION)
- TABLE 66. SOUTH KOREA DATA CENTER SECURITY MARKET, BY DATA CENTER TYPE, 2022-2032 ($MILLION)
- TABLE 67. SOUTH KOREA DATA CENTER SECURITY MARKET, BY INDUSTRY VERTICAL, 2022-2032 ($MILLION)
- TABLE 68. REST OF ASIA-PACIFIC DATA CENTER SECURITY MARKET, BY COMPONENT, 2022-2032 ($MILLION)
- TABLE 69. REST OF ASIA-PACIFIC DATA CENTER SECURITY MARKET, BY DATA CENTER TYPE, 2022-2032 ($MILLION)
- TABLE 70. REST OF ASIA-PACIFIC DATA CENTER SECURITY MARKET, BY INDUSTRY VERTICAL, 2022-2032 ($MILLION)
- TABLE 71. LAMEA DATA CENTER SECURITY MARKET, BY COMPONENT, 2022-2032 ($MILLION)
- TABLE 72. LAMEA DATA CENTER SECURITY MARKET, BY DATA CENTER TYPE, 2022-2032 ($MILLION)
- TABLE 73. LAMEA DATA CENTER SECURITY MARKET, BY INDUSTRY VERTICAL, 2022-2032 ($MILLION)
- TABLE 74. LAMEA DATA CENTER SECURITY MARKET, BY COUNTRY, 2022-2032 ($MILLION)
- TABLE 75. LATIN AMERICA DATA CENTER SECURITY MARKET, BY COMPONENT, 2022-2032 ($MILLION)
- TABLE 76. LATIN AMERICA DATA CENTER SECURITY MARKET, BY DATA CENTER TYPE, 2022-2032 ($MILLION)
- TABLE 77. LATIN AMERICA DATA CENTER SECURITY MARKET, BY INDUSTRY VERTICAL, 2022-2032 ($MILLION)
- TABLE 78. MIDDLE EAST DATA CENTER SECURITY MARKET, BY COMPONENT, 2022-2032 ($MILLION)
- TABLE 79. MIDDLE EAST DATA CENTER SECURITY MARKET, BY DATA CENTER TYPE, 2022-2032 ($MILLION)
- TABLE 80. MIDDLE EAST DATA CENTER SECURITY MARKET, BY INDUSTRY VERTICAL, 2022-2032 ($MILLION)
- TABLE 81. AFRICA DATA CENTER SECURITY MARKET, BY COMPONENT, 2022-2032 ($MILLION)
- TABLE 82. AFRICA DATA CENTER SECURITY MARKET, BY DATA CENTER TYPE, 2022-2032 ($MILLION)
- TABLE 83. AFRICA DATA CENTER SECURITY MARKET, BY INDUSTRY VERTICAL, 2022-2032 ($MILLION)
- TABLE 84. CISCO SYSTEMS, INC.: KEY EXECUTIVES
- TABLE 85. CISCO SYSTEMS, INC.: COMPANY SNAPSHOT
- TABLE 86. CISCO SYSTEMS, INC.: SERVICE SEGMENTS
- TABLE 87. CISCO SYSTEMS, INC.: PRODUCT PORTFOLIO
- TABLE 88. CISCO SYSTEMS, INC.: KEY STRATERGIES
- TABLE 89. IBM CORPORATION: KEY EXECUTIVES
- TABLE 90. IBM CORPORATION: COMPANY SNAPSHOT
- TABLE 91. IBM CORPORATION: SERVICE SEGMENTS
- TABLE 92. IBM CORPORATION: PRODUCT PORTFOLIO
- TABLE 93. IBM CORPORATION: KEY STRATERGIES
- TABLE 94. BROADCOM: KEY EXECUTIVES
- TABLE 95. BROADCOM: COMPANY SNAPSHOT
- TABLE 96. BROADCOM: PRODUCT SEGMENTS
- TABLE 97. BROADCOM: PRODUCT PORTFOLIO
- TABLE 98. BROADCOM: KEY STRATERGIES
- TABLE 99. DELL INC.: KEY EXECUTIVES
- TABLE 100. DELL INC.: COMPANY SNAPSHOT
- TABLE 101. DELL INC.: SERVICE SEGMENTS
- TABLE 102. DELL INC.: PRODUCT PORTFOLIO
- TABLE 103. DELL INC.: KEY STRATERGIES
- TABLE 104. SIEMENS: KEY EXECUTIVES
- TABLE 105. SIEMENS: COMPANY SNAPSHOT
- TABLE 106. SIEMENS: PRODUCT SEGMENTS
- TABLE 107. SIEMENS: PRODUCT PORTFOLIO
- TABLE 108. SCHNEIDER ELECTRIC: KEY EXECUTIVES
- TABLE 109. SCHNEIDER ELECTRIC: COMPANY SNAPSHOT
- TABLE 110. SCHNEIDER ELECTRIC: PRODUCT SEGMENTS
- TABLE 111. SCHNEIDER ELECTRIC: PRODUCT PORTFOLIO
- TABLE 112. SCHNEIDER ELECTRIC: KEY STRATERGIES
- TABLE 113. JUNIPER NETWORKS, INC.: KEY EXECUTIVES
- TABLE 114. JUNIPER NETWORKS, INC.: COMPANY SNAPSHOT
- TABLE 115. JUNIPER NETWORKS, INC.: PRODUCT SEGMENTS
- TABLE 116. JUNIPER NETWORKS, INC.: PRODUCT PORTFOLIO
- TABLE 117. JUNIPER NETWORKS, INC.: KEY STRATERGIES
- TABLE 118. FORTINET, INC.: KEY EXECUTIVES
- TABLE 119. FORTINET, INC.: COMPANY SNAPSHOT
- TABLE 120. FORTINET, INC.: SERVICE SEGMENTS
- TABLE 121. FORTINET, INC.: PRODUCT PORTFOLIO
- TABLE 122. FORTINET, INC.: KEY STRATERGIES
- TABLE 123. HONEYWELL INTERNATIONAL INC.: KEY EXECUTIVES
- TABLE 124. HONEYWELL INTERNATIONAL INC.: COMPANY SNAPSHOT
- TABLE 125. HONEYWELL INTERNATIONAL INC.: PRODUCT SEGMENTS
- TABLE 126. HONEYWELL INTERNATIONAL INC.: PRODUCT PORTFOLIO
- TABLE 127. HONEYWELL INTERNATIONAL INC.: KEY STRATERGIES
- TABLE 128. PALO ALTO NETWORKS, INC.: KEY EXECUTIVES
- TABLE 129. PALO ALTO NETWORKS, INC.: COMPANY SNAPSHOT
- TABLE 130. PALO ALTO NETWORKS, INC.: SERVICE SEGMENTS
- TABLE 131. PALO ALTO NETWORKS, INC.: PRODUCT PORTFOLIO
LIST OF FIGURES
- FIGURE 01. DATA CENTER SECURITY MARKET, 2022-2032
- FIGURE 02. SEGMENTATION OF DATA CENTER SECURITY MARKET,2022-2032
- FIGURE 03. TOP IMPACTING FACTORS IN DATA CENTER SECURITY MARKET (2022 TO 2032)
- FIGURE 04. TOP INVESTMENT POCKETS IN DATA CENTER SECURITY MARKET (2023-2032)
- FIGURE 05. LOW BARGAINING POWER OF SUPPLIERS
- FIGURE 06. LOW THREAT OF NEW ENTRANTS
- FIGURE 07. LOW THREAT OF SUBSTITUTES
- FIGURE 08. LOW INTENSITY OF RIVALRY
- FIGURE 09. LOW BARGAINING POWER OF BUYERS
- FIGURE 10. GLOBAL DATA CENTER SECURITY MARKET:DRIVERS, RESTRAINTS AND OPPORTUNITIES
- FIGURE 11. DATA CENTER SECURITY MARKET, BY COMPONENT, 2022 AND 2032(%)
- FIGURE 12. COMPARATIVE SHARE ANALYSIS OF DATA CENTER SECURITY MARKET FOR SOLUTION, BY COUNTRY 2022 AND 2032(%)
- FIGURE 13. COMPARATIVE SHARE ANALYSIS OF DATA CENTER SECURITY MARKET FOR SERVICE, BY COUNTRY 2022 AND 2032(%)
- FIGURE 14. DATA CENTER SECURITY MARKET, BY DATA CENTER TYPE, 2022 AND 2032(%)
- FIGURE 15. COMPARATIVE SHARE ANALYSIS OF DATA CENTER SECURITY MARKET FOR SMALL DATA CENTER, BY COUNTRY 2022 AND 2032(%)
- FIGURE 16. COMPARATIVE SHARE ANALYSIS OF DATA CENTER SECURITY MARKET FOR MEDIUM DATA CENTER, BY COUNTRY 2022 AND 2032(%)
- FIGURE 17. COMPARATIVE SHARE ANALYSIS OF DATA CENTER SECURITY MARKET FOR LARGE DATA CENTER, BY COUNTRY 2022 AND 2032(%)
- FIGURE 18. DATA CENTER SECURITY MARKET, BY INDUSTRY VERTICAL, 2022 AND 2032(%)
- FIGURE 19. COMPARATIVE SHARE ANALYSIS OF DATA CENTER SECURITY MARKET FOR BFSI, BY COUNTRY 2022 AND 2032(%)
- FIGURE 20. COMPARATIVE SHARE ANALYSIS OF DATA CENTER SECURITY MARKET FOR IT AND TELECOM, BY COUNTRY 2022 AND 2032(%)
- FIGURE 21. COMPARATIVE SHARE ANALYSIS OF DATA CENTER SECURITY MARKET FOR HEALTHCARE, BY COUNTRY 2022 AND 2032(%)
- FIGURE 22. COMPARATIVE SHARE ANALYSIS OF DATA CENTER SECURITY MARKET FOR RETAIL AND E-COMMERCE, BY COUNTRY 2022 AND 2032(%)
- FIGURE 23. COMPARATIVE SHARE ANALYSIS OF DATA CENTER SECURITY MARKET FOR MEDIA AND ENTERTAINMENT, BY COUNTRY 2022 AND 2032(%)
- FIGURE 24. COMPARATIVE SHARE ANALYSIS OF DATA CENTER SECURITY MARKET FOR GOVERNMENT, BY COUNTRY 2022 AND 2032(%)
- FIGURE 25. COMPARATIVE SHARE ANALYSIS OF DATA CENTER SECURITY MARKET FOR OTHERS, BY COUNTRY 2022 AND 2032(%)
- FIGURE 26. DATA CENTER SECURITY MARKET BY REGION, 2022 AND 2032(%)
- FIGURE 27. U.S. DATA CENTER SECURITY MARKET, 2022-2032 ($MILLION)
- FIGURE 28. CANADA DATA CENTER SECURITY MARKET, 2022-2032 ($MILLION)
- FIGURE 29. UK DATA CENTER SECURITY MARKET, 2022-2032 ($MILLION)
- FIGURE 30. GERMANY DATA CENTER SECURITY MARKET, 2022-2032 ($MILLION)
- FIGURE 31. FRANCE DATA CENTER SECURITY MARKET, 2022-2032 ($MILLION)
- FIGURE 32. ITALY DATA CENTER SECURITY MARKET, 2022-2032 ($MILLION)
- FIGURE 33. SPAIN DATA CENTER SECURITY MARKET, 2022-2032 ($MILLION)
- FIGURE 34. REST OF EUROPE DATA CENTER SECURITY MARKET, 2022-2032 ($MILLION)
- FIGURE 35. CHINA DATA CENTER SECURITY MARKET, 2022-2032 ($MILLION)
- FIGURE 36. JAPAN DATA CENTER SECURITY MARKET, 2022-2032 ($MILLION)
- FIGURE 37. INDIA DATA CENTER SECURITY MARKET, 2022-2032 ($MILLION)
- FIGURE 38. AUSTRALIA DATA CENTER SECURITY MARKET, 2022-2032 ($MILLION)
- FIGURE 39. SOUTH KOREA DATA CENTER SECURITY MARKET, 2022-2032 ($MILLION)
- FIGURE 40. REST OF ASIA-PACIFIC DATA CENTER SECURITY MARKET, 2022-2032 ($MILLION)
- FIGURE 41. LATIN AMERICA DATA CENTER SECURITY MARKET, 2022-2032 ($MILLION)
- FIGURE 42. MIDDLE EAST DATA CENTER SECURITY MARKET, 2022-2032 ($MILLION)
- FIGURE 43. AFRICA DATA CENTER SECURITY MARKET, 2022-2032 ($MILLION)
- FIGURE 44. TOP WINNING STRATEGIES, BY YEAR (2022-2023)
- FIGURE 45. TOP WINNING STRATEGIES, BY DEVELOPMENT (2022-2023)
- FIGURE 46. TOP WINNING STRATEGIES, BY COMPANY (2022-2023)
- FIGURE 47. PRODUCT MAPPING OF TOP 10 PLAYERS
- FIGURE 48. COMPETITIVE DASHBOARD
- FIGURE 49. COMPETITIVE HEATMAP: DATA CENTER SECURITY MARKET
- FIGURE 50. TOP PLAYER POSITIONING, 2022
- FIGURE 51. CISCO SYSTEMS, INC.: NET REVENUE, 2021-2023 ($MILLION)
- FIGURE 52. CISCO SYSTEMS, INC.: RESEARCH & DEVELOPMENT EXPENDITURE, 2021-2023 ($MILLION)
- FIGURE 53. CISCO SYSTEMS, INC.: REVENUE SHARE BY SEGMENT, 2023 (%)
- FIGURE 54. CISCO SYSTEMS, INC.: REVENUE SHARE BY SEGMENT, 2023 (%)
- FIGURE 55. IBM CORPORATION: NET REVENUE, 2020-2022 ($MILLION)
- FIGURE 56. IBM CORPORATION: RESEARCH & DEVELOPMENT EXPENDITURE, 2020-2022 ($MILLION)
- FIGURE 57. IBM CORPORATION: REVENUE SHARE BY SEGMENT, 2022 (%)
- FIGURE 58. IBM CORPORATION: REVENUE SHARE BY REGION, 2022 (%)
- FIGURE 59. BROADCOM: NET SALES, 2020-2022 ($MILLION)
- FIGURE 60. BROADCOM: RESEARCH & DEVELOPMENT EXPENDITURE, 2020-2022 ($MILLION)
- FIGURE 61. BROADCOM: REVENUE SHARE BY SEGMENT, 2022 (%)
- FIGURE 62. BROADCOM: REVENUE SHARE BY REGION, 2022 (%)
- FIGURE 63. DELL INC.: NET REVENUE, 2020-2022 ($MILLION)
- FIGURE 64. DELL INC.: RESEARCH & DEVELOPMENT EXPENDITURE, 2020-2022 ($MILLION)
- FIGURE 65. DELL INC.: REVENUE SHARE BY SEGMENT, 2022 (%)
- FIGURE 66. DELL INC.: REVENUE SHARE BY REGION, 2022 (%)
- FIGURE 67. SIEMENS: NET REVENUE, 2021-2023 ($MILLION)
- FIGURE 68. SIEMENS: RESEARCH & DEVELOPMENT EXPENDITURE, 2021-2023 ($MILLION)
- FIGURE 69. SIEMENS: REVENUE SHARE BY SEGMENT, 2023 (%)
- FIGURE 70. SIEMENS: REVENUE SHARE BY REGION, 2022 (%)
- FIGURE 71. SCHNEIDER ELECTRIC: NET REVENUE, 2020-2022 ($MILLION)
- FIGURE 72. SCHNEIDER ELECTRIC: RESEARCH & DEVELOPMENT EXPENDITURE, 2020-2022 ($MILLION)
- FIGURE 73. SCHNEIDER ELECTRIC: REVENUE SHARE BY SEGMENT, 2022 (%)
- FIGURE 74. SCHNEIDER ELECTRIC: REVENUE SHARE BY REGION, 2022 (%)
- FIGURE 75. JUNIPER NETWORKS, INC.: NET REVENUE, 2020-2022 ($MILLION)
- FIGURE 76. JUNIPER NETWORKS, INC.: RESEARCH & DEVELOPMENT EXPENDITURE, 2020-2022 ($MILLION)
- FIGURE 77. JUNIPER NETWORKS, INC.: REVENUE SHARE BY REGION, 2022 (%)
- FIGURE 78. FORTINET, INC.: NET REVENUE, 2020-2022 ($MILLION)
- FIGURE 79. FORTINET, INC.: RESEARCH & DEVELOPMENT EXPENDITURE, 2020-2022 ($MILLION)
- FIGURE 80. FORTINET, INC.: REVENUE SHARE BY REGION, 2022 (%)
- FIGURE 81. FORTINET, INC.: REVENUE SHARE BY SEGMENT, 2022 (%)
- FIGURE 82. HONEYWELL INTERNATIONAL INC.: RESEARCH & DEVELOPMENT EXPENDITURE, 2020-2022 ($MILLION)
- FIGURE 83. HONEYWELL INTERNATIONAL INC.: NET SALES, 2020-2022 ($MILLION)
- FIGURE 84. HONEYWELL INTERNATIONAL INC.: REVENUE SHARE BY SEGMENT, 2022 (%)
- FIGURE 85. HONEYWELL INTERNATIONAL INC.: REVENUE SHARE BY REGION, 2021 (%)
- FIGURE 86. PALO ALTO NETWORKS, INC.: NET REVENUE, 2020-2022 ($MILLION)
- FIGURE 87. PALO ALTO NETWORKS, INC.: REVENUE SHARE BY REGION, 2022 (%)
According to a new report published by Allied Market Research, titled, "Data Center Security Market," The data center security market was valued at $13.8 billion in 2022, and is estimated to reach $62.2 billion by 2032, growing at a CAGR of 16.6% from 2023 to 2032.
The data center security market is driven by the rising volume and significance of digital information, compelling organizations to secure their data storage and processing facilities. Further, rising cyber threats and the increasing frequency of sophisticated attacks propel the demand for advanced security solutions, driving the market growth. Furthermore, stringent regulatory requirements and compliance standards mandate robust security measures, further fueling the adoption of data center security solutions. With the surge in cyber threats, ranging from ransomware attacks to sophisticated breaches, organizations prioritize safeguarding their sensitive information, thus driving the demand for advanced security solutions. In addition, stringent regulatory requirements and compliance standards mandate comprehensive security protocols, fostering the adoption of data center security solutions across various industries. The rising awareness of the potential financial and reputational damage resulting from data breaches further incentivizes organizations to invest in state-of-the-art security technologies, creating a persistent and growing market demand for effective data center security solutions. However, the high initial investment associated with implementing comprehensive security infrastructure and the evolving nature of cyber threats requiring continuous updates and investments in security technologies are expected to hamper the growth of the market. On the contrary, the technological development and integration with advance algorithms is expected to boost the market in coming years. Moreover, the growing adoption of cloud computing and the expansion of data center facilities globally create avenues for market players. As organizations prioritize data protection, the data center security market remains dynamic, driven by a delicate balance between addressing security challenges and capitalizing on emerging opportunities.
The data center security market is segmented on the component, data center type, industry vertical and region. On the basis of component, it is categorized into solution and service. On the basis of data center type, it is classified into small data center, medium data center, and large data center. Based on industry vertical, the market is divided into BFSI, IT & telecom, healthcare, retail and e-commerce, media and entertainment, government, and others. On the basis of region, it is analyzed across North America, Europe, Asia-Pacific, and LAMEA.
The report analyzes the profiles of key players operating in the data center security market such as
1) Cisco Systems, Inc., IBM, Broadcom, Dell Inc., Siemens, Schneider Electric, Juniper Networks, Inc., Fortinet, Inc., Honeywell International Inc., and Palo Alto Networks. These players have adopted various strategies to increase their market penetration and strengthen their position in the data center security industry.
Key Benefits for Stakeholders
- The study provides in-depth analysis of the global data center security market along with the current & future trends to illustrate the imminent investment pockets.
- Information about key drivers, restrains, & opportunities and their impact analysis on the global data center security market size are provided in the report.
- Porter's five forces analysis illustrates the potency of buyers and suppliers operating in the industry.
- The quantitative analysis of the global data center security market from 2022 to 2032 is provided to determine the market potential.
Additional benefits you will get with this purchase are:
- Quarterly Update and* (only available with a corporate license, on listed price)
- 5 additional Company Profile of client Choice pre- or Post-purchase, as a free update.
- Free Upcoming Version on the Purchase of Five and Enterprise User License.
- 16 analyst hours of support* (post-purchase, if you find additional data requirements upon review of the report, you may receive support amounting to 16 analyst hours to solve questions, and post-sale queries)
- 15% Free Customization* (in case the scope or segment of the report does not match your requirements, 15% is equivalent to 3 working days of free work, applicable once)
- Free data Pack on the Five and Enterprise User License. (Excel version of the report)
- Free Updated report if the report is 6-12 months old or older.
- 24-hour priority response*
- Free Industry updates and white papers.
Possible Customization with this report (with additional cost and timeline, please talk to the sales executive to know more)
- Investment Opportunities
- Upcoming/New Entrant by Regions
- Market share analysis of players by products/segments
- Regulatory Guidelines
- Additional company profiles with specific to client's interest
- Additional country or region analysis- market size and forecast
- Key player details (including location, contact details, supplier/vendor network etc. in excel format)
- Market share analysis of players at global/region/country level
- SWOT Analysis
Key Market Segments
By Component
- Solution
- Service
By Data Center Type
- Small Data Center
- Medium Data Center
- Large Data Center
By Industry Vertical
- BFSI
- IT and Telecom
- Healthcare
- Retail and E-commerce
- Media and Entertainment
- Government
- Others
By Region
- North America
- U.S.
- Canada
- Europe
- UK
- Germany
- France
- Italy
- Spain
- Rest of Europe
- Asia-Pacific
- China
- Japan
- India
- Australia
- South Korea
- Rest of Asia-Pacific
- LAMEA
- Latin America
- Middle East
- Africa
Key Market Players:
- IBM Corporation
- Dell Inc.
- Schneider Electric
- Fortinet, Inc.
- Palo Alto Networks, Inc.
- Siemens
- Broadcom
- Juniper Networks, Inc.
- Honeywell International Inc.
- Cisco Systems, Inc.
TABLE OF CONTENTS
CHAPTER 1: INTRODUCTION
- 1.1. Report description
- 1.2. Key market segments
- 1.3. Key benefits to the stakeholders
- 1.4. Research methodology
- 1.4.1. Primary research
- 1.4.2. Secondary research
- 1.4.3. Analyst tools and models
CHAPTER 2: EXECUTIVE SUMMARY
- 2.1. CXO Perspective
CHAPTER 3: MARKET OVERVIEW
- 3.1. Market definition and scope
- 3.2. Key findings
- 3.2.1. Top impacting factors
- 3.2.2. Top investment pockets
- 3.3. Porter's five forces analysis
- 3.3.1. Low bargaining power of suppliers
- 3.3.2. Low threat of new entrants
- 3.3.3. Low threat of substitutes
- 3.3.4. Low intensity of rivalry
- 3.3.5. Low bargaining power of buyers
- 3.4. Market dynamics
- 3.4.1. Drivers
- 3.4.1.1. Rising cybersecurity threats
- 3.4.1.2. Growing adoption of cloud
- 3.4.1.3. Rising volume of user data
- 3.4.2. Restraints
- 3.4.2.1. High cost of implementation
- 3.4.2.2. Shortage of skilled labor
- 3.4.3. Opportunities
- 3.4.3.1. Technological advancements
- 3.4.1. Drivers
CHAPTER 4: DATA CENTER SECURITY MARKET, BY COMPONENT
- 4.1. Overview
- 4.1.1. Market size and forecast
- 4.2. Solution
- 4.2.1. Key market trends, growth factors and opportunities
- 4.2.2. Market size and forecast, by region
- 4.2.3. Market share analysis by country
- 4.3. Service
- 4.3.1. Key market trends, growth factors and opportunities
- 4.3.2. Market size and forecast, by region
- 4.3.3. Market share analysis by country
CHAPTER 5: DATA CENTER SECURITY MARKET, BY DATA CENTER TYPE
- 5.1. Overview
- 5.1.1. Market size and forecast
- 5.2. Small Data Center
- 5.2.1. Key market trends, growth factors and opportunities
- 5.2.2. Market size and forecast, by region
- 5.2.3. Market share analysis by country
- 5.3. Medium Data Center
- 5.3.1. Key market trends, growth factors and opportunities
- 5.3.2. Market size and forecast, by region
- 5.3.3. Market share analysis by country
- 5.4. Large Data Center
- 5.4.1. Key market trends, growth factors and opportunities
- 5.4.2. Market size and forecast, by region
- 5.4.3. Market share analysis by country
CHAPTER 6: DATA CENTER SECURITY MARKET, BY INDUSTRY VERTICAL
- 6.1. Overview
- 6.1.1. Market size and forecast
- 6.2. BFSI
- 6.2.1. Key market trends, growth factors and opportunities
- 6.2.2. Market size and forecast, by region
- 6.2.3. Market share analysis by country
- 6.3. IT and Telecom
- 6.3.1. Key market trends, growth factors and opportunities
- 6.3.2. Market size and forecast, by region
- 6.3.3. Market share analysis by country
- 6.4. Healthcare
- 6.4.1. Key market trends, growth factors and opportunities
- 6.4.2. Market size and forecast, by region
- 6.4.3. Market share analysis by country
- 6.5. Retail and E-commerce
- 6.5.1. Key market trends, growth factors and opportunities
- 6.5.2. Market size and forecast, by region
- 6.5.3. Market share analysis by country
- 6.6. Media and Entertainment
- 6.6.1. Key market trends, growth factors and opportunities
- 6.6.2. Market size and forecast, by region
- 6.6.3. Market share analysis by country
- 6.7. Government
- 6.7.1. Key market trends, growth factors and opportunities
- 6.7.2. Market size and forecast, by region
- 6.7.3. Market share analysis by country
- 6.8. Others
- 6.8.1. Key market trends, growth factors and opportunities
- 6.8.2. Market size and forecast, by region
- 6.8.3. Market share analysis by country
CHAPTER 7: DATA CENTER SECURITY MARKET, BY REGION
- 7.1. Overview
- 7.1.1. Market size and forecast By Region
- 7.2. North America
- 7.2.1. Key market trends, growth factors and opportunities
- 7.2.2. Market size and forecast, by Component
- 7.2.3. Market size and forecast, by Data Center Type
- 7.2.4. Market size and forecast, by Industry Vertical
- 7.2.5. Market size and forecast, by country
- 7.2.5.1. U.S.
- 7.2.5.1.1. Market size and forecast, by Component
- 7.2.5.1.2. Market size and forecast, by Data Center Type
- 7.2.5.1.3. Market size and forecast, by Industry Vertical
- 7.2.5.2. Canada
- 7.2.5.2.1. Market size and forecast, by Component
- 7.2.5.2.2. Market size and forecast, by Data Center Type
- 7.2.5.2.3. Market size and forecast, by Industry Vertical
- 7.3. Europe
- 7.3.1. Key market trends, growth factors and opportunities
- 7.3.2. Market size and forecast, by Component
- 7.3.3. Market size and forecast, by Data Center Type
- 7.3.4. Market size and forecast, by Industry Vertical
- 7.3.5. Market size and forecast, by country
- 7.3.5.1. UK
- 7.3.5.1.1. Market size and forecast, by Component
- 7.3.5.1.2. Market size and forecast, by Data Center Type
- 7.3.5.1.3. Market size and forecast, by Industry Vertical
- 7.3.5.2. Germany
- 7.3.5.2.1. Market size and forecast, by Component
- 7.3.5.2.2. Market size and forecast, by Data Center Type
- 7.3.5.2.3. Market size and forecast, by Industry Vertical
- 7.3.5.3. France
- 7.3.5.3.1. Market size and forecast, by Component
- 7.3.5.3.2. Market size and forecast, by Data Center Type
- 7.3.5.3.3. Market size and forecast, by Industry Vertical
- 7.3.5.4. Italy
- 7.3.5.4.1. Market size and forecast, by Component
- 7.3.5.4.2. Market size and forecast, by Data Center Type
- 7.3.5.4.3. Market size and forecast, by Industry Vertical
- 7.3.5.5. Spain
- 7.3.5.5.1. Market size and forecast, by Component
- 7.3.5.5.2. Market size and forecast, by Data Center Type
- 7.3.5.5.3. Market size and forecast, by Industry Vertical
- 7.3.5.6. Rest of Europe
- 7.3.5.6.1. Market size and forecast, by Component
- 7.3.5.6.2. Market size and forecast, by Data Center Type
- 7.3.5.6.3. Market size and forecast, by Industry Vertical
- 7.4. Asia-Pacific
- 7.4.1. Key market trends, growth factors and opportunities
- 7.4.2. Market size and forecast, by Component
- 7.4.3. Market size and forecast, by Data Center Type
- 7.4.4. Market size and forecast, by Industry Vertical
- 7.4.5. Market size and forecast, by country
- 7.4.5.1. China
- 7.4.5.1.1. Market size and forecast, by Component
- 7.4.5.1.2. Market size and forecast, by Data Center Type
- 7.4.5.1.3. Market size and forecast, by Industry Vertical
- 7.4.5.2. Japan
- 7.4.5.2.1. Market size and forecast, by Component
- 7.4.5.2.2. Market size and forecast, by Data Center Type
- 7.4.5.2.3. Market size and forecast, by Industry Vertical
- 7.4.5.3. India
- 7.4.5.3.1. Market size and forecast, by Component
- 7.4.5.3.2. Market size and forecast, by Data Center Type
- 7.4.5.3.3. Market size and forecast, by Industry Vertical
- 7.4.5.4. Australia
- 7.4.5.4.1. Market size and forecast, by Component
- 7.4.5.4.2. Market size and forecast, by Data Center Type
- 7.4.5.4.3. Market size and forecast, by Industry Vertical
- 7.4.5.5. South Korea
- 7.4.5.5.1. Market size and forecast, by Component
- 7.4.5.5.2. Market size and forecast, by Data Center Type
- 7.4.5.5.3. Market size and forecast, by Industry Vertical
- 7.4.5.6. Rest of Asia-Pacific
- 7.4.5.6.1. Market size and forecast, by Component
- 7.4.5.6.2. Market size and forecast, by Data Center Type
- 7.4.5.6.3. Market size and forecast, by Industry Vertical
- 7.5. LAMEA
- 7.5.1. Key market trends, growth factors and opportunities
- 7.5.2. Market size and forecast, by Component
- 7.5.3. Market size and forecast, by Data Center Type
- 7.5.4. Market size and forecast, by Industry Vertical
- 7.5.5. Market size and forecast, by country
- 7.5.5.1. Latin America
- 7.5.5.1.1. Market size and forecast, by Component
- 7.5.5.1.2. Market size and forecast, by Data Center Type
- 7.5.5.1.3. Market size and forecast, by Industry Vertical
- 7.5.5.2. Middle East
- 7.5.5.2.1. Market size and forecast, by Component
- 7.5.5.2.2. Market size and forecast, by Data Center Type
- 7.5.5.2.3. Market size and forecast, by Industry Vertical
- 7.5.5.3. Africa
- 7.5.5.3.1. Market size and forecast, by Component
- 7.5.5.3.2. Market size and forecast, by Data Center Type
- 7.5.5.3.3. Market size and forecast, by Industry Vertical
CHAPTER 8: COMPETITIVE LANDSCAPE
- 8.1. Introduction
- 8.2. Top winning strategies
- 8.3. Product mapping of top 10 player
- 8.4. Competitive dashboard
- 8.5. Competitive heatmap
- 8.6. Top player positioning, 2022
CHAPTER 9: COMPANY PROFILES
- 9.1. Cisco Systems, Inc.
- 9.1.1. Company overview
- 9.1.2. Key executives
- 9.1.3. Company snapshot
- 9.1.4. Operating business segments
- 9.1.5. Product portfolio
- 9.1.6. Business performance
- 9.1.7. Key strategic moves and developments
- 9.2. IBM Corporation
- 9.2.1. Company overview
- 9.2.2. Key executives
- 9.2.3. Company snapshot
- 9.2.4. Operating business segments
- 9.2.5. Product portfolio
- 9.2.6. Business performance
- 9.2.7. Key strategic moves and developments
- 9.3. Broadcom
- 9.3.1. Company overview
- 9.3.2. Key executives
- 9.3.3. Company snapshot
- 9.3.4. Operating business segments
- 9.3.5. Product portfolio
- 9.3.6. Business performance
- 9.3.7. Key strategic moves and developments
- 9.4. Dell Inc.
- 9.4.1. Company overview
- 9.4.2. Key executives
- 9.4.3. Company snapshot
- 9.4.4. Operating business segments
- 9.4.5. Product portfolio
- 9.4.6. Business performance
- 9.4.7. Key strategic moves and developments
- 9.5. Siemens
- 9.5.1. Company overview
- 9.5.2. Key executives
- 9.5.3. Company snapshot
- 9.5.4. Operating business segments
- 9.5.5. Product portfolio
- 9.5.6. Business performance
- 9.6. Schneider Electric
- 9.6.1. Company overview
- 9.6.2. Key executives
- 9.6.3. Company snapshot
- 9.6.4. Operating business segments
- 9.6.5. Product portfolio
- 9.6.6. Business performance
- 9.6.7. Key strategic moves and developments
- 9.7. Juniper Networks, Inc.
- 9.7.1. Company overview
- 9.7.2. Key executives
- 9.7.3. Company snapshot
- 9.7.4. Operating business segments
- 9.7.5. Product portfolio
- 9.7.6. Business performance
- 9.7.7. Key strategic moves and developments
- 9.8. Fortinet, Inc.
- 9.8.1. Company overview
- 9.8.2. Key executives
- 9.8.3. Company snapshot
- 9.8.4. Operating business segments
- 9.8.5. Product portfolio
- 9.8.6. Business performance
- 9.8.7. Key strategic moves and developments
- 9.9. Honeywell International Inc.
- 9.9.1. Company overview
- 9.9.2. Key executives
- 9.9.3. Company snapshot
- 9.9.4. Operating business segments
- 9.9.5. Product portfolio
- 9.9.6. Business performance
- 9.9.7. Key strategic moves and developments
- 9.10. Palo Alto Networks, Inc.
- 9.10.1. Company overview
- 9.10.2. Key executives
- 9.10.3. Company snapshot
- 9.10.4. Operating business segments
- 9.10.5. Product portfolio
- 9.10.6. Business performance