
|
市場調査レポート
商品コード
1414883
スキンケア機器市場:製品タイプ別、用途別、エンドユーザー別:世界の機会分析と産業予測、2023-2032年Skincare Devices Market By Product Type (Diagnostic Devices, Treatment Devices), By Application (Disease Diagnosis, Skin Treatment), By End User (Dermatology Clinics, Salons & Spas, Others): Global Opportunity Analysis & Industry Forecast, 2023-2032 |
||||||
|
|||||||

| スキンケア機器市場:製品タイプ別、用途別、エンドユーザー別:世界の機会分析と産業予測、2023-2032年 |
|
出版日: 2023年11月30日
発行: Allied Market Research
ページ情報: 英文 270 Pages
納期: 2~3営業日
|

- 全表示
- 概要
- 図表
- 目次
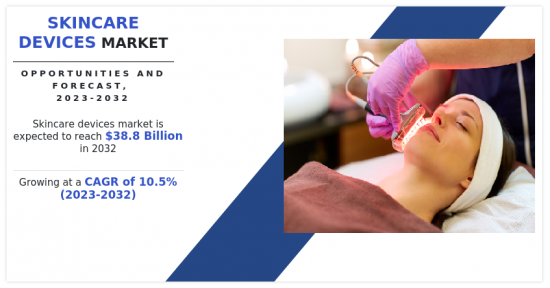
スキンケア機器市場は、2022年に143億米ドルと評価され、2023年から2032年にかけてCAGR 10.5%で成長し、2032年には388億米ドルに達すると推定されます。
スキンケア機器市場の成長は、美容意識の高まり、以下のような非外科的美容施術の増加によってもたらされます。
- 切除および非切除レーザーリサーフェシング治療、顔面美容手順の採用における外科手術などです。さらに、皮膚の健康に対する意識の高まりが市場の成長をさらに後押ししています。例えば、米国形成外科学会(ASPS)の報告書によると、2020年には世界で約1,600万件の美容整形手術が実施されたと報告されています。このように、皮膚の健康に対する意識の高まりは、新しいスキンケア機器の開発機会を生み出し、ひいては市場の成長を促進します。
さらに、意識の高まりと身だしなみの重視が、スキンケア機器の需要を押し上げています。例えば、米国形成外科学会(ASPS)の報告書によると、2020年には消費者全体で約200億米ドルをフェイシャルエステの施術に費やすと報告されています。さらに、以下のような皮膚疾患の有病率の上昇も影響しています。
- にきびや乾癬などの皮膚疾患の増加は、スキンケア機器の需要を促進し、市場の成長を後押しします。スキンケア機器は次のようなものです。
- 光治療器は、特定の光波長を使用してにきびをターゲットにし、炎症を抑えます。したがって、にきびの有病率の増加が光治療機器の需要を牽引しています。
しかし、スキンケア機器のコストが高いため、これらの機器の普及が制限され、市場の成長にマイナスの影響を与えています。例えば、以下のような最先端技術を組み込んだ革新的な機器があります。
- LEDライトフェイスマスクは750ドルから1,000ドルです。一方、治療機器の技術的進歩としては、以下のようなものがあります。
- ペンサイズのスキントーニング機器やカスタマイズされた脱毛機器の開拓は、市場の成長をさらに後押しします。このように、スキンケア機器の技術的進歩は、予測期間中に市場成長のための有利な機会を創出すると予想されます。
スキンケア機器市場は、製品タイプ、用途、エンドユーザー、地域によって区分されます。製品タイプに基づいて、市場は診断機器と治療機器に二分されます。診断機器分野はさらに、皮膚鏡、画像診断機器、生検機器に分類されます。治療機器分野はさらに、光治療機器、レーザー、電気外科機器、脂肪吸引機器、マイクロダーマブレーション機器、その他に分けられます。用途別では、市場は疾病診断と皮膚治療に分類されます。皮膚治療分野はさらに、脱毛、肌の若返り・リサーフェシング、にきび・傷跡・タトゥー除去、ボディライン・肌の引き締め、その他に分けられます。エンドユーザー別では、皮膚科クリニック、サロン&スパ、その他に分類されます。
利害関係者にとっての主なメリット
- 当レポートでは、2022年から2032年にかけてのスキンケア機器市場分析の市場セグメント、現在の動向、推定・動向分析、ダイナミクスを定量的に分析し、スキンケア機器市場の有力な機会を特定します。
- 市場促進要因、市場抑制要因、市場機会に関連する情報とともに市場調査を提供します。
- ポーターのファイブフォース分析では、利害関係者が利益重視のビジネス決定を下し、サプライヤーとバイヤーのネットワークを強化できるよう、バイヤーとサプライヤーの力を強調します。
- スキンケア機器市場のセグメンテーションの詳細な分析により、市場機会を見極めることができます。
- 各地域の主要国は、世界市場への収益貢献度に応じてマッピングされています。
- 市場プレイヤーのポジショニングはベンチマーキングを容易にし、市場プレイヤーの現在のポジションを明確に理解することができます。
- 本レポートには、地域別および世界のスキンケア機器市場動向、主要企業、市場セグメント、応用分野、市場成長戦略の分析が含まれています。
本レポートのカスタマイズが可能(別途費用と要スケジュール調整)
- 規制ガイドライン
- 顧客の関心に応じた追加企業プロファイル
- 国別または地域別の追加分析:市場規模と予測
- 企業プロファイルの拡張リスト
- 過去の市場データ
- SWOT分析
目次
第1章 イントロダクション
第2章 エグゼクティブサマリー
第3章 市場概要
- 市場の定義と範囲
- 主な調査結果
- 影響要因
- 主な投資機会
- ポーターのファイブフォース分析
- 市場力学
- 促進要因
- 皮膚疾患の有病率の上昇
- 非侵襲的処置に対する需要の増加
- 抑制要因
- スキンケア機器の高コスト
- 機会
- スキンケア機器の技術進歩
- 促進要因
第4章 スキンケア機器市場:製品タイプ別
- 概要
- 診断用機器
- 診断機器スキンケア機器市場:タイプ別
- 治療機器
- 治療機器スキンケア機器のタイプ別市場
第5章 スキンケア機器市場:用途別
- 概要
- 疾患診断
- 皮膚治療
- 皮膚治療用スキンケア機器市場:タイプ別
第6章 スキンケア機器市場:エンドユーザー別
- 概要
- 皮膚科クリニック
- サロンとスパ
- その他
第7章 スキンケア機器市場:地域別
- 概要
- 北米
- 米国
- カナダ
- メキシコ
- 欧州
- ドイツ
- フランス
- 英国
- イタリア
- スペイン
- その他
- アジア太平洋
- 日本
- 中国
- インド
- オーストラリア
- 韓国
- その他
- ラテンアメリカ・中東・アフリカ
- ブラジル
- サウジアラビア
- 南アフリカ
- その他
第8章 競争情勢
- イントロダクション
- 主要成功戦略
- 主要10社の製品マッピング
- 競合ダッシュボード
- 競合ヒートマップ
- 主要企業のポジショニング、2022年
第9章 企業プロファイル
- Cutera
- Lumenis Ltd.
- lutronic
- Bausch Health Companies, Inc.
- Fotona
- Sciton
- Sisram Medical Ltd.
- Michelson Diagnostics Ltd
- Candela Corporation.
- Cynosure Inc
LIST OF TABLES
- TABLE 01. GLOBAL SKINCARE DEVICES MARKET, BY PRODUCT TYPE, 2022-2032 ($MILLION)
- TABLE 02. SKINCARE DEVICES MARKET FOR DIAGNOSTIC DEVICES, BY REGION, 2022-2032 ($MILLION)
- TABLE 03. GLOBAL DIAGNOSTIC DEVICES SKINCARE DEVICES MARKET, BY TYPE, 2022-2032 ($MILLION)
- TABLE 04. SKINCARE DEVICES MARKET FOR TREATMENT DEVICES, BY REGION, 2022-2032 ($MILLION)
- TABLE 05. GLOBAL TREATMENT DEVICES SKINCARE DEVICES MARKET, BY TYPE, 2022-2032 ($MILLION)
- TABLE 06. GLOBAL SKINCARE DEVICES MARKET, BY APPLICATION, 2022-2032 ($MILLION)
- TABLE 07. SKINCARE DEVICES MARKET FOR DISEASE DIAGNOSIS, BY REGION, 2022-2032 ($MILLION)
- TABLE 08. SKINCARE DEVICES MARKET FOR SKIN TREATMENT, BY REGION, 2022-2032 ($MILLION)
- TABLE 09. GLOBAL SKIN TREATMENT SKINCARE DEVICES MARKET, BY TYPE, 2022-2032 ($MILLION)
- TABLE 10. GLOBAL SKINCARE DEVICES MARKET, BY END USER, 2022-2032 ($MILLION)
- TABLE 11. SKINCARE DEVICES MARKET FOR DERMATOLOGY CLINICS, BY REGION, 2022-2032 ($MILLION)
- TABLE 12. SKINCARE DEVICES MARKET FOR SALONS AND SPAS, BY REGION, 2022-2032 ($MILLION)
- TABLE 13. SKINCARE DEVICES MARKET FOR OTHERS, BY REGION, 2022-2032 ($MILLION)
- TABLE 14. SKINCARE DEVICES MARKET, BY REGION, 2022-2032 ($MILLION)
- TABLE 15. NORTH AMERICA SKINCARE DEVICES MARKET, BY PRODUCT TYPE, 2022-2032 ($MILLION)
- TABLE 16. NORTH AMERICA SKINCARE DEVICES MARKET, BY APPLICATION, 2022-2032 ($MILLION)
- TABLE 17. NORTH AMERICA SKINCARE DEVICES MARKET, BY END USER, 2022-2032 ($MILLION)
- TABLE 18. NORTH AMERICA SKINCARE DEVICES MARKET, BY COUNTRY, 2022-2032 ($MILLION)
- TABLE 19. U.S. SKINCARE DEVICES MARKET, BY PRODUCT TYPE, 2022-2032 ($MILLION)
- TABLE 20. U.S. SKINCARE DEVICES MARKET, BY APPLICATION, 2022-2032 ($MILLION)
- TABLE 21. U.S. SKINCARE DEVICES MARKET, BY END USER, 2022-2032 ($MILLION)
- TABLE 22. CANADA SKINCARE DEVICES MARKET, BY PRODUCT TYPE, 2022-2032 ($MILLION)
- TABLE 23. CANADA SKINCARE DEVICES MARKET, BY APPLICATION, 2022-2032 ($MILLION)
- TABLE 24. CANADA SKINCARE DEVICES MARKET, BY END USER, 2022-2032 ($MILLION)
- TABLE 25. MEXICO SKINCARE DEVICES MARKET, BY PRODUCT TYPE, 2022-2032 ($MILLION)
- TABLE 26. MEXICO SKINCARE DEVICES MARKET, BY APPLICATION, 2022-2032 ($MILLION)
- TABLE 27. MEXICO SKINCARE DEVICES MARKET, BY END USER, 2022-2032 ($MILLION)
- TABLE 28. EUROPE SKINCARE DEVICES MARKET, BY PRODUCT TYPE, 2022-2032 ($MILLION)
- TABLE 29. EUROPE SKINCARE DEVICES MARKET, BY APPLICATION, 2022-2032 ($MILLION)
- TABLE 30. EUROPE SKINCARE DEVICES MARKET, BY END USER, 2022-2032 ($MILLION)
- TABLE 31. EUROPE SKINCARE DEVICES MARKET, BY COUNTRY, 2022-2032 ($MILLION)
- TABLE 32. GERMANY SKINCARE DEVICES MARKET, BY PRODUCT TYPE, 2022-2032 ($MILLION)
- TABLE 33. GERMANY SKINCARE DEVICES MARKET, BY APPLICATION, 2022-2032 ($MILLION)
- TABLE 34. GERMANY SKINCARE DEVICES MARKET, BY END USER, 2022-2032 ($MILLION)
- TABLE 35. FRANCE SKINCARE DEVICES MARKET, BY PRODUCT TYPE, 2022-2032 ($MILLION)
- TABLE 36. FRANCE SKINCARE DEVICES MARKET, BY APPLICATION, 2022-2032 ($MILLION)
- TABLE 37. FRANCE SKINCARE DEVICES MARKET, BY END USER, 2022-2032 ($MILLION)
- TABLE 38. UK SKINCARE DEVICES MARKET, BY PRODUCT TYPE, 2022-2032 ($MILLION)
- TABLE 39. UK SKINCARE DEVICES MARKET, BY APPLICATION, 2022-2032 ($MILLION)
- TABLE 40. UK SKINCARE DEVICES MARKET, BY END USER, 2022-2032 ($MILLION)
- TABLE 41. ITALY SKINCARE DEVICES MARKET, BY PRODUCT TYPE, 2022-2032 ($MILLION)
- TABLE 42. ITALY SKINCARE DEVICES MARKET, BY APPLICATION, 2022-2032 ($MILLION)
- TABLE 43. ITALY SKINCARE DEVICES MARKET, BY END USER, 2022-2032 ($MILLION)
- TABLE 44. SPAIN SKINCARE DEVICES MARKET, BY PRODUCT TYPE, 2022-2032 ($MILLION)
- TABLE 45. SPAIN SKINCARE DEVICES MARKET, BY APPLICATION, 2022-2032 ($MILLION)
- TABLE 46. SPAIN SKINCARE DEVICES MARKET, BY END USER, 2022-2032 ($MILLION)
- TABLE 47. REST OF EUROPE SKINCARE DEVICES MARKET, BY PRODUCT TYPE, 2022-2032 ($MILLION)
- TABLE 48. REST OF EUROPE SKINCARE DEVICES MARKET, BY APPLICATION, 2022-2032 ($MILLION)
- TABLE 49. REST OF EUROPE SKINCARE DEVICES MARKET, BY END USER, 2022-2032 ($MILLION)
- TABLE 50. ASIA-PACIFIC SKINCARE DEVICES MARKET, BY PRODUCT TYPE, 2022-2032 ($MILLION)
- TABLE 51. ASIA-PACIFIC SKINCARE DEVICES MARKET, BY APPLICATION, 2022-2032 ($MILLION)
- TABLE 52. ASIA-PACIFIC SKINCARE DEVICES MARKET, BY END USER, 2022-2032 ($MILLION)
- TABLE 53. ASIA-PACIFIC SKINCARE DEVICES MARKET, BY COUNTRY, 2022-2032 ($MILLION)
- TABLE 54. JAPAN SKINCARE DEVICES MARKET, BY PRODUCT TYPE, 2022-2032 ($MILLION)
- TABLE 55. JAPAN SKINCARE DEVICES MARKET, BY APPLICATION, 2022-2032 ($MILLION)
- TABLE 56. JAPAN SKINCARE DEVICES MARKET, BY END USER, 2022-2032 ($MILLION)
- TABLE 57. CHINA SKINCARE DEVICES MARKET, BY PRODUCT TYPE, 2022-2032 ($MILLION)
- TABLE 58. CHINA SKINCARE DEVICES MARKET, BY APPLICATION, 2022-2032 ($MILLION)
- TABLE 59. CHINA SKINCARE DEVICES MARKET, BY END USER, 2022-2032 ($MILLION)
- TABLE 60. INDIA SKINCARE DEVICES MARKET, BY PRODUCT TYPE, 2022-2032 ($MILLION)
- TABLE 61. INDIA SKINCARE DEVICES MARKET, BY APPLICATION, 2022-2032 ($MILLION)
- TABLE 62. INDIA SKINCARE DEVICES MARKET, BY END USER, 2022-2032 ($MILLION)
- TABLE 63. AUSTRALIA SKINCARE DEVICES MARKET, BY PRODUCT TYPE, 2022-2032 ($MILLION)
- TABLE 64. AUSTRALIA SKINCARE DEVICES MARKET, BY APPLICATION, 2022-2032 ($MILLION)
- TABLE 65. AUSTRALIA SKINCARE DEVICES MARKET, BY END USER, 2022-2032 ($MILLION)
- TABLE 66. SOUTH KOREA SKINCARE DEVICES MARKET, BY PRODUCT TYPE, 2022-2032 ($MILLION)
- TABLE 67. SOUTH KOREA SKINCARE DEVICES MARKET, BY APPLICATION, 2022-2032 ($MILLION)
- TABLE 68. SOUTH KOREA SKINCARE DEVICES MARKET, BY END USER, 2022-2032 ($MILLION)
- TABLE 69. REST OF ASIA-PACIFIC SKINCARE DEVICES MARKET, BY PRODUCT TYPE, 2022-2032 ($MILLION)
- TABLE 70. REST OF ASIA-PACIFIC SKINCARE DEVICES MARKET, BY APPLICATION, 2022-2032 ($MILLION)
- TABLE 71. REST OF ASIA-PACIFIC SKINCARE DEVICES MARKET, BY END USER, 2022-2032 ($MILLION)
- TABLE 72. LAMEA SKINCARE DEVICES MARKET, BY PRODUCT TYPE, 2022-2032 ($MILLION)
- TABLE 73. LAMEA SKINCARE DEVICES MARKET, BY APPLICATION, 2022-2032 ($MILLION)
- TABLE 74. LAMEA SKINCARE DEVICES MARKET, BY END USER, 2022-2032 ($MILLION)
- TABLE 75. LAMEA SKINCARE DEVICES MARKET, BY COUNTRY, 2022-2032 ($MILLION)
- TABLE 76. BRAZIL SKINCARE DEVICES MARKET, BY PRODUCT TYPE, 2022-2032 ($MILLION)
- TABLE 77. BRAZIL SKINCARE DEVICES MARKET, BY APPLICATION, 2022-2032 ($MILLION)
- TABLE 78. BRAZIL SKINCARE DEVICES MARKET, BY END USER, 2022-2032 ($MILLION)
- TABLE 79. SAUDI ARABIA SKINCARE DEVICES MARKET, BY PRODUCT TYPE, 2022-2032 ($MILLION)
- TABLE 80. SAUDI ARABIA SKINCARE DEVICES MARKET, BY APPLICATION, 2022-2032 ($MILLION)
- TABLE 81. SAUDI ARABIA SKINCARE DEVICES MARKET, BY END USER, 2022-2032 ($MILLION)
- TABLE 82. SOUTH AFRICA SKINCARE DEVICES MARKET, BY PRODUCT TYPE, 2022-2032 ($MILLION)
- TABLE 83. SOUTH AFRICA SKINCARE DEVICES MARKET, BY APPLICATION, 2022-2032 ($MILLION)
- TABLE 84. SOUTH AFRICA SKINCARE DEVICES MARKET, BY END USER, 2022-2032 ($MILLION)
- TABLE 85. REST OF LAMEA SKINCARE DEVICES MARKET, BY PRODUCT TYPE, 2022-2032 ($MILLION)
- TABLE 86. REST OF LAMEA SKINCARE DEVICES MARKET, BY APPLICATION, 2022-2032 ($MILLION)
- TABLE 87. REST OF LAMEA SKINCARE DEVICES MARKET, BY END USER, 2022-2032 ($MILLION)
- TABLE 88. CUTERA: KEY EXECUTIVES
- TABLE 89. CUTERA: COMPANY SNAPSHOT
- TABLE 90. CUTERA: PRODUCT SEGMENTS
- TABLE 91. CUTERA: PRODUCT PORTFOLIO
- TABLE 92. CUTERA: KEY STRATERGIES
- TABLE 93. LUMENIS LTD.: KEY EXECUTIVES
- TABLE 94. LUMENIS LTD.: COMPANY SNAPSHOT
- TABLE 95. LUMENIS LTD.: PRODUCT SEGMENTS
- TABLE 96. LUMENIS LTD.: PRODUCT PORTFOLIO
- TABLE 97. LUTRONIC: KEY EXECUTIVES
- TABLE 98. LUTRONIC: COMPANY SNAPSHOT
- TABLE 99. LUTRONIC: PRODUCT SEGMENTS
- TABLE 100. LUTRONIC: PRODUCT PORTFOLIO
- TABLE 101. BAUSCH HEALTH COMPANIES, INC.: KEY EXECUTIVES
- TABLE 102. BAUSCH HEALTH COMPANIES, INC.: COMPANY SNAPSHOT
- TABLE 103. BAUSCH HEALTH COMPANIES, INC.: PRODUCT SEGMENTS
- TABLE 104. BAUSCH HEALTH COMPANIES, INC.: PRODUCT PORTFOLIO
- TABLE 105. FOTONA: KEY EXECUTIVES
- TABLE 106. FOTONA: COMPANY SNAPSHOT
- TABLE 107. FOTONA: PRODUCT SEGMENTS
- TABLE 108. FOTONA: PRODUCT PORTFOLIO
- TABLE 109. FOTONA: KEY STRATERGIES
- TABLE 110. SCITON: KEY EXECUTIVES
- TABLE 111. SCITON: COMPANY SNAPSHOT
- TABLE 112. SCITON: PRODUCT SEGMENTS
- TABLE 113. SCITON: PRODUCT PORTFOLIO
- TABLE 114. SISRAM MEDICAL LTD.: KEY EXECUTIVES
- TABLE 115. SISRAM MEDICAL LTD.: COMPANY SNAPSHOT
- TABLE 116. SISRAM MEDICAL LTD.: PRODUCT SEGMENTS
- TABLE 117. SISRAM MEDICAL LTD.: PRODUCT PORTFOLIO
- TABLE 118. MICHELSON DIAGNOSTICS LTD: KEY EXECUTIVES
- TABLE 119. MICHELSON DIAGNOSTICS LTD: COMPANY SNAPSHOT
- TABLE 120. MICHELSON DIAGNOSTICS LTD: PRODUCT SEGMENTS
- TABLE 121. MICHELSON DIAGNOSTICS LTD: PRODUCT PORTFOLIO
- TABLE 122. CANDELA CORPORATION.: KEY EXECUTIVES
- TABLE 123. CANDELA CORPORATION.: COMPANY SNAPSHOT
- TABLE 124. CANDELA CORPORATION.: PRODUCT SEGMENTS
- TABLE 125. CANDELA CORPORATION.: PRODUCT PORTFOLIO
- TABLE 126. CYNOSURE INC: KEY EXECUTIVES
- TABLE 127. CYNOSURE INC: COMPANY SNAPSHOT
- TABLE 128. CYNOSURE INC: PRODUCT SEGMENTS
- TABLE 129. CYNOSURE INC: PRODUCT PORTFOLIO
LIST OF FIGURES
- FIGURE 01. SKINCARE DEVICES MARKET, 2022-2032
- FIGURE 02. SEGMENTATION OF SKINCARE DEVICES MARKET,2022-2032
- FIGURE 03. TOP IMPACTING FACTORS IN SKINCARE DEVICES MARKET (2022 TO 2032)
- FIGURE 04. TOP INVESTMENT POCKETS IN SKINCARE DEVICES MARKET (2023-2032)
- FIGURE 05. MODERATE BARGAINING POWER OF SUPPLIERS
- FIGURE 06. LOW THREAT OF NEW ENTRANTS
- FIGURE 07. MODERATE THREAT OF SUBSTITUTES
- FIGURE 08. MODERATE INTENSITY OF RIVALRY
- FIGURE 09. MODERATE BARGAINING POWER OF BUYERS
- FIGURE 10. GLOBAL SKINCARE DEVICES MARKET:DRIVERS, RESTRAINTS AND OPPORTUNITIES
- FIGURE 11. SKINCARE DEVICES MARKET, BY PRODUCT TYPE, 2022 AND 2032(%)
- FIGURE 12. COMPARATIVE SHARE ANALYSIS OF SKINCARE DEVICES MARKET FOR DIAGNOSTIC DEVICES, BY COUNTRY 2022 AND 2032(%)
- FIGURE 13. COMPARATIVE SHARE ANALYSIS OF SKINCARE DEVICES MARKET FOR TREATMENT DEVICES, BY COUNTRY 2022 AND 2032(%)
- FIGURE 14. SKINCARE DEVICES MARKET, BY APPLICATION, 2022 AND 2032(%)
- FIGURE 15. COMPARATIVE SHARE ANALYSIS OF SKINCARE DEVICES MARKET FOR DISEASE DIAGNOSIS, BY COUNTRY 2022 AND 2032(%)
- FIGURE 16. COMPARATIVE SHARE ANALYSIS OF SKINCARE DEVICES MARKET FOR SKIN TREATMENT, BY COUNTRY 2022 AND 2032(%)
- FIGURE 17. SKINCARE DEVICES MARKET, BY END USER, 2022 AND 2032(%)
- FIGURE 18. COMPARATIVE SHARE ANALYSIS OF SKINCARE DEVICES MARKET FOR DERMATOLOGY CLINICS, BY COUNTRY 2022 AND 2032(%)
- FIGURE 19. COMPARATIVE SHARE ANALYSIS OF SKINCARE DEVICES MARKET FOR SALONS AND SPAS, BY COUNTRY 2022 AND 2032(%)
- FIGURE 20. COMPARATIVE SHARE ANALYSIS OF SKINCARE DEVICES MARKET FOR OTHERS, BY COUNTRY 2022 AND 2032(%)
- FIGURE 21. SKINCARE DEVICES MARKET BY REGION, 2022 AND 2032(%)
- FIGURE 22. U.S. SKINCARE DEVICES MARKET, 2022-2032 ($MILLION)
- FIGURE 23. CANADA SKINCARE DEVICES MARKET, 2022-2032 ($MILLION)
- FIGURE 24. MEXICO SKINCARE DEVICES MARKET, 2022-2032 ($MILLION)
- FIGURE 25. GERMANY SKINCARE DEVICES MARKET, 2022-2032 ($MILLION)
- FIGURE 26. FRANCE SKINCARE DEVICES MARKET, 2022-2032 ($MILLION)
- FIGURE 27. UK SKINCARE DEVICES MARKET, 2022-2032 ($MILLION)
- FIGURE 28. ITALY SKINCARE DEVICES MARKET, 2022-2032 ($MILLION)
- FIGURE 29. SPAIN SKINCARE DEVICES MARKET, 2022-2032 ($MILLION)
- FIGURE 30. REST OF EUROPE SKINCARE DEVICES MARKET, 2022-2032 ($MILLION)
- FIGURE 31. JAPAN SKINCARE DEVICES MARKET, 2022-2032 ($MILLION)
- FIGURE 32. CHINA SKINCARE DEVICES MARKET, 2022-2032 ($MILLION)
- FIGURE 33. INDIA SKINCARE DEVICES MARKET, 2022-2032 ($MILLION)
- FIGURE 34. AUSTRALIA SKINCARE DEVICES MARKET, 2022-2032 ($MILLION)
- FIGURE 35. SOUTH KOREA SKINCARE DEVICES MARKET, 2022-2032 ($MILLION)
- FIGURE 36. REST OF ASIA-PACIFIC SKINCARE DEVICES MARKET, 2022-2032 ($MILLION)
- FIGURE 37. BRAZIL SKINCARE DEVICES MARKET, 2022-2032 ($MILLION)
- FIGURE 38. SAUDI ARABIA SKINCARE DEVICES MARKET, 2022-2032 ($MILLION)
- FIGURE 39. SOUTH AFRICA SKINCARE DEVICES MARKET, 2022-2032 ($MILLION)
- FIGURE 40. REST OF LAMEA SKINCARE DEVICES MARKET, 2022-2032 ($MILLION)
- FIGURE 41. TOP WINNING STRATEGIES, BY YEAR (2020-2023)
- FIGURE 42. TOP WINNING STRATEGIES, BY DEVELOPMENT (2020-2023)
- FIGURE 43. TOP WINNING STRATEGIES, BY COMPANY (2020-2023)
- FIGURE 44. PRODUCT MAPPING OF TOP 10 PLAYERS
- FIGURE 45. COMPETITIVE DASHBOARD
- FIGURE 46. COMPETITIVE HEATMAP: SKINCARE DEVICES MARKET
- FIGURE 47. TOP PLAYER POSITIONING, 2022
- FIGURE 48. CUTERA: NET REVENUE, 2020-2022 ($MILLION)
- FIGURE 49. CUTERA: REVENUE SHARE BY REGION, 2022 (%)
- FIGURE 50. CUTERA: REVENUE SHARE BY SEGMENT, 2022 (%)
- FIGURE 51. BAUSCH HEALTH COMPANIES, INC.: NET REVENUE, 2020-2022 ($MILLION)
- FIGURE 52. BAUSCH HEALTH COMPANIES, INC.: REVENUE SHARE BY SEGMENT, 2022 (%)
- FIGURE 53. BAUSCH HEALTH COMPANIES, INC.: REVENUE SHARE BY REGION, 2022 (%)
- FIGURE 54. SISRAM MEDICAL LTD.: NET REVENUE, 2020-2022 ($MILLION)
- FIGURE 55. SISRAM MEDICAL LTD.: REVENUE SHARE BY SEGMENT, 2022 (%)
- FIGURE 56. SISRAM MEDICAL LTD.: REVENUE SHARE BY REGION, 2021 (%)
According to a new report published by Allied Market Research, titled, "Skincare Devices Market," The skincare devices market was valued at $14.3 billion in 2022, and is estimated to reach $38.8 billion by 2032, growing at a CAGR of 10.5% from 2023 to 2032.
The skincare devices market growth is driven by increase in beauty consciousness, rise in number of non-surgical aesthetic procedures such as ablative and non-ablative laser resurfacing treatment, and surg in adoption of facial aesthetic procedure. Furthermore, increase in awareness about skin health further boosts the market growth. For instance, according to a report by the American Society of Plastic Surgeons (ASPS), in 2020, it was reported that around 16 million cosmetic procedures were conducted, globally. Thus, increase in awareness about skin health creates opportunities for the development of new skincare devices which, in turn, drives market growth.
Further, rise in awareness and emphasis on personal grooming drive the demand for skincare devices. For instance, according to a report by the American society of plastic surgeons (ASPS), in 2020, it was also reported that consumers spent approximately $20 billion on facial aesthetics procedures globally for total consumers. In addition, rise in prevalence of skin conditions such as acne and psoriasis foster the demand for skincare devices and boost the market growth. Skincare devices, such as light therapy devices, use specific light-wavelengths to target acne and reduce inflammation. Thus, the rise in prevalence of acne drives the demand for light therapy devices.
However, high cost of skincare devices limits widespread adoption of these devices and negatively impacts the market growth. For instance, innovative devices incorporating cutting-edge technologies such as LED Light Face Mask ranges from $750 to $1,000. On the other hand, technological advancements in the treatment devices, such as development of pen-sized skin toning devices and customized hair removal devices further boost the market growth. Thus, technological advancements in skincare devices are expected to create lucrative opportunities for market growth during the forecast period.
The skincare devices market is segmented on the basis of product type, application, end user, and region. On the basis of product type, the market is bifurcated into diagnostic devices and treatment devices. The diagnostic devices segment is further classified into dermatoscopes, imaging devics, and biopsy devices. The treatment devices segment is further divided into light therapy devices, lasers, electrosurgical equipment, liposuction devices, microdermabrasion devices, and others. On the basis of application, the market is categorized into disease diagnosis and skin treatment. The skin treatment segment further divided into hair removal, skin rejuvenation and resurfacing, acne, scar, and tattoo removal, body contouring and skin tightening, and others. On the basis of end user, the market is segregated into dermatology clinics, salons and spas, and others.
Region wise, the market is analyzed across North America (the U.S., Canada, and Mexico), Europe (Germany, France, the UK, Italy, Spain, and rest of Europe), Asia-Pacific (China, Japan, Australia, India, South Korea, and rest of Asia-Pacific), and LAMEA (Brazil, South Africa, Saudi Arabia, and rest of LAMEA). Major key players that operate in the global skincare devices market are Cutera, Lumenis Ltd., Cynosure Inc., Lutronic, Bausch Health Companies, Inc., Fotona, Sciton, Sisram Medical Ltd., Michelson Diagnostics Ltd, and Candela Corporation.
Key Benefits for Stakeholders
- This report provides a quantitative analysis of the market segments, current trends, estimations, and dynamics of the skincare devices market analysis from 2022 to 2032 to identify the prevailing skincare devices market opportunities.
- The market research is offered along with information related to key drivers, restraints, and opportunities.
- Porter's five forces analysis highlights the potency of buyers and suppliers to enable stakeholders make profit-oriented business decisions and strengthen their supplier-buyer network.
- In-depth analysis of the skincare devices market segmentation assists to determine the prevailing market opportunities.
- Major countries in each region are mapped according to their revenue contribution to the global market.
- Market player positioning facilitates benchmarking and provides a clear understanding of the present position of the market players.
- The report includes the analysis of the regional as well as global skincare devices market trends, key players, market segments, application areas, and market growth strategies.
Additional benefits you will get with this purchase are:
- Quarterly Update and* (only available with a corporate license, on listed price)
- 5 additional Company Profile of client Choice pre- or Post-purchase, as a free update.
- Free Upcoming Version on the Purchase of Five and Enterprise User License.
- 16 analyst hours of support* (post-purchase, if you find additional data requirements upon review of the report, you may receive support amounting to 16 analyst hours to solve questions, and post-sale queries)
- 15% Free Customization* (in case the scope or segment of the report does not match your requirements, 15% is equivalent to 3 working days of free work, applicable once)
- Free data Pack on the Five and Enterprise User License. (Excel version of the report)
- Free Updated report if the report is 6-12 months old or older.
- 24-hour priority response*
- Free Industry updates and white papers.
Possible Customization with this report (with additional cost and timeline, please talk to the sales executive to know more)
- Regulatory Guidelines
- Additional company profiles with specific to client's interest
- Additional country or region analysis- market size and forecast
- Expanded list for Company Profiles
- Historic market data
- SWOT Analysis
Key Market Segments
By Product Type
- Diagnostic Devices
- Type
- Dermatoscopes
- Imaging Devices
- Biopsy Devices
- Treatment Devices
- Type
- Light Therapy Devices
- Lasers
- Electrosurgical Equipment
- Liposuction Devices
- Microdermabrasion Devices
- Others
By Application
- Disease Diagnosis
- Skin Treatment
- Type
- Hair Removal
- Skin Rejuvenation and Resurfacing
- Acne, Scar, and Tattoo Removal
- Body Contouring and Skin Tightening
- Others
By End User
- Dermatology Clinics
- Salons and Spas
- Others
By Region
- North America
- U.S.
- Canada
- Mexico
- Europe
- Germany
- France
- UK
- Italy
- Spain
- Rest of Europe
- Asia-Pacific
- Japan
- China
- India
- Australia
- South Korea
- Rest of Asia-Pacific
- LAMEA
- Brazil
- Saudi Arabia
- South Africa
- Rest of LAMEA
Key Market Players:
- lutronic
- Fotona
- Sciton
- Candela Corporation.
- Sisram Medical Ltd.
- Lumenis Ltd.
- Bausch Health Companies, Inc.
- Cutera
- Michelson Diagnostics Ltd
- Cynosure Inc
TABLE OF CONTENTS
CHAPTER 1: INTRODUCTION
- 1.1. Report description
- 1.2. Key market segments
- 1.3. Key benefits to the stakeholders
- 1.4. Research methodology
- 1.4.1. Primary research
- 1.4.2. Secondary research
- 1.4.3. Analyst tools and models
CHAPTER 2: EXECUTIVE SUMMARY
- 2.1. CXO Perspective
CHAPTER 3: MARKET OVERVIEW
- 3.1. Market definition and scope
- 3.2. Key findings
- 3.2.1. Top impacting factors
- 3.2.2. Top investment pockets
- 3.3. Porter's five forces analysis
- 3.3.1. Moderate bargaining power of suppliers
- 3.3.2. Low threat of new entrants
- 3.3.3. Moderate threat of substitutes
- 3.3.4. Moderate intensity of rivalry
- 3.3.5. Moderate bargaining power of buyers
- 3.4. Market dynamics
- 3.4.1. Drivers
- 3.4.1.1. Rise in prevalence of skin disorders
- 3.4.1.2. Increase in demand for non-invasive procedures
- 3.4.2. Restraints
- 3.4.2.1. High cost of skincare devices
- 3.4.3. Opportunities
- 3.4.3.1. Technological advancement in the skincare devices
- 3.4.1. Drivers
CHAPTER 4: SKINCARE DEVICES MARKET, BY PRODUCT TYPE
- 4.1. Overview
- 4.1.1. Market size and forecast
- 4.2. Diagnostic Devices
- 4.2.1. Key market trends, growth factors and opportunities
- 4.2.2. Market size and forecast, by region
- 4.2.3. Market share analysis by country
- 4.2.4. Diagnostic Devices Skincare Devices Market by Type
- 4.3. Treatment Devices
- 4.3.1. Key market trends, growth factors and opportunities
- 4.3.2. Market size and forecast, by region
- 4.3.3. Market share analysis by country
- 4.3.4. Treatment Devices Skincare Devices Market by Type
CHAPTER 5: SKINCARE DEVICES MARKET, BY APPLICATION
- 5.1. Overview
- 5.1.1. Market size and forecast
- 5.2. Disease Diagnosis
- 5.2.1. Key market trends, growth factors and opportunities
- 5.2.2. Market size and forecast, by region
- 5.2.3. Market share analysis by country
- 5.3. Skin Treatment
- 5.3.1. Key market trends, growth factors and opportunities
- 5.3.2. Market size and forecast, by region
- 5.3.3. Market share analysis by country
- 5.3.4. Skin Treatment Skincare Devices Market by Type
CHAPTER 6: SKINCARE DEVICES MARKET, BY END USER
- 6.1. Overview
- 6.1.1. Market size and forecast
- 6.2. Dermatology Clinics
- 6.2.1. Key market trends, growth factors and opportunities
- 6.2.2. Market size and forecast, by region
- 6.2.3. Market share analysis by country
- 6.3. Salons and Spas
- 6.3.1. Key market trends, growth factors and opportunities
- 6.3.2. Market size and forecast, by region
- 6.3.3. Market share analysis by country
- 6.4. Others
- 6.4.1. Key market trends, growth factors and opportunities
- 6.4.2. Market size and forecast, by region
- 6.4.3. Market share analysis by country
CHAPTER 7: SKINCARE DEVICES MARKET, BY REGION
- 7.1. Overview
- 7.1.1. Market size and forecast By Region
- 7.2. North America
- 7.2.1. Key market trends, growth factors and opportunities
- 7.2.2. Market size and forecast, by Product Type
- 7.2.3. Market size and forecast, by Application
- 7.2.4. Market size and forecast, by End User
- 7.2.5. Market size and forecast, by country
- 7.2.5.1. U.S.
- 7.2.5.1.1. Market size and forecast, by Product Type
- 7.2.5.1.2. Market size and forecast, by Application
- 7.2.5.1.3. Market size and forecast, by End User
- 7.2.5.2. Canada
- 7.2.5.2.1. Market size and forecast, by Product Type
- 7.2.5.2.2. Market size and forecast, by Application
- 7.2.5.2.3. Market size and forecast, by End User
- 7.2.5.3. Mexico
- 7.2.5.3.1. Market size and forecast, by Product Type
- 7.2.5.3.2. Market size and forecast, by Application
- 7.2.5.3.3. Market size and forecast, by End User
- 7.3. Europe
- 7.3.1. Key market trends, growth factors and opportunities
- 7.3.2. Market size and forecast, by Product Type
- 7.3.3. Market size and forecast, by Application
- 7.3.4. Market size and forecast, by End User
- 7.3.5. Market size and forecast, by country
- 7.3.5.1. Germany
- 7.3.5.1.1. Market size and forecast, by Product Type
- 7.3.5.1.2. Market size and forecast, by Application
- 7.3.5.1.3. Market size and forecast, by End User
- 7.3.5.2. France
- 7.3.5.2.1. Market size and forecast, by Product Type
- 7.3.5.2.2. Market size and forecast, by Application
- 7.3.5.2.3. Market size and forecast, by End User
- 7.3.5.3. UK
- 7.3.5.3.1. Market size and forecast, by Product Type
- 7.3.5.3.2. Market size and forecast, by Application
- 7.3.5.3.3. Market size and forecast, by End User
- 7.3.5.4. Italy
- 7.3.5.4.1. Market size and forecast, by Product Type
- 7.3.5.4.2. Market size and forecast, by Application
- 7.3.5.4.3. Market size and forecast, by End User
- 7.3.5.5. Spain
- 7.3.5.5.1. Market size and forecast, by Product Type
- 7.3.5.5.2. Market size and forecast, by Application
- 7.3.5.5.3. Market size and forecast, by End User
- 7.3.5.6. Rest of Europe
- 7.3.5.6.1. Market size and forecast, by Product Type
- 7.3.5.6.2. Market size and forecast, by Application
- 7.3.5.6.3. Market size and forecast, by End User
- 7.4. Asia-Pacific
- 7.4.1. Key market trends, growth factors and opportunities
- 7.4.2. Market size and forecast, by Product Type
- 7.4.3. Market size and forecast, by Application
- 7.4.4. Market size and forecast, by End User
- 7.4.5. Market size and forecast, by country
- 7.4.5.1. Japan
- 7.4.5.1.1. Market size and forecast, by Product Type
- 7.4.5.1.2. Market size and forecast, by Application
- 7.4.5.1.3. Market size and forecast, by End User
- 7.4.5.2. China
- 7.4.5.2.1. Market size and forecast, by Product Type
- 7.4.5.2.2. Market size and forecast, by Application
- 7.4.5.2.3. Market size and forecast, by End User
- 7.4.5.3. India
- 7.4.5.3.1. Market size and forecast, by Product Type
- 7.4.5.3.2. Market size and forecast, by Application
- 7.4.5.3.3. Market size and forecast, by End User
- 7.4.5.4. Australia
- 7.4.5.4.1. Market size and forecast, by Product Type
- 7.4.5.4.2. Market size and forecast, by Application
- 7.4.5.4.3. Market size and forecast, by End User
- 7.4.5.5. South Korea
- 7.4.5.5.1. Market size and forecast, by Product Type
- 7.4.5.5.2. Market size and forecast, by Application
- 7.4.5.5.3. Market size and forecast, by End User
- 7.4.5.6. Rest of Asia-Pacific
- 7.4.5.6.1. Market size and forecast, by Product Type
- 7.4.5.6.2. Market size and forecast, by Application
- 7.4.5.6.3. Market size and forecast, by End User
- 7.5. LAMEA
- 7.5.1. Key market trends, growth factors and opportunities
- 7.5.2. Market size and forecast, by Product Type
- 7.5.3. Market size and forecast, by Application
- 7.5.4. Market size and forecast, by End User
- 7.5.5. Market size and forecast, by country
- 7.5.5.1. Brazil
- 7.5.5.1.1. Market size and forecast, by Product Type
- 7.5.5.1.2. Market size and forecast, by Application
- 7.5.5.1.3. Market size and forecast, by End User
- 7.5.5.2. Saudi Arabia
- 7.5.5.2.1. Market size and forecast, by Product Type
- 7.5.5.2.2. Market size and forecast, by Application
- 7.5.5.2.3. Market size and forecast, by End User
- 7.5.5.3. South Africa
- 7.5.5.3.1. Market size and forecast, by Product Type
- 7.5.5.3.2. Market size and forecast, by Application
- 7.5.5.3.3. Market size and forecast, by End User
- 7.5.5.4. Rest of LAMEA
- 7.5.5.4.1. Market size and forecast, by Product Type
- 7.5.5.4.2. Market size and forecast, by Application
- 7.5.5.4.3. Market size and forecast, by End User
CHAPTER 8: COMPETITIVE LANDSCAPE
- 8.1. Introduction
- 8.2. Top winning strategies
- 8.3. Product mapping of top 10 player
- 8.4. Competitive dashboard
- 8.5. Competitive heatmap
- 8.6. Top player positioning, 2022
CHAPTER 9: COMPANY PROFILES
- 9.1. Cutera
- 9.1.1. Company overview
- 9.1.2. Key executives
- 9.1.3. Company snapshot
- 9.1.4. Operating business segments
- 9.1.5. Product portfolio
- 9.1.6. Business performance
- 9.1.7. Key strategic moves and developments
- 9.2. Lumenis Ltd.
- 9.2.1. Company overview
- 9.2.2. Key executives
- 9.2.3. Company snapshot
- 9.2.4. Operating business segments
- 9.2.5. Product portfolio
- 9.3. lutronic
- 9.3.1. Company overview
- 9.3.2. Key executives
- 9.3.3. Company snapshot
- 9.3.4. Operating business segments
- 9.3.5. Product portfolio
- 9.4. Bausch Health Companies, Inc.
- 9.4.1. Company overview
- 9.4.2. Key executives
- 9.4.3. Company snapshot
- 9.4.4. Operating business segments
- 9.4.5. Product portfolio
- 9.4.6. Business performance
- 9.5. Fotona
- 9.5.1. Company overview
- 9.5.2. Key executives
- 9.5.3. Company snapshot
- 9.5.4. Operating business segments
- 9.5.5. Product portfolio
- 9.5.6. Key strategic moves and developments
- 9.6. Sciton
- 9.6.1. Company overview
- 9.6.2. Key executives
- 9.6.3. Company snapshot
- 9.6.4. Operating business segments
- 9.6.5. Product portfolio
- 9.7. Sisram Medical Ltd.
- 9.7.1. Company overview
- 9.7.2. Key executives
- 9.7.3. Company snapshot
- 9.7.4. Operating business segments
- 9.7.5. Product portfolio
- 9.7.6. Business performance
- 9.8. Michelson Diagnostics Ltd
- 9.8.1. Company overview
- 9.8.2. Key executives
- 9.8.3. Company snapshot
- 9.8.4. Operating business segments
- 9.8.5. Product portfolio
- 9.9. Candela Corporation.
- 9.9.1. Company overview
- 9.9.2. Key executives
- 9.9.3. Company snapshot
- 9.9.4. Operating business segments
- 9.9.5. Product portfolio
- 9.10. Cynosure Inc
- 9.10.1. Company overview
- 9.10.2. Key executives
- 9.10.3. Company snapshot
- 9.10.4. Operating business segments
- 9.10.5. Product portfolio