|
|
市場調査レポート
商品コード
1414875
スポーツ用アイウェア市場:製品タイプ別、エンドユーザー別、販売形態別:世界の機会分析と産業予測、2021-2027年Sports Eyewear Market By Product Type (Prescription Glasses, Sunglasses, Contact Lenses), By End User (Men, Women), By Mode of Sale (Retail Stores, Online Stores): Global Opportunity Analysis and Industry Forecast, 2021-2027 |
||||||
|
|
|||||||


| スポーツ用アイウェア市場:製品タイプ別、エンドユーザー別、販売形態別:世界の機会分析と産業予測、2021-2027年 |
|
出版日: 2023年11月30日
発行: Allied Market Research
ページ情報: 英文 250 Pages
納期: 2~3営業日
|
- 全表示
- 概要
- 図表
- 目次
スポーツ用アイウェア市場の2019年の市場規模は57億米ドルで、2027年には89億米ドルに達し、2021年から2027年までのCAGRは7.3%で成長すると予測されています。
スポーツ用アイウェア市場は、様々な身体活動中に目を保護する必要性に対する意識の高まりにより急成長しています。スポーツ用アイウェアメーカーは、さまざまなスポーツのニーズに対応するため、性能、耐久性、スタイルに重点を置いた新しい素材やデザインを開発しています。市場拡大の原動力となっているのは、アウトドアやエクストリーム・アクティビティに参加する人々の増加と、目の安全の重要性に対する意識の高まりです。偏光レンズ、耐衝撃素材、カスタマイズ・フレームなどの最先端技術を打ち出すため、大手企業は研究開発投資を行っています。消費者がファッション性と実用性のバランスが取れたスポーツ用アイウェアを選ぶため、市場の軌道は上昇を続けると予想されます。
スポーツ用アイウェア市場は、製品タイプ、エンドユーザー、販売形態、地域別に分析されます。製品タイプ別では、市場は度付きメガネ、サングラス、コンタクトレンズに分けられます。エンドユーザー別では、市場は男性と女性に区分されます。販売形態によって、小売店とオンラインショップに分類されます。地域別では、北米(米国、カナダ、メキシコ)、欧州(英国、フランス、イタリア、ドイツ、スペイン、その他欧州地域)、アジア太平洋地域(中国、日本、インド、オーストラリア・ニュージーランド、ASEAN、その他アジア太平洋地域)、アジア太平洋地域(中南米、中東・アフリカ)で分析されます。
消費者やスポーツ選手は、機能的な目的を果たすだけでなく、特定のスタイルに合うアイウェアを探しているため、市場はスポーツ文化におけるファッションやスタイルの影響から利益を得ています。様々なスポーツカテゴリーにおけるアスリートの多様なニーズを満たすために、アイウェア市場の大手参入企業やニッチなスポーツアイウェアメーカーがしのぎを削っています。スポーツアイウェアは、スポーツが大衆文化の中心であり続ける限り、さらなる成長が期待される市場です。新しいデザインや技術は、この分野の方向性を左右するチャンスとなると思われます。
スポーツ用アイウェアの市場は、眼の保護の重要性に対する意識の高まりによって急速に拡大しています。スポーツ選手やスポーツ・サポーターが、さまざまな活動中に眼を傷める危険性があることをより強く認識するようになったことで、専門的なアイウェアの必要性が高まっています。意識の高まりにより、消費者は強力な目の保護と性能向上の両方を提供するアイウェアを優先するようになり、それが購買決定に影響を及ぼしています。この動向は、スポーツで成功を収めるために目の健康を優先する人々の要求の変化に対応するため、素材やデザインにおける革新的なソリューションを奨励することで、スポーツ用アイウェア製品の製造方法を変えつつあります。
スポーツ・アイウェア・ビジネスでは、生理学的な個人差がカスタマイズの障害となっています。顔の構造は千差万別であるため、万能な選択肢はありません。不適切な眼鏡はアスリートのトレーニングの妨げになるため、これは快適さとパフォーマンスの両方に問題をもたらします。生産者は、製造コストを抑えながら、カスタマイズされた選択肢を提供する必要性に苦慮しています。さらに、実用性とスタイルのバランスを取ることが、カスタマイズを難しくしています。個人の嗜好に対応するために、修正されたデザインと美観の適切なバランスを見つけるのは大変な作業です。したがって、カスタマイズは世界のスポーツ用アイウェア市場の成長抑制要因の1つと考えられています。
目次
第1章 イントロダクション
第2章 エグゼクティブサマリー
第3章 市場概要
- 市場の定義と範囲
- 主な調査結果
- 影響要因
- 主な投資機会
- ポーターのファイブフォース分析
- 市場力学
- 促進要因
- 眼の保護に対する意識の高まり
- スポーツやフィットネス活動への参加の増加
- 屋外レクリエーション活動の増加
- 抑制要因
- スポーツ用アイウェアに対する認知度の低さ
- カスタマイズの課題
- 機会
- 技術進歩の成長
- 促進要因
第4章 スポーツ用アイウェア市場:製品タイプ別
- 概要
- 処方眼鏡
- サングラス
- コンタクトレンズ
第5章 スポーツ用アイウェア市場:エンドユーザー別
- 概要
- 男性用
- 女性
第6章 スポーツ用アイウェア市場:販売形態別
- 概要
- 小売店
- オンラインストア
第7章 スポーツ用アイウェア市場:地域別
- 概要
- 北米
- 米国
- カナダ
- メキシコ
- 欧州
- 英国
- フランス
- イタリア
- ドイツ
- スペイン
- その他
- アジア太平洋
- 中国
- 日本
- インド
- オーストラリア・ニュージーランド
- ASEAN
- その他
- ラテンアメリカ
- ラテンアメリカ
- 中東
- アフリカ
第8章 競合情勢
- イントロダクション
- 主要成功戦略
- 主要10社の製品マッピング
- 競合ダッシュボード
- 競合ヒートマップ
- 主要企業のポジショニング:2019年
第9章 企業プロファイル
- Titan Company Limited
- Puma SE
- Nike, Inc.
- Under Armour, Inc.
- Decathlon SA
- EssilorLuxottica S.A.
- Adidas AG
- Yiwu Conchen Glasses Co.,Ltd
- Safilo S.p.A.
- Liberty Sport, Inc.
LIST OF TABLES
- TABLE 01. GLOBAL SPORTS EYEWEAR MARKET, BY PRODUCT TYPE, 2019-2027 ($MILLION)
- TABLE 02. SPORTS EYEWEAR MARKET FOR PRESCRIPTION GLASSES, BY REGION, 2019-2027 ($MILLION)
- TABLE 03. SPORTS EYEWEAR MARKET FOR SUNGLASSES, BY REGION, 2019-2027 ($MILLION)
- TABLE 04. SPORTS EYEWEAR MARKET FOR CONTACT LENSES, BY REGION, 2019-2027 ($MILLION)
- TABLE 05. GLOBAL SPORTS EYEWEAR MARKET, BY END USER, 2019-2027 ($MILLION)
- TABLE 06. SPORTS EYEWEAR MARKET FOR MEN, BY REGION, 2019-2027 ($MILLION)
- TABLE 07. SPORTS EYEWEAR MARKET FOR WOMEN, BY REGION, 2019-2027 ($MILLION)
- TABLE 08. GLOBAL SPORTS EYEWEAR MARKET, BY MODE OF SALE, 2019-2027 ($MILLION)
- TABLE 09. SPORTS EYEWEAR MARKET FOR RETAIL STORES, BY REGION, 2019-2027 ($MILLION)
- TABLE 10. SPORTS EYEWEAR MARKET FOR ONLINE STORES, BY REGION, 2019-2027 ($MILLION)
- TABLE 11. SPORTS EYEWEAR MARKET, BY REGION, 2019-2027 ($MILLION)
- TABLE 12. NORTH AMERICA SPORTS EYEWEAR MARKET, BY PRODUCT TYPE, 2019-2027 ($MILLION)
- TABLE 13. NORTH AMERICA SPORTS EYEWEAR MARKET, BY END USER, 2019-2027 ($MILLION)
- TABLE 14. NORTH AMERICA SPORTS EYEWEAR MARKET, BY MODE OF SALE, 2019-2027 ($MILLION)
- TABLE 15. NORTH AMERICA SPORTS EYEWEAR MARKET, BY COUNTRY, 2019-2027 ($MILLION)
- TABLE 16. U.S. SPORTS EYEWEAR MARKET, BY PRODUCT TYPE, 2019-2027 ($MILLION)
- TABLE 17. U.S. SPORTS EYEWEAR MARKET, BY END USER, 2019-2027 ($MILLION)
- TABLE 18. U.S. SPORTS EYEWEAR MARKET, BY MODE OF SALE, 2019-2027 ($MILLION)
- TABLE 19. CANADA SPORTS EYEWEAR MARKET, BY PRODUCT TYPE, 2019-2027 ($MILLION)
- TABLE 20. CANADA SPORTS EYEWEAR MARKET, BY END USER, 2019-2027 ($MILLION)
- TABLE 21. CANADA SPORTS EYEWEAR MARKET, BY MODE OF SALE, 2019-2027 ($MILLION)
- TABLE 22. MEXICO SPORTS EYEWEAR MARKET, BY PRODUCT TYPE, 2019-2027 ($MILLION)
- TABLE 23. MEXICO SPORTS EYEWEAR MARKET, BY END USER, 2019-2027 ($MILLION)
- TABLE 24. MEXICO SPORTS EYEWEAR MARKET, BY MODE OF SALE, 2019-2027 ($MILLION)
- TABLE 25. EUROPE SPORTS EYEWEAR MARKET, BY PRODUCT TYPE, 2019-2027 ($MILLION)
- TABLE 26. EUROPE SPORTS EYEWEAR MARKET, BY END USER, 2019-2027 ($MILLION)
- TABLE 27. EUROPE SPORTS EYEWEAR MARKET, BY MODE OF SALE, 2019-2027 ($MILLION)
- TABLE 28. EUROPE SPORTS EYEWEAR MARKET, BY COUNTRY, 2019-2027 ($MILLION)
- TABLE 29. UK SPORTS EYEWEAR MARKET, BY PRODUCT TYPE, 2019-2027 ($MILLION)
- TABLE 30. UK SPORTS EYEWEAR MARKET, BY END USER, 2019-2027 ($MILLION)
- TABLE 31. UK SPORTS EYEWEAR MARKET, BY MODE OF SALE, 2019-2027 ($MILLION)
- TABLE 32. FRANCE SPORTS EYEWEAR MARKET, BY PRODUCT TYPE, 2019-2027 ($MILLION)
- TABLE 33. FRANCE SPORTS EYEWEAR MARKET, BY END USER, 2019-2027 ($MILLION)
- TABLE 34. FRANCE SPORTS EYEWEAR MARKET, BY MODE OF SALE, 2019-2027 ($MILLION)
- TABLE 35. ITALY SPORTS EYEWEAR MARKET, BY PRODUCT TYPE, 2019-2027 ($MILLION)
- TABLE 36. ITALY SPORTS EYEWEAR MARKET, BY END USER, 2019-2027 ($MILLION)
- TABLE 37. ITALY SPORTS EYEWEAR MARKET, BY MODE OF SALE, 2019-2027 ($MILLION)
- TABLE 38. GERMANY SPORTS EYEWEAR MARKET, BY PRODUCT TYPE, 2019-2027 ($MILLION)
- TABLE 39. GERMANY SPORTS EYEWEAR MARKET, BY END USER, 2019-2027 ($MILLION)
- TABLE 40. GERMANY SPORTS EYEWEAR MARKET, BY MODE OF SALE, 2019-2027 ($MILLION)
- TABLE 41. SPAIN SPORTS EYEWEAR MARKET, BY PRODUCT TYPE, 2019-2027 ($MILLION)
- TABLE 42. SPAIN SPORTS EYEWEAR MARKET, BY END USER, 2019-2027 ($MILLION)
- TABLE 43. SPAIN SPORTS EYEWEAR MARKET, BY MODE OF SALE, 2019-2027 ($MILLION)
- TABLE 44. REST OF EUROPE SPORTS EYEWEAR MARKET, BY PRODUCT TYPE, 2019-2027 ($MILLION)
- TABLE 45. REST OF EUROPE SPORTS EYEWEAR MARKET, BY END USER, 2019-2027 ($MILLION)
- TABLE 46. REST OF EUROPE SPORTS EYEWEAR MARKET, BY MODE OF SALE, 2019-2027 ($MILLION)
- TABLE 47. ASIA-PACIFIC SPORTS EYEWEAR MARKET, BY PRODUCT TYPE, 2019-2027 ($MILLION)
- TABLE 48. ASIA-PACIFIC SPORTS EYEWEAR MARKET, BY END USER, 2019-2027 ($MILLION)
- TABLE 49. ASIA-PACIFIC SPORTS EYEWEAR MARKET, BY MODE OF SALE, 2019-2027 ($MILLION)
- TABLE 50. ASIA-PACIFIC SPORTS EYEWEAR MARKET, BY COUNTRY, 2019-2027 ($MILLION)
- TABLE 51. CHINA SPORTS EYEWEAR MARKET, BY PRODUCT TYPE, 2019-2027 ($MILLION)
- TABLE 52. CHINA SPORTS EYEWEAR MARKET, BY END USER, 2019-2027 ($MILLION)
- TABLE 53. CHINA SPORTS EYEWEAR MARKET, BY MODE OF SALE, 2019-2027 ($MILLION)
- TABLE 54. JAPAN SPORTS EYEWEAR MARKET, BY PRODUCT TYPE, 2019-2027 ($MILLION)
- TABLE 55. JAPAN SPORTS EYEWEAR MARKET, BY END USER, 2019-2027 ($MILLION)
- TABLE 56. JAPAN SPORTS EYEWEAR MARKET, BY MODE OF SALE, 2019-2027 ($MILLION)
- TABLE 57. INDIA SPORTS EYEWEAR MARKET, BY PRODUCT TYPE, 2019-2027 ($MILLION)
- TABLE 58. INDIA SPORTS EYEWEAR MARKET, BY END USER, 2019-2027 ($MILLION)
- TABLE 59. INDIA SPORTS EYEWEAR MARKET, BY MODE OF SALE, 2019-2027 ($MILLION)
- TABLE 60. AUSTRALIA AND NEW ZEALAND SPORTS EYEWEAR MARKET, BY PRODUCT TYPE, 2019-2027 ($MILLION)
- TABLE 61. AUSTRALIA AND NEW ZEALAND SPORTS EYEWEAR MARKET, BY END USER, 2019-2027 ($MILLION)
- TABLE 62. AUSTRALIA AND NEW ZEALAND SPORTS EYEWEAR MARKET, BY MODE OF SALE, 2019-2027 ($MILLION)
- TABLE 63. ASEAN SPORTS EYEWEAR MARKET, BY PRODUCT TYPE, 2019-2027 ($MILLION)
- TABLE 64. ASEAN SPORTS EYEWEAR MARKET, BY END USER, 2019-2027 ($MILLION)
- TABLE 65. ASEAN SPORTS EYEWEAR MARKET, BY MODE OF SALE, 2019-2027 ($MILLION)
- TABLE 66. REST OF ASIA-PACIFIC SPORTS EYEWEAR MARKET, BY PRODUCT TYPE, 2019-2027 ($MILLION)
- TABLE 67. REST OF ASIA-PACIFIC SPORTS EYEWEAR MARKET, BY END USER, 2019-2027 ($MILLION)
- TABLE 68. REST OF ASIA-PACIFIC SPORTS EYEWEAR MARKET, BY MODE OF SALE, 2019-2027 ($MILLION)
- TABLE 69. LAMEA SPORTS EYEWEAR MARKET, BY PRODUCT TYPE, 2019-2027 ($MILLION)
- TABLE 70. LAMEA SPORTS EYEWEAR MARKET, BY END USER, 2019-2027 ($MILLION)
- TABLE 71. LAMEA SPORTS EYEWEAR MARKET, BY MODE OF SALE, 2019-2027 ($MILLION)
- TABLE 72. LAMEA SPORTS EYEWEAR MARKET, BY COUNTRY, 2019-2027 ($MILLION)
- TABLE 73. LATIN AMERICA SPORTS EYEWEAR MARKET, BY PRODUCT TYPE, 2019-2027 ($MILLION)
- TABLE 74. LATIN AMERICA SPORTS EYEWEAR MARKET, BY END USER, 2019-2027 ($MILLION)
- TABLE 75. LATIN AMERICA SPORTS EYEWEAR MARKET, BY MODE OF SALE, 2019-2027 ($MILLION)
- TABLE 76. MIDDLE EAST SPORTS EYEWEAR MARKET, BY PRODUCT TYPE, 2019-2027 ($MILLION)
- TABLE 77. MIDDLE EAST SPORTS EYEWEAR MARKET, BY END USER, 2019-2027 ($MILLION)
- TABLE 78. MIDDLE EAST SPORTS EYEWEAR MARKET, BY MODE OF SALE, 2019-2027 ($MILLION)
- TABLE 79. AFRICA SPORTS EYEWEAR MARKET, BY PRODUCT TYPE, 2019-2027 ($MILLION)
- TABLE 80. AFRICA SPORTS EYEWEAR MARKET, BY END USER, 2019-2027 ($MILLION)
- TABLE 81. AFRICA SPORTS EYEWEAR MARKET, BY MODE OF SALE, 2019-2027 ($MILLION)
- TABLE 82. TITAN COMPANY LIMITED: KEY EXECUTIVES
- TABLE 83. TITAN COMPANY LIMITED: COMPANY SNAPSHOT
- TABLE 84. TITAN COMPANY LIMITED: PRODUCT SEGMENTS
- TABLE 85. TITAN COMPANY LIMITED: PRODUCT PORTFOLIO
- TABLE 86. TITAN COMPANY LIMITED: KEY STRATERGIES
- TABLE 87. PUMA SE: KEY EXECUTIVES
- TABLE 88. PUMA SE: COMPANY SNAPSHOT
- TABLE 89. PUMA SE: PRODUCT SEGMENTS
- TABLE 90. PUMA SE: PRODUCT PORTFOLIO
- TABLE 91. NIKE, INC.: KEY EXECUTIVES
- TABLE 92. NIKE, INC.: COMPANY SNAPSHOT
- TABLE 93. NIKE, INC.: PRODUCT SEGMENTS
- TABLE 94. NIKE, INC.: PRODUCT PORTFOLIO
- TABLE 95. UNDER ARMOUR, INC.: KEY EXECUTIVES
- TABLE 96. UNDER ARMOUR, INC.: COMPANY SNAPSHOT
- TABLE 97. UNDER ARMOUR, INC.: PRODUCT SEGMENTS
- TABLE 98. UNDER ARMOUR, INC.: PRODUCT PORTFOLIO
- TABLE 99. UNDER ARMOUR, INC.: KEY STRATERGIES
- TABLE 100. DECATHLON SA: KEY EXECUTIVES
- TABLE 101. DECATHLON SA: COMPANY SNAPSHOT
- TABLE 102. DECATHLON SA: PRODUCT SEGMENTS
- TABLE 103. DECATHLON SA: PRODUCT PORTFOLIO
- TABLE 104. DECATHLON SA: KEY STRATERGIES
- TABLE 105. ESSILORLUXOTTICA S.A.: KEY EXECUTIVES
- TABLE 106. ESSILORLUXOTTICA S.A.: COMPANY SNAPSHOT
- TABLE 107. ESSILORLUXOTTICA S.A.: PRODUCT SEGMENTS
- TABLE 108. ESSILORLUXOTTICA S.A.: PRODUCT PORTFOLIO
- TABLE 109. ESSILORLUXOTTICA S.A.: KEY STRATERGIES
- TABLE 110. ADIDAS AG: KEY EXECUTIVES
- TABLE 111. ADIDAS AG: COMPANY SNAPSHOT
- TABLE 112. ADIDAS AG: PRODUCT SEGMENTS
- TABLE 113. ADIDAS AG: PRODUCT PORTFOLIO
- TABLE 114. YIWU CONCHEN GLASSES CO.,LTD: KEY EXECUTIVES
- TABLE 115. YIWU CONCHEN GLASSES CO.,LTD: COMPANY SNAPSHOT
- TABLE 116. YIWU CONCHEN GLASSES CO.,LTD: PRODUCT SEGMENTS
- TABLE 117. YIWU CONCHEN GLASSES CO.,LTD: PRODUCT PORTFOLIO
- TABLE 118. SAFILO S.P.A.: KEY EXECUTIVES
- TABLE 119. SAFILO S.P.A.: COMPANY SNAPSHOT
- TABLE 120. SAFILO S.P.A.: PRODUCT SEGMENTS
- TABLE 121. SAFILO S.P.A.: PRODUCT PORTFOLIO
- TABLE 122. SAFILO S.P.A.: KEY STRATERGIES
- TABLE 123. LIBERTY SPORT, INC.: KEY EXECUTIVES
- TABLE 124. LIBERTY SPORT, INC.: COMPANY SNAPSHOT
- TABLE 125. LIBERTY SPORT, INC.: PRODUCT SEGMENTS
- TABLE 126. LIBERTY SPORT, INC.: PRODUCT PORTFOLIO
- TABLE 127. LIBERTY SPORT, INC.: KEY STRATERGIES
LIST OF FIGURES
- FIGURE 01. SPORTS EYEWEAR MARKET, 2019-2027
- FIGURE 02. SEGMENTATION OF SPORTS EYEWEAR MARKET,2019-2027
- FIGURE 03. TOP IMPACTING FACTORS IN SPORTS EYEWEAR MARKET (2019 TO 2027)
- FIGURE 04. TOP INVESTMENT POCKETS IN SPORTS EYEWEAR MARKET (2021-2027)
- FIGURE 05. MODERATE BARGAINING POWER OF SUPPLIERS
- FIGURE 06. MODERATE THREAT OF NEW ENTRANTS
- FIGURE 07. MODERATE THREAT OF SUBSTITUTES
- FIGURE 08. MODERATE INTENSITY OF RIVALRY
- FIGURE 09. LOW BARGAINING POWER OF BUYERS
- FIGURE 10. GLOBAL SPORTS EYEWEAR MARKET:DRIVERS, RESTRAINTS AND OPPORTUNITIES
- FIGURE 11. SPORTS EYEWEAR MARKET, BY PRODUCT TYPE, 2019 AND 2027(%)
- FIGURE 12. COMPARATIVE SHARE ANALYSIS OF SPORTS EYEWEAR MARKET FOR PRESCRIPTION GLASSES, BY COUNTRY 2019 AND 2027(%)
- FIGURE 13. COMPARATIVE SHARE ANALYSIS OF SPORTS EYEWEAR MARKET FOR SUNGLASSES, BY COUNTRY 2019 AND 2027(%)
- FIGURE 14. COMPARATIVE SHARE ANALYSIS OF SPORTS EYEWEAR MARKET FOR CONTACT LENSES, BY COUNTRY 2019 AND 2027(%)
- FIGURE 15. SPORTS EYEWEAR MARKET, BY END USER, 2019 AND 2027(%)
- FIGURE 16. COMPARATIVE SHARE ANALYSIS OF SPORTS EYEWEAR MARKET FOR MEN, BY COUNTRY 2019 AND 2027(%)
- FIGURE 17. COMPARATIVE SHARE ANALYSIS OF SPORTS EYEWEAR MARKET FOR WOMEN, BY COUNTRY 2019 AND 2027(%)
- FIGURE 18. SPORTS EYEWEAR MARKET, BY MODE OF SALE, 2019 AND 2027(%)
- FIGURE 19. COMPARATIVE SHARE ANALYSIS OF SPORTS EYEWEAR MARKET FOR RETAIL STORES, BY COUNTRY 2019 AND 2027(%)
- FIGURE 20. COMPARATIVE SHARE ANALYSIS OF SPORTS EYEWEAR MARKET FOR ONLINE STORES, BY COUNTRY 2019 AND 2027(%)
- FIGURE 21. SPORTS EYEWEAR MARKET BY REGION, 2019 AND 2027(%)
- FIGURE 22. U.S. SPORTS EYEWEAR MARKET, 2019-2027 ($MILLION)
- FIGURE 23. CANADA SPORTS EYEWEAR MARKET, 2019-2027 ($MILLION)
- FIGURE 24. MEXICO SPORTS EYEWEAR MARKET, 2019-2027 ($MILLION)
- FIGURE 25. UK SPORTS EYEWEAR MARKET, 2019-2027 ($MILLION)
- FIGURE 26. FRANCE SPORTS EYEWEAR MARKET, 2019-2027 ($MILLION)
- FIGURE 27. ITALY SPORTS EYEWEAR MARKET, 2019-2027 ($MILLION)
- FIGURE 28. GERMANY SPORTS EYEWEAR MARKET, 2019-2027 ($MILLION)
- FIGURE 29. SPAIN SPORTS EYEWEAR MARKET, 2019-2027 ($MILLION)
- FIGURE 30. REST OF EUROPE SPORTS EYEWEAR MARKET, 2019-2027 ($MILLION)
- FIGURE 31. CHINA SPORTS EYEWEAR MARKET, 2019-2027 ($MILLION)
- FIGURE 32. JAPAN SPORTS EYEWEAR MARKET, 2019-2027 ($MILLION)
- FIGURE 33. INDIA SPORTS EYEWEAR MARKET, 2019-2027 ($MILLION)
- FIGURE 34. AUSTRALIA AND NEW ZEALAND SPORTS EYEWEAR MARKET, 2019-2027 ($MILLION)
- FIGURE 35. ASEAN SPORTS EYEWEAR MARKET, 2019-2027 ($MILLION)
- FIGURE 36. REST OF ASIA-PACIFIC SPORTS EYEWEAR MARKET, 2019-2027 ($MILLION)
- FIGURE 37. LATIN AMERICA SPORTS EYEWEAR MARKET, 2019-2027 ($MILLION)
- FIGURE 38. MIDDLE EAST SPORTS EYEWEAR MARKET, 2019-2027 ($MILLION)
- FIGURE 39. AFRICA SPORTS EYEWEAR MARKET, 2019-2027 ($MILLION)
- FIGURE 40. TOP WINNING STRATEGIES, BY YEAR (2020-2023)
- FIGURE 41. TOP WINNING STRATEGIES, BY DEVELOPMENT (2020-2023)
- FIGURE 42. TOP WINNING STRATEGIES, BY COMPANY (2020-2023)
- FIGURE 43. PRODUCT MAPPING OF TOP 10 PLAYERS
- FIGURE 44. COMPETITIVE DASHBOARD
- FIGURE 45. COMPETITIVE HEATMAP: SPORTS EYEWEAR MARKET
- FIGURE 46. TOP PLAYER POSITIONING, 2019
- FIGURE 47. TITAN COMPANY LIMITED: NET REVENUE, 2020-2022 ($MILLION)
- FIGURE 48. TITAN COMPANY LIMITED: RESEARCH & DEVELOPMENT EXPENDITURE, 2020-2022 ($MILLION)
- FIGURE 49. TITAN COMPANY LIMITED: REVENUE SHARE BY SEGMENT, 2022 (%)
- FIGURE 50. TITAN COMPANY LIMITED: REVENUE SHARE BY REGION, 2022 (%)
- FIGURE 51. PUMA SE: NET SALES, 2020-2022 ($MILLION)
- FIGURE 52. PUMA SE: RESEARCH & DEVELOPMENT EXPENDITURE, 2020-2022 ($MILLION)
- FIGURE 53. PUMA SE: REVENUE SHARE BY SEGMENT, 2022 (%)
- FIGURE 54. NIKE, INC.: NET SALES, 2020-2022 ($MILLION)
- FIGURE 55. NIKE, INC.: RESEARCH & DEVELOPMENT EXPENDITURE, 2020-2022 ($MILLION)
- FIGURE 56. NIKE, INC.: REVENUE SHARE BY SEGMENT, 2021 (%)
- FIGURE 57. UNDER ARMOUR, INC.: NET REVENUE, 2020-2022 ($MILLION)
- FIGURE 58. UNDER ARMOUR, INC.: REVENUE SHARE BY SEGMENT, 2022 (%)
- FIGURE 59. DECATHLON SA: NET SALES, 2020-2022 ($MILLION)
- FIGURE 60. ESSILORLUXOTTICA S.A.: NET REVENUE, 2020-2022 ($MILLION)
- FIGURE 61. ESSILORLUXOTTICA S.A.: RESEARCH & DEVELOPMENT EXPENDITURE, 2020-2022 ($MILLION)
- FIGURE 62. ESSILORLUXOTTICA S.A.: REVENUE SHARE BY SEGMENT, 2022 (%)
- FIGURE 63. ESSILORLUXOTTICA S.A.: REVENUE SHARE BY REGION, 2022 (%)
- FIGURE 64. ADIDAS AG: NET SALES, 2020-2022 ($MILLION)
- FIGURE 65. ADIDAS AG: RESEARCH & DEVELOPMENT EXPENDITURE, 2020-2022 ($MILLION)
- FIGURE 66. ADIDAS AG: REVENUE SHARE BY SEGMENT, 2022 (%)
- FIGURE 67. ADIDAS AG: REVENUE SHARE BY REGION, 2022 (%)
- FIGURE 68. SAFILO S.P.A.: NET SALES, 2020-2022 ($MILLION)
- FIGURE 69. SAFILO S.P.A.: RESEARCH & DEVELOPMENT EXPENDITURE, 2020-2022 ($MILLION)
- FIGURE 70. SAFILO S.P.A.: REVENUE SHARE BY REGION, 2022 (%)
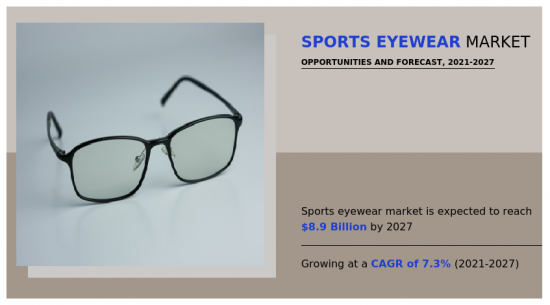
According to a new report published by Allied Market Research, titled, "Sports Eyewear Market," The sports eyewear market was valued at $5.7 billion in 2019, and is estimated to reach $8.9 billion by 2027, growing at a CAGR of 7.3% from 2021 to 2027.
The sports eyewear market is growing rapidly due to increasing awareness of the need for eye protection during various physical activities. Sports eyewear manufacturers are developing new materials and designs focused on performance, durability, and style to meet a variety of sports' needs. Market expansion is being driven by the increasing number of people participating in outdoor and extreme activities and increasing awareness of the importance of eye safety. To launch cutting-edge technology like polarized lenses, impact-resistant materials, and customized frames, major firms are making research and development investments. The market's trajectory is expected to continue rising as consumers choose sports eyewear that balances fashion and utility.
The sports eyewear market is analyzed on the basis of product type, end user, mode of sale, and region. By product type, the market is divided into prescription glasses, sunglasses, and contact lenses. By end user, the market is segmented into men and women. Depending on the mode of sale, it is classified into retail stores and online stores. Region-wise, the market is analyzed across North America (the U.S., Canada, and Mexico), Europe (the UK, France, Italy, Germany, Spain, and the rest of Europe), Asia-Pacific (China, Japan, India, Australia & New Zealand, ASEAN, and the rest of Asia-Pacific), and LAMEA (Latin America, Middle East, and Africa).
Since consumers and athletes look for eyewear that not only serves a functional purpose but also fits in with their particular style, the market gains from the fashion and style influence in sports culture. Competing to satisfy the varied needs of athletes across a range of sports categories are major participants in the eyewear market as well as niche sports eyewear manufacturers. Sports eyewear is a market that is expected to grow further as long as sports maintain their centrality in popular culture. New designs and technology will have the chance to influence the direction of this sector.
The market for sports eyewear is expanding rapidly due to increased awareness of the importance of eye protection. The need for specialized eyewear is being driven with the help of athletes and sports supporters who are becoming more aware of possible risks of eye injury during different activities. Growing awareness is driving consumers to prioritize eyewear that provides both strong eye protection and performance enhancement, which in turn influences their purchasing decisions. This trend is changing the way of manufacturing sports eyewear products by encouraging innovative solutions in material and design to meet the changing demands of people who prioritize their eye health when it comes to achieving athletic success.
Individual differences in physiology present obstacles to customization in the sports eyewear business. There is no one-size-fits-all option because facial structures differ a lot. This presents problems for both comfort and performance because inappropriate eyeglasses can distract from an athlete's training. Producers struggle with the requirement to provide customized choices while keeping manufacturing costs low. Furthermore, achieving a balance between practicality and style makes customization more difficult. It's a tough task to find the correct balance between modified design and aesthetics to accommodate individual tastes. Thus, customization is regarded as one of the restraints for the growth of the global sports eyewear market.
The key players operating in the sports eyewear market have adopted product launch and business expansion as their key strategies to expand their market share, increase profitability, and remain competitive in the market. The major players operating in the global sports eyewear market are Puma SE, Nike, Inc., Under Armour, Inc., Adidas AG, Titan Company Limited, Liberty Sport, Inc., Safilo S.p.A., EssilorLuxottica S.A., Yiwu Conchen Glasses Co., Ltd, and Decathlon SA.
Key Benefits For Stakeholders
- This report provides a quantitative analysis of the market segments, current trends, estimations, and dynamics of the sports eyewear market analysis from 2019 to 2027 to identify the prevailing sports eyewear market opportunities.
- The market research is offered along with information related to key drivers, restraints, and opportunities.
- Porter's five forces analysis highlights the potency of buyers and suppliers to enable stakeholders make profit-oriented business decisions and strengthen their supplier-buyer network.
- In-depth analysis of the sports eyewear market segmentation assists to determine the prevailing market opportunities.
- Major countries in each region are mapped according to their revenue contribution to the global market.
- Market player positioning facilitates benchmarking and provides a clear understanding of the present position of the market players.
- The report includes the analysis of the regional as well as global sports eyewear market trends, key players, market segments, application areas, and market growth strategies.
Additional benefits you will get with this purchase are:
- Quarterly Update and* (only available with a corporate license, on listed price)
- 5 additional Company Profile of client Choice pre- or Post-purchase, as a free update.
- Free Upcoming Version on the Purchase of Five and Enterprise User License.
- 16 analyst hours of support* (post-purchase, if you find additional data requirements upon review of the report, you may receive support amounting to 16 analyst hours to solve questions, and post-sale queries)
- 15% Free Customization* (in case the scope or segment of the report does not match your requirements, 15% is equivalent to 3 working days of free work, applicable once)
- Free data Pack on the Five and Enterprise User License. (Excel version of the report)
- Free Updated report if the report is 6-12 months old or older.
- 24-hour priority response*
- Free Industry updates and white papers.
Possible Customization with this report (with additional cost and timeline, please talk to the sales executive to know more)
- Additional company profiles with specific to client's interest
- Additional country or region analysis- market size and forecast
- Average Selling Price Analysis / Price Point Analysis
- Historic market data
Key Market Segments
By Mode of Sale
- Retail Stores
- Online Stores
By Product Type
- Prescription Glasses
- Sunglasses
- Contact Lenses
By End User
- Men
- Women
By Region
- North America
- U.S.
- Canada
- Mexico
- Europe
- UK
- France
- Italy
- Germany
- Spain
- Rest of Europe
- Asia-Pacific
- China
- Japan
- India
- Australia And New Zealand
- Asean
- Rest of Asia-Pacific
- LAMEA
- Latin America
- Middle East
- Africa
Key Market Players:
- Puma SE
- Nike, Inc.
- Adidas AG
- Titan Company Limited
- Safilo S.p.A.
- EssilorLuxottica S.A.
- Decathlon SA
- Under Armour, Inc.
- Liberty Sport, Inc.
- Yiwu Conchen Glasses Co.,Ltd
TABLE OF CONTENTS
CHAPTER 1: INTRODUCTION
- 1.1. Report description
- 1.2. Key market segments
- 1.3. Key benefits to the stakeholders
- 1.4. Research methodology
- 1.4.1. Primary research
- 1.4.2. Secondary research
- 1.4.3. Analyst tools and models
CHAPTER 2: EXECUTIVE SUMMARY
- 2.1. CXO Perspective
CHAPTER 3: MARKET OVERVIEW
- 3.1. Market definition and scope
- 3.2. Key findings
- 3.2.1. Top impacting factors
- 3.2.2. Top investment pockets
- 3.3. Porter's five forces analysis
- 3.3.1. Moderate bargaining power of suppliers
- 3.3.2. Moderate threat of new entrants
- 3.3.3. Moderate threat of substitutes
- 3.3.4. Moderate intensity of rivalry
- 3.3.5. Low bargaining power of buyers
- 3.4. Market dynamics
- 3.4.1. Drivers
- 3.4.1.1. Rise in awareness of eye protection
- 3.4.1.2. Increase in participation in sports and fitness activities
- 3.4.1.3. Rise in outdoor recreational activities
- 3.4.2. Restraints
- 3.4.2.1. Limited awareness about sports eyewear
- 3.4.2.2. Customization challenges
- 3.4.3. Opportunities
- 3.4.3.1. Growth in technological advancements
- 3.4.1. Drivers
CHAPTER 4: SPORTS EYEWEAR MARKET, BY PRODUCT TYPE
- 4.1. Overview
- 4.1.1. Market size and forecast
- 4.2. Prescription Glasses
- 4.2.1. Key market trends, growth factors and opportunities
- 4.2.2. Market size and forecast, by region
- 4.2.3. Market share analysis by country
- 4.3. Sunglasses
- 4.3.1. Key market trends, growth factors and opportunities
- 4.3.2. Market size and forecast, by region
- 4.3.3. Market share analysis by country
- 4.4. Contact Lenses
- 4.4.1. Key market trends, growth factors and opportunities
- 4.4.2. Market size and forecast, by region
- 4.4.3. Market share analysis by country
CHAPTER 5: SPORTS EYEWEAR MARKET, BY END USER
- 5.1. Overview
- 5.1.1. Market size and forecast
- 5.2. Men
- 5.2.1. Key market trends, growth factors and opportunities
- 5.2.2. Market size and forecast, by region
- 5.2.3. Market share analysis by country
- 5.3. Women
- 5.3.1. Key market trends, growth factors and opportunities
- 5.3.2. Market size and forecast, by region
- 5.3.3. Market share analysis by country
CHAPTER 6: SPORTS EYEWEAR MARKET, BY MODE OF SALE
- 6.1. Overview
- 6.1.1. Market size and forecast
- 6.2. Retail Stores
- 6.2.1. Key market trends, growth factors and opportunities
- 6.2.2. Market size and forecast, by region
- 6.2.3. Market share analysis by country
- 6.3. Online Stores
- 6.3.1. Key market trends, growth factors and opportunities
- 6.3.2. Market size and forecast, by region
- 6.3.3. Market share analysis by country
CHAPTER 7: SPORTS EYEWEAR MARKET, BY REGION
- 7.1. Overview
- 7.1.1. Market size and forecast By Region
- 7.2. North America
- 7.2.1. Key market trends, growth factors and opportunities
- 7.2.2. Market size and forecast, by Product Type
- 7.2.3. Market size and forecast, by End User
- 7.2.4. Market size and forecast, by Mode of Sale
- 7.2.5. Market size and forecast, by country
- 7.2.5.1. U.S.
- 7.2.5.1.1. Market size and forecast, by Product Type
- 7.2.5.1.2. Market size and forecast, by End User
- 7.2.5.1.3. Market size and forecast, by Mode of Sale
- 7.2.5.2. Canada
- 7.2.5.2.1. Market size and forecast, by Product Type
- 7.2.5.2.2. Market size and forecast, by End User
- 7.2.5.2.3. Market size and forecast, by Mode of Sale
- 7.2.5.3. Mexico
- 7.2.5.3.1. Market size and forecast, by Product Type
- 7.2.5.3.2. Market size and forecast, by End User
- 7.2.5.3.3. Market size and forecast, by Mode of Sale
- 7.3. Europe
- 7.3.1. Key market trends, growth factors and opportunities
- 7.3.2. Market size and forecast, by Product Type
- 7.3.3. Market size and forecast, by End User
- 7.3.4. Market size and forecast, by Mode of Sale
- 7.3.5. Market size and forecast, by country
- 7.3.5.1. UK
- 7.3.5.1.1. Market size and forecast, by Product Type
- 7.3.5.1.2. Market size and forecast, by End User
- 7.3.5.1.3. Market size and forecast, by Mode of Sale
- 7.3.5.2. France
- 7.3.5.2.1. Market size and forecast, by Product Type
- 7.3.5.2.2. Market size and forecast, by End User
- 7.3.5.2.3. Market size and forecast, by Mode of Sale
- 7.3.5.3. Italy
- 7.3.5.3.1. Market size and forecast, by Product Type
- 7.3.5.3.2. Market size and forecast, by End User
- 7.3.5.3.3. Market size and forecast, by Mode of Sale
- 7.3.5.4. Germany
- 7.3.5.4.1. Market size and forecast, by Product Type
- 7.3.5.4.2. Market size and forecast, by End User
- 7.3.5.4.3. Market size and forecast, by Mode of Sale
- 7.3.5.5. Spain
- 7.3.5.5.1. Market size and forecast, by Product Type
- 7.3.5.5.2. Market size and forecast, by End User
- 7.3.5.5.3. Market size and forecast, by Mode of Sale
- 7.3.5.6. Rest of Europe
- 7.3.5.6.1. Market size and forecast, by Product Type
- 7.3.5.6.2. Market size and forecast, by End User
- 7.3.5.6.3. Market size and forecast, by Mode of Sale
- 7.4. Asia-Pacific
- 7.4.1. Key market trends, growth factors and opportunities
- 7.4.2. Market size and forecast, by Product Type
- 7.4.3. Market size and forecast, by End User
- 7.4.4. Market size and forecast, by Mode of Sale
- 7.4.5. Market size and forecast, by country
- 7.4.5.1. China
- 7.4.5.1.1. Market size and forecast, by Product Type
- 7.4.5.1.2. Market size and forecast, by End User
- 7.4.5.1.3. Market size and forecast, by Mode of Sale
- 7.4.5.2. Japan
- 7.4.5.2.1. Market size and forecast, by Product Type
- 7.4.5.2.2. Market size and forecast, by End User
- 7.4.5.2.3. Market size and forecast, by Mode of Sale
- 7.4.5.3. India
- 7.4.5.3.1. Market size and forecast, by Product Type
- 7.4.5.3.2. Market size and forecast, by End User
- 7.4.5.3.3. Market size and forecast, by Mode of Sale
- 7.4.5.4. Australia And New Zealand
- 7.4.5.4.1. Market size and forecast, by Product Type
- 7.4.5.4.2. Market size and forecast, by End User
- 7.4.5.4.3. Market size and forecast, by Mode of Sale
- 7.4.5.5. Asean
- 7.4.5.5.1. Market size and forecast, by Product Type
- 7.4.5.5.2. Market size and forecast, by End User
- 7.4.5.5.3. Market size and forecast, by Mode of Sale
- 7.4.5.6. Rest of Asia-Pacific
- 7.4.5.6.1. Market size and forecast, by Product Type
- 7.4.5.6.2. Market size and forecast, by End User
- 7.4.5.6.3. Market size and forecast, by Mode of Sale
- 7.5. LAMEA
- 7.5.1. Key market trends, growth factors and opportunities
- 7.5.2. Market size and forecast, by Product Type
- 7.5.3. Market size and forecast, by End User
- 7.5.4. Market size and forecast, by Mode of Sale
- 7.5.5. Market size and forecast, by country
- 7.5.5.1. Latin America
- 7.5.5.1.1. Market size and forecast, by Product Type
- 7.5.5.1.2. Market size and forecast, by End User
- 7.5.5.1.3. Market size and forecast, by Mode of Sale
- 7.5.5.2. Middle East
- 7.5.5.2.1. Market size and forecast, by Product Type
- 7.5.5.2.2. Market size and forecast, by End User
- 7.5.5.2.3. Market size and forecast, by Mode of Sale
- 7.5.5.3. Africa
- 7.5.5.3.1. Market size and forecast, by Product Type
- 7.5.5.3.2. Market size and forecast, by End User
- 7.5.5.3.3. Market size and forecast, by Mode of Sale
CHAPTER 8: COMPETITIVE LANDSCAPE
- 8.1. Introduction
- 8.2. Top winning strategies
- 8.3. Product mapping of top 10 player
- 8.4. Competitive dashboard
- 8.5. Competitive heatmap
- 8.6. Top player positioning, 2019
CHAPTER 9: COMPANY PROFILES
- 9.1. Titan Company Limited
- 9.1.1. Company overview
- 9.1.2. Key executives
- 9.1.3. Company snapshot
- 9.1.4. Operating business segments
- 9.1.5. Product portfolio
- 9.1.6. Business performance
- 9.1.7. Key strategic moves and developments
- 9.2. Puma SE
- 9.2.1. Company overview
- 9.2.2. Key executives
- 9.2.3. Company snapshot
- 9.2.4. Operating business segments
- 9.2.5. Product portfolio
- 9.2.6. Business performance
- 9.3. Nike, Inc.
- 9.3.1. Company overview
- 9.3.2. Key executives
- 9.3.3. Company snapshot
- 9.3.4. Operating business segments
- 9.3.5. Product portfolio
- 9.3.6. Business performance
- 9.4. Under Armour, Inc.
- 9.4.1. Company overview
- 9.4.2. Key executives
- 9.4.3. Company snapshot
- 9.4.4. Operating business segments
- 9.4.5. Product portfolio
- 9.4.6. Business performance
- 9.4.7. Key strategic moves and developments
- 9.5. Decathlon SA
- 9.5.1. Company overview
- 9.5.2. Key executives
- 9.5.3. Company snapshot
- 9.5.4. Operating business segments
- 9.5.5. Product portfolio
- 9.5.6. Business performance
- 9.5.7. Key strategic moves and developments
- 9.6. EssilorLuxottica S.A.
- 9.6.1. Company overview
- 9.6.2. Key executives
- 9.6.3. Company snapshot
- 9.6.4. Operating business segments
- 9.6.5. Product portfolio
- 9.6.6. Business performance
- 9.6.7. Key strategic moves and developments
- 9.7. Adidas AG
- 9.7.1. Company overview
- 9.7.2. Key executives
- 9.7.3. Company snapshot
- 9.7.4. Operating business segments
- 9.7.5. Product portfolio
- 9.7.6. Business performance
- 9.8. Yiwu Conchen Glasses Co.,Ltd
- 9.8.1. Company overview
- 9.8.2. Key executives
- 9.8.3. Company snapshot
- 9.8.4. Operating business segments
- 9.8.5. Product portfolio
- 9.9. Safilo S.p.A.
- 9.9.1. Company overview
- 9.9.2. Key executives
- 9.9.3. Company snapshot
- 9.9.4. Operating business segments
- 9.9.5. Product portfolio
- 9.9.6. Business performance
- 9.9.7. Key strategic moves and developments
- 9.10. Liberty Sport, Inc.
- 9.10.1. Company overview
- 9.10.2. Key executives
- 9.10.3. Company snapshot
- 9.10.4. Operating business segments
- 9.10.5. Product portfolio
- 9.10.6. Key strategic moves and developments