 |
市場調査レポート
商品コード
1414832
ハイブリッド電気自動車の世界市場:パワートレイン別、ハイブリッド化度別、車両タイプ別:機会分析と産業予測(2023年~2032年)Hybrid Electric Car Market By Powertrain, By Degree of Hybridization, By Vehicle Type : Global Opportunity Analysis and Industry Forecast, 2023-2032 |
||||||

| ハイブリッド電気自動車の世界市場:パワートレイン別、ハイブリッド化度別、車両タイプ別:機会分析と産業予測(2023年~2032年) |
|
出版日: 2023年11月30日
発行: Allied Market Research
ページ情報: 英文 284 Pages
納期: 2~3営業日
|
- 全表示
- 概要
- 図表
- 目次
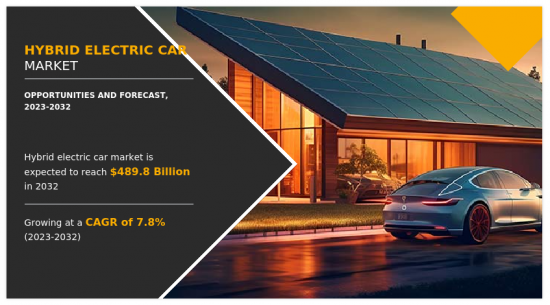
世界のハイブリッド電気自動車の市場規模は、排出ガス規制の強化と効率的な輸送に対する需要の増加により、2023年~2032年に7.8%の大幅な成長率が見込まれています。
従来の内燃エンジン車からの排出ガス削減に向けた政府の規則や規制の強化は、ハイブリッド電気自動車に対する消費者の需要を積極的に後押ししています。ハイブリッド電気自動車は2つの燃料源を使用するため、排ガス規制がより厳しい地域では電気走行に切り替えることができます。同様に、必要に応じて燃料車に切り替えることもできます。例えば、2020年4月、インドではBS6基準が導入されました。BS6基準は、自動車、特にディーゼルやガソリンを燃料とする自動車から排出される汚染物質の許容レベルを概説するものです。さらに同国は、古い商用車は15年後に再登録する必要があり、不適格と判断された場合は廃車にするという廃車政策を導入しました。このような政府による排ガス規制の強化は、ハイブリッド電気自動車の需要にプラスの影響を与えています。
同様に、近年、化石燃料の価格上昇により、人々の関心は従来の内燃機関から電気自動車やハイブリッド車へと大きくシフトしています。原油価格高騰の主な原因は、原油埋蔵量の枯渇と燃料価格の上昇に関連しており、これらは主にOPEC諸国によってコントロールされています。燃料価格の上昇により、消費者はハイブリッド電気自動車のような代替燃料の選択肢を模索しています。このように、化石燃料価格の上昇は、同市場で事業を展開する企業に成長機会をもたらすと予想されます。
目次
第1章 イントロダクション
第2章 エグゼクティブサマリー
第3章 市場概要
- 市場の定義と範囲
- 主な調査結果
- 影響要因
- 主な投資機会
- ポーターのファイブフォース分析
- 市場力学
- 促進要因
- 効率的な輸送に対する需要の増加
- 排ガス規制の強化
- 研究開発活動の増加
- 抑制要因
- 電気自動車への動向の高まり
- 機会
- ハイブリッド車需要の増加による、保守・アフターサービスに有利な成長機会の創出
- 化石燃料価格の上昇
- 促進要因
第4章 ハイブリッド電気自動車市場:パワートレイン別
- 概要
- シリーズハイブリッド
- パラレル・ハイブリッド
- 複合ハイブリッド
第5章 ハイブリッド電気自動車市場:ハイブリッド化度別
- 概要
- フルハイブリッド
- マイルドハイブリッド
第6章 ハイブリッド電気自動車市場:車両タイプ別
- 概要
- スタンダードハイブリッド
- ラグジュアリーハイブリッド
- パフォーマンスハイブリッド
第7章 ハイブリッド車市場:地域別
- 概要
- 北米
- 米国
- カナダ
- メキシコ
- 欧州
- ドイツ
- フランス
- 英国
- ロシア
- その他
- アジア太平洋
- 中国
- インド
- 日本
- オーストラリア
- その他
- ラテンアメリカ・中東・アフリカ
- ラテンアメリカ
- 中東
- アフリカ
第8章 競合情勢
- イントロダクション
- 主要成功戦略
- 主要10社の製品マッピング
- 競合ダッシュボード
- 競合ヒートマップ
- 主要企業のポジショニング(2022年)
第9章 企業プロファイル
- Toyota Motor Corporation
- Honda Motor Co., Ltd.
- Mercedes-Benz Group AG(former Daimler AG)
- BMW AG
- Ford Motor Company
- Hyundai Motor Company
- Volkswagen Group
- Kia Corporation
- Nissan Motor Co., Ltd.
- AB Volvo
LIST OF TABLES
- TABLE 01. GLOBAL HYBRID ELECTRIC CAR MARKET, BY POWERTRAIN, 2022-2032 ($MILLION)
- TABLE 02. HYBRID ELECTRIC CAR MARKET FOR SERIES HYBRID, BY REGION, 2022-2032 ($MILLION)
- TABLE 03. HYBRID ELECTRIC CAR MARKET FOR PARALLEL HYBRID, BY REGION, 2022-2032 ($MILLION)
- TABLE 04. HYBRID ELECTRIC CAR MARKET FOR COMBINED HYBRID, BY REGION, 2022-2032 ($MILLION)
- TABLE 05. GLOBAL HYBRID ELECTRIC CAR MARKET, BY DEGREE OF HYBRIDIZATION, 2022-2032 ($MILLION)
- TABLE 06. HYBRID ELECTRIC CAR MARKET FOR FULLY HYBRID, BY REGION, 2022-2032 ($MILLION)
- TABLE 07. HYBRID ELECTRIC CAR MARKET FOR MILD HYBRID, BY REGION, 2022-2032 ($MILLION)
- TABLE 08. GLOBAL HYBRID ELECTRIC CAR MARKET, BY VEHICLE TYPE, 2022-2032 ($MILLION)
- TABLE 09. HYBRID ELECTRIC CAR MARKET FOR STANDARD HYBRIDS, BY REGION, 2022-2032 ($MILLION)
- TABLE 10. HYBRID ELECTRIC CAR MARKET FOR LUXURY HYBRID, BY REGION, 2022-2032 ($MILLION)
- TABLE 11. HYBRID ELECTRIC CAR MARKET FOR PERFORMANCE HYBRID, BY REGION, 2022-2032 ($MILLION)
- TABLE 12. HYBRID ELECTRIC CAR MARKET, BY REGION, 2022-2032 ($MILLION)
- TABLE 13. NORTH AMERICA HYBRID ELECTRIC CAR MARKET, BY POWERTRAIN, 2022-2032 ($MILLION)
- TABLE 14. NORTH AMERICA HYBRID ELECTRIC CAR MARKET, BY DEGREE OF HYBRIDIZATION, 2022-2032 ($MILLION)
- TABLE 15. NORTH AMERICA HYBRID ELECTRIC CAR MARKET, BY VEHICLE TYPE, 2022-2032 ($MILLION)
- TABLE 16. NORTH AMERICA HYBRID ELECTRIC CAR MARKET, BY COUNTRY, 2022-2032 ($MILLION)
- TABLE 17. U.S. HYBRID ELECTRIC CAR MARKET, BY POWERTRAIN, 2022-2032 ($MILLION)
- TABLE 18. U.S. HYBRID ELECTRIC CAR MARKET, BY DEGREE OF HYBRIDIZATION, 2022-2032 ($MILLION)
- TABLE 19. U.S. HYBRID ELECTRIC CAR MARKET, BY VEHICLE TYPE, 2022-2032 ($MILLION)
- TABLE 20. CANADA HYBRID ELECTRIC CAR MARKET, BY POWERTRAIN, 2022-2032 ($MILLION)
- TABLE 21. CANADA HYBRID ELECTRIC CAR MARKET, BY DEGREE OF HYBRIDIZATION, 2022-2032 ($MILLION)
- TABLE 22. CANADA HYBRID ELECTRIC CAR MARKET, BY VEHICLE TYPE, 2022-2032 ($MILLION)
- TABLE 23. MEXICO HYBRID ELECTRIC CAR MARKET, BY POWERTRAIN, 2022-2032 ($MILLION)
- TABLE 24. MEXICO HYBRID ELECTRIC CAR MARKET, BY DEGREE OF HYBRIDIZATION, 2022-2032 ($MILLION)
- TABLE 25. MEXICO HYBRID ELECTRIC CAR MARKET, BY VEHICLE TYPE, 2022-2032 ($MILLION)
- TABLE 26. EUROPE HYBRID ELECTRIC CAR MARKET, BY POWERTRAIN, 2022-2032 ($MILLION)
- TABLE 27. EUROPE HYBRID ELECTRIC CAR MARKET, BY DEGREE OF HYBRIDIZATION, 2022-2032 ($MILLION)
- TABLE 28. EUROPE HYBRID ELECTRIC CAR MARKET, BY VEHICLE TYPE, 2022-2032 ($MILLION)
- TABLE 29. EUROPE HYBRID ELECTRIC CAR MARKET, BY COUNTRY, 2022-2032 ($MILLION)
- TABLE 30. GERMANY HYBRID ELECTRIC CAR MARKET, BY POWERTRAIN, 2022-2032 ($MILLION)
- TABLE 31. GERMANY HYBRID ELECTRIC CAR MARKET, BY DEGREE OF HYBRIDIZATION, 2022-2032 ($MILLION)
- TABLE 32. GERMANY HYBRID ELECTRIC CAR MARKET, BY VEHICLE TYPE, 2022-2032 ($MILLION)
- TABLE 33. FRANCE HYBRID ELECTRIC CAR MARKET, BY POWERTRAIN, 2022-2032 ($MILLION)
- TABLE 34. FRANCE HYBRID ELECTRIC CAR MARKET, BY DEGREE OF HYBRIDIZATION, 2022-2032 ($MILLION)
- TABLE 35. FRANCE HYBRID ELECTRIC CAR MARKET, BY VEHICLE TYPE, 2022-2032 ($MILLION)
- TABLE 36. UK HYBRID ELECTRIC CAR MARKET, BY POWERTRAIN, 2022-2032 ($MILLION)
- TABLE 37. UK HYBRID ELECTRIC CAR MARKET, BY DEGREE OF HYBRIDIZATION, 2022-2032 ($MILLION)
- TABLE 38. UK HYBRID ELECTRIC CAR MARKET, BY VEHICLE TYPE, 2022-2032 ($MILLION)
- TABLE 39. RUSSIA HYBRID ELECTRIC CAR MARKET, BY POWERTRAIN, 2022-2032 ($MILLION)
- TABLE 40. RUSSIA HYBRID ELECTRIC CAR MARKET, BY DEGREE OF HYBRIDIZATION, 2022-2032 ($MILLION)
- TABLE 41. RUSSIA HYBRID ELECTRIC CAR MARKET, BY VEHICLE TYPE, 2022-2032 ($MILLION)
- TABLE 42. REST OF EUROPE HYBRID ELECTRIC CAR MARKET, BY POWERTRAIN, 2022-2032 ($MILLION)
- TABLE 43. REST OF EUROPE HYBRID ELECTRIC CAR MARKET, BY DEGREE OF HYBRIDIZATION, 2022-2032 ($MILLION)
- TABLE 44. REST OF EUROPE HYBRID ELECTRIC CAR MARKET, BY VEHICLE TYPE, 2022-2032 ($MILLION)
- TABLE 45. ASIA-PACIFIC HYBRID ELECTRIC CAR MARKET, BY POWERTRAIN, 2022-2032 ($MILLION)
- TABLE 46. ASIA-PACIFIC HYBRID ELECTRIC CAR MARKET, BY DEGREE OF HYBRIDIZATION, 2022-2032 ($MILLION)
- TABLE 47. ASIA-PACIFIC HYBRID ELECTRIC CAR MARKET, BY VEHICLE TYPE, 2022-2032 ($MILLION)
- TABLE 48. ASIA-PACIFIC HYBRID ELECTRIC CAR MARKET, BY COUNTRY, 2022-2032 ($MILLION)
- TABLE 49. CHINA HYBRID ELECTRIC CAR MARKET, BY POWERTRAIN, 2022-2032 ($MILLION)
- TABLE 50. CHINA HYBRID ELECTRIC CAR MARKET, BY DEGREE OF HYBRIDIZATION, 2022-2032 ($MILLION)
- TABLE 51. CHINA HYBRID ELECTRIC CAR MARKET, BY VEHICLE TYPE, 2022-2032 ($MILLION)
- TABLE 52. INDIA HYBRID ELECTRIC CAR MARKET, BY POWERTRAIN, 2022-2032 ($MILLION)
- TABLE 53. INDIA HYBRID ELECTRIC CAR MARKET, BY DEGREE OF HYBRIDIZATION, 2022-2032 ($MILLION)
- TABLE 54. INDIA HYBRID ELECTRIC CAR MARKET, BY VEHICLE TYPE, 2022-2032 ($MILLION)
- TABLE 55. JAPAN HYBRID ELECTRIC CAR MARKET, BY POWERTRAIN, 2022-2032 ($MILLION)
- TABLE 56. JAPAN HYBRID ELECTRIC CAR MARKET, BY DEGREE OF HYBRIDIZATION, 2022-2032 ($MILLION)
- TABLE 57. JAPAN HYBRID ELECTRIC CAR MARKET, BY VEHICLE TYPE, 2022-2032 ($MILLION)
- TABLE 58. AUSTRALIA HYBRID ELECTRIC CAR MARKET, BY POWERTRAIN, 2022-2032 ($MILLION)
- TABLE 59. AUSTRALIA HYBRID ELECTRIC CAR MARKET, BY DEGREE OF HYBRIDIZATION, 2022-2032 ($MILLION)
- TABLE 60. AUSTRALIA HYBRID ELECTRIC CAR MARKET, BY VEHICLE TYPE, 2022-2032 ($MILLION)
- TABLE 61. REST OF ASIA-PACIFIC HYBRID ELECTRIC CAR MARKET, BY POWERTRAIN, 2022-2032 ($MILLION)
- TABLE 62. REST OF ASIA-PACIFIC HYBRID ELECTRIC CAR MARKET, BY DEGREE OF HYBRIDIZATION, 2022-2032 ($MILLION)
- TABLE 63. REST OF ASIA-PACIFIC HYBRID ELECTRIC CAR MARKET, BY VEHICLE TYPE, 2022-2032 ($MILLION)
- TABLE 64. LAMEA HYBRID ELECTRIC CAR MARKET, BY POWERTRAIN, 2022-2032 ($MILLION)
- TABLE 65. LAMEA HYBRID ELECTRIC CAR MARKET, BY DEGREE OF HYBRIDIZATION, 2022-2032 ($MILLION)
- TABLE 66. LAMEA HYBRID ELECTRIC CAR MARKET, BY VEHICLE TYPE, 2022-2032 ($MILLION)
- TABLE 67. LAMEA HYBRID ELECTRIC CAR MARKET, BY COUNTRY, 2022-2032 ($MILLION)
- TABLE 68. LATIN AMERICA HYBRID ELECTRIC CAR MARKET, BY POWERTRAIN, 2022-2032 ($MILLION)
- TABLE 69. LATIN AMERICA HYBRID ELECTRIC CAR MARKET, BY DEGREE OF HYBRIDIZATION, 2022-2032 ($MILLION)
- TABLE 70. LATIN AMERICA HYBRID ELECTRIC CAR MARKET, BY VEHICLE TYPE, 2022-2032 ($MILLION)
- TABLE 71. MIDDLE EAST HYBRID ELECTRIC CAR MARKET, BY POWERTRAIN, 2022-2032 ($MILLION)
- TABLE 72. MIDDLE EAST HYBRID ELECTRIC CAR MARKET, BY DEGREE OF HYBRIDIZATION, 2022-2032 ($MILLION)
- TABLE 73. MIDDLE EAST HYBRID ELECTRIC CAR MARKET, BY VEHICLE TYPE, 2022-2032 ($MILLION)
- TABLE 74. AFRICA HYBRID ELECTRIC CAR MARKET, BY POWERTRAIN, 2022-2032 ($MILLION)
- TABLE 75. AFRICA HYBRID ELECTRIC CAR MARKET, BY DEGREE OF HYBRIDIZATION, 2022-2032 ($MILLION)
- TABLE 76. AFRICA HYBRID ELECTRIC CAR MARKET, BY VEHICLE TYPE, 2022-2032 ($MILLION)
- TABLE 77. TOYOTA MOTOR CORPORATION: KEY EXECUTIVES
- TABLE 78. TOYOTA MOTOR CORPORATION: COMPANY SNAPSHOT
- TABLE 79. TOYOTA MOTOR CORPORATION: PRODUCT SEGMENTS
- TABLE 80. TOYOTA MOTOR CORPORATION: SERVICE SEGMENTS
- TABLE 81. TOYOTA MOTOR CORPORATION: PRODUCT PORTFOLIO
- TABLE 82. TOYOTA MOTOR CORPORATION: KEY STRATERGIES
- TABLE 83. HONDA MOTOR CO., LTD.: KEY EXECUTIVES
- TABLE 84. HONDA MOTOR CO., LTD.: COMPANY SNAPSHOT
- TABLE 85. HONDA MOTOR CO., LTD.: PRODUCT SEGMENTS
- TABLE 86. HONDA MOTOR CO., LTD.: PRODUCT PORTFOLIO
- TABLE 87. HONDA MOTOR CO., LTD.: KEY STRATERGIES
- TABLE 88. MERCEDES-BENZ GROUP AG (FORMER DAIMLER AG): KEY EXECUTIVES
- TABLE 89. MERCEDES-BENZ GROUP AG (FORMER DAIMLER AG): COMPANY SNAPSHOT
- TABLE 90. MERCEDES-BENZ GROUP AG (FORMER DAIMLER AG): PRODUCT SEGMENTS
- TABLE 91. MERCEDES-BENZ GROUP AG (FORMER DAIMLER AG): PRODUCT PORTFOLIO
- TABLE 92. BMW AG: KEY EXECUTIVES
- TABLE 93. BMW AG: COMPANY SNAPSHOT
- TABLE 94. BMW AG: PRODUCT SEGMENTS
- TABLE 95. BMW AG: PRODUCT PORTFOLIO
- TABLE 96. FORD MOTOR COMPANY: KEY EXECUTIVES
- TABLE 97. FORD MOTOR COMPANY: COMPANY SNAPSHOT
- TABLE 98. FORD MOTOR COMPANY: PRODUCT SEGMENTS
- TABLE 99. FORD MOTOR COMPANY: PRODUCT PORTFOLIO
- TABLE 100. FORD MOTOR COMPANY: KEY STRATERGIES
- TABLE 101. HYUNDAI MOTOR COMPANY: KEY EXECUTIVES
- TABLE 102. HYUNDAI MOTOR COMPANY: COMPANY SNAPSHOT
- TABLE 103. HYUNDAI MOTOR COMPANY: PRODUCT SEGMENTS
- TABLE 104. HYUNDAI MOTOR COMPANY: PRODUCT PORTFOLIO
- TABLE 105. VOLKSWAGEN GROUP: KEY EXECUTIVES
- TABLE 106. VOLKSWAGEN GROUP: COMPANY SNAPSHOT
- TABLE 107. VOLKSWAGEN GROUP: PRODUCT SEGMENTS
- TABLE 108. VOLKSWAGEN GROUP: PRODUCT PORTFOLIO
- TABLE 109. KIA CORPORATION: KEY EXECUTIVES
- TABLE 110. KIA CORPORATION: COMPANY SNAPSHOT
- TABLE 111. KIA CORPORATION: PRODUCT SEGMENTS
- TABLE 112. KIA CORPORATION: PRODUCT PORTFOLIO
- TABLE 113. KIA CORPORATION: KEY STRATERGIES
- TABLE 114. NISSAN MOTOR CO., LTD.: KEY EXECUTIVES
- TABLE 115. NISSAN MOTOR CO., LTD.: COMPANY SNAPSHOT
- TABLE 116. NISSAN MOTOR CO., LTD.: PRODUCT SEGMENTS
- TABLE 117. NISSAN MOTOR CO., LTD.: PRODUCT PORTFOLIO
- TABLE 118. AB VOLVO: KEY EXECUTIVES
- TABLE 119. AB VOLVO: COMPANY SNAPSHOT
- TABLE 120. AB VOLVO: PRODUCT SEGMENTS
- TABLE 121. AB VOLVO: PRODUCT PORTFOLIO
- TABLE 122. AB VOLVO: KEY STRATERGIES
LIST OF FIGURES
- FIGURE 01. HYBRID ELECTRIC CAR MARKET, 2022-2032
- FIGURE 02. SEGMENTATION OF HYBRID ELECTRIC CAR MARKET,2022-2032
- FIGURE 03. TOP IMPACTING FACTORS IN HYBRID ELECTRIC CAR MARKET (2022 TO 2032)
- FIGURE 04. TOP INVESTMENT POCKETS IN HYBRID ELECTRIC CAR MARKET (2023-2032)
- FIGURE 05. MODERATE BARGAINING POWER OF SUPPLIERS
- FIGURE 06. HIGH THREAT OF NEW ENTRANTS
- FIGURE 07. MODERATE THREAT OF SUBSTITUTES
- FIGURE 08. HIGH INTENSITY OF RIVALRY
- FIGURE 09. MODERATE BARGAINING POWER OF BUYERS
- FIGURE 10. GLOBAL HYBRID ELECTRIC CAR MARKET:DRIVERS, RESTRAINTS AND OPPORTUNITIES
- FIGURE 11. HYBRID ELECTRIC CAR MARKET, BY POWERTRAIN, 2022 AND 2032(%)
- FIGURE 12. COMPARATIVE SHARE ANALYSIS OF HYBRID ELECTRIC CAR MARKET FOR SERIES HYBRID, BY COUNTRY 2022 AND 2032(%)
- FIGURE 13. COMPARATIVE SHARE ANALYSIS OF HYBRID ELECTRIC CAR MARKET FOR PARALLEL HYBRID, BY COUNTRY 2022 AND 2032(%)
- FIGURE 14. COMPARATIVE SHARE ANALYSIS OF HYBRID ELECTRIC CAR MARKET FOR COMBINED HYBRID, BY COUNTRY 2022 AND 2032(%)
- FIGURE 15. HYBRID ELECTRIC CAR MARKET, BY DEGREE OF HYBRIDIZATION, 2022 AND 2032(%)
- FIGURE 16. COMPARATIVE SHARE ANALYSIS OF HYBRID ELECTRIC CAR MARKET FOR FULLY HYBRID, BY COUNTRY 2022 AND 2032(%)
- FIGURE 17. COMPARATIVE SHARE ANALYSIS OF HYBRID ELECTRIC CAR MARKET FOR MILD HYBRID, BY COUNTRY 2022 AND 2032(%)
- FIGURE 18. HYBRID ELECTRIC CAR MARKET, BY VEHICLE TYPE, 2022 AND 2032(%)
- FIGURE 19. COMPARATIVE SHARE ANALYSIS OF HYBRID ELECTRIC CAR MARKET FOR STANDARD HYBRIDS, BY COUNTRY 2022 AND 2032(%)
- FIGURE 20. COMPARATIVE SHARE ANALYSIS OF HYBRID ELECTRIC CAR MARKET FOR LUXURY HYBRID, BY COUNTRY 2022 AND 2032(%)
- FIGURE 21. COMPARATIVE SHARE ANALYSIS OF HYBRID ELECTRIC CAR MARKET FOR PERFORMANCE HYBRID, BY COUNTRY 2022 AND 2032(%)
- FIGURE 22. HYBRID ELECTRIC CAR MARKET BY REGION, 2022 AND 2032(%)
- FIGURE 23. U.S. HYBRID ELECTRIC CAR MARKET, 2022-2032 ($MILLION)
- FIGURE 24. CANADA HYBRID ELECTRIC CAR MARKET, 2022-2032 ($MILLION)
- FIGURE 25. MEXICO HYBRID ELECTRIC CAR MARKET, 2022-2032 ($MILLION)
- FIGURE 26. GERMANY HYBRID ELECTRIC CAR MARKET, 2022-2032 ($MILLION)
- FIGURE 27. FRANCE HYBRID ELECTRIC CAR MARKET, 2022-2032 ($MILLION)
- FIGURE 28. UK HYBRID ELECTRIC CAR MARKET, 2022-2032 ($MILLION)
- FIGURE 29. RUSSIA HYBRID ELECTRIC CAR MARKET, 2022-2032 ($MILLION)
- FIGURE 30. REST OF EUROPE HYBRID ELECTRIC CAR MARKET, 2022-2032 ($MILLION)
- FIGURE 31. CHINA HYBRID ELECTRIC CAR MARKET, 2022-2032 ($MILLION)
- FIGURE 32. INDIA HYBRID ELECTRIC CAR MARKET, 2022-2032 ($MILLION)
- FIGURE 33. JAPAN HYBRID ELECTRIC CAR MARKET, 2022-2032 ($MILLION)
- FIGURE 34. AUSTRALIA HYBRID ELECTRIC CAR MARKET, 2022-2032 ($MILLION)
- FIGURE 35. REST OF ASIA-PACIFIC HYBRID ELECTRIC CAR MARKET, 2022-2032 ($MILLION)
- FIGURE 36. LATIN AMERICA HYBRID ELECTRIC CAR MARKET, 2022-2032 ($MILLION)
- FIGURE 37. MIDDLE EAST HYBRID ELECTRIC CAR MARKET, 2022-2032 ($MILLION)
- FIGURE 38. AFRICA HYBRID ELECTRIC CAR MARKET, 2022-2032 ($MILLION)
- FIGURE 39. TOP WINNING STRATEGIES, BY YEAR (2022-2023)
- FIGURE 40. TOP WINNING STRATEGIES, BY DEVELOPMENT (2022-2023)
- FIGURE 41. TOP WINNING STRATEGIES, BY COMPANY (2022-2023)
- FIGURE 42. PRODUCT MAPPING OF TOP 10 PLAYERS
- FIGURE 43. COMPETITIVE DASHBOARD
- FIGURE 44. COMPETITIVE HEATMAP: HYBRID ELECTRIC CAR MARKET
- FIGURE 45. TOP PLAYER POSITIONING, 2022
- FIGURE 46. TOYOTA MOTOR CORPORATION: RESEARCH & DEVELOPMENT EXPENDITURE, 2020-2022 ($MILLION)
- FIGURE 47. TOYOTA MOTOR CORPORATION: NET SALES, 2020-2022 ($MILLION)
- FIGURE 48. TOYOTA MOTOR CORPORATION: REVENUE SHARE BY SEGMENT, 2022 (%)
- FIGURE 49. TOYOTA MOTOR CORPORATION: REVENUE SHARE BY REGION, 2022 (%)
- FIGURE 50. HONDA MOTOR CO., LTD.: RESEARCH & DEVELOPMENT EXPENDITURE, 2020-2022 ($MILLION)
- FIGURE 51. HONDA MOTOR CO., LTD.: NET SALES, 2020-2022 ($MILLION)
- FIGURE 52. HONDA MOTOR CO., LTD.: REVENUE SHARE BY SEGMENT, 2022 (%)
- FIGURE 53. HONDA MOTOR CO., LTD.: REVENUE SHARE BY REGION, 2022 (%)
- FIGURE 54. MERCEDES-BENZ GROUP AG (FORMER DAIMLER AG): RESEARCH & DEVELOPMENT EXPENDITURE, 2020-2022 ($MILLION)
- FIGURE 55. MERCEDES-BENZ GROUP AG (FORMER DAIMLER AG): NET SALES, 2020-2022 ($MILLION)
- FIGURE 56. MERCEDES-BENZ GROUP AG (FORMER DAIMLER AG): REVENUE SHARE BY SEGMENT, 2022 (%)
- FIGURE 57. MERCEDES-BENZ GROUP AG (FORMER DAIMLER AG): REVENUE SHARE BY REGION, 2022 (%)
- FIGURE 58. BMW AG: NET REVENUE, 2020-2022 ($MILLION)
- FIGURE 59. BMW AG: RESEARCH & DEVELOPMENT EXPENDITURE, 2020-2022 ($MILLION)
- FIGURE 60. BMW AG: REVENUE SHARE BY REGION, 2022 (%)
- FIGURE 61. BMW AG: REVENUE SHARE BY SEGMENT, 2022 (%)
- FIGURE 62. FORD MOTOR COMPANY: NET SALES, 2020-2022 ($MILLION)
- FIGURE 63. FORD MOTOR COMPANY: REVENUE SHARE BY REGION, 2022 (%)
- FIGURE 64. FORD MOTOR COMPANY: REVENUE SHARE BY SEGMENT, 2022 (%)
- FIGURE 65. HYUNDAI MOTOR COMPANY: RESEARCH & DEVELOPMENT EXPENDITURE, 2020-2022 ($MILLION)
- FIGURE 66. HYUNDAI MOTOR COMPANY: NET REVENUE, 2020-2022 ($MILLION)
- FIGURE 67. HYUNDAI MOTOR COMPANY: REVENUE SHARE BY SEGMENT, 2022 (%)
- FIGURE 68. HYUNDAI MOTOR COMPANY: REVENUE SHARE BY REGION, 2021 (%)
- FIGURE 69. VOLKSWAGEN GROUP: RESEARCH & DEVELOPMENT EXPENDITURE, 2020-2022 ($MILLION)
- FIGURE 70. VOLKSWAGEN GROUP: NET SALES, 2020-2022 ($MILLION)
- FIGURE 71. VOLKSWAGEN GROUP: REVENUE SHARE BY SEGMENT, 2022 (%)
- FIGURE 72. VOLKSWAGEN GROUP: REVENUE SHARE BY REGION, 2022 (%)
- FIGURE 73. KIA CORPORATION: NET SALES, 2020-2022 ($MILLION)
- FIGURE 74. KIA CORPORATION: REVENUE SHARE BY REGION, 2022 (%)
- FIGURE 75. NISSAN MOTOR CO., LTD.: NET SALES, 2020-2022 ($MILLION)
- FIGURE 76. NISSAN MOTOR CO., LTD.: REVENUE SHARE BY SEGMENT, 2022 (%)
- FIGURE 77. NISSAN MOTOR CO., LTD.: REVENUE SHARE BY REGION, 2022 (%)
- FIGURE 78. AB VOLVO: RESEARCH & DEVELOPMENT EXPENDITURE, 2020-2022 ($MILLION)
- FIGURE 79. AB VOLVO: NET SALES, 2020-2022 ($MILLION)
- FIGURE 80. AB VOLVO: REVENUE SHARE BY REGION, 2022 (%)
- FIGURE 81. AB VOLVO: REVENUE SHARE BY REGION, 2022 (%)
The hybrid electric car market is expected to experience a significant growth rate of 7.8% from 2023-2032 due to strengthening emission norms and increasing demand for efficient transportation- Allied Market Research
The strengthening of government rules and regulations toward reducing emissions from traditional internal combustion engine vehicles positively drives the consumer demand toward hybrid electric cars. As hybrid electric cars use two fuel sources, they can be switched to drive on electricity in areas where emission norms are stricter. Similarly, the vehicle can be shifted for use as fuel-powered when required. For instance, in April 2020, India Introduced BS6 norms, which outline a permissible level of pollutants from a vehicle, especially from a vehicle using diesel and petrol as fuel. In addition, the country introduced a vehicle scrapping policy that outlines that older commercial vehicles need to be re-registered after 15 years; if the vehicles are found unfit, they are expected to be scrapped. Rise in such strengthening emissions norms by the government positively affect the demand for hybrid electric cars.
Likewise, In recent year the increasing prices of fossil fuel has led to a major shift of people's focus from conventional internal combustion engines towards electric and hybrid vehicles. The major reason for the growth of crude oil price hikes can be linked to the depletion of crude oil reserves and increasing fuel prices, which are majorly controlled by OPEC countries, it is anticipated that the prices of crude oil will keep increasing in the future due to various factors. The increase in fuel prices has led consumers to explore alternative fuel options such as hybrid electric cars. Thus, the rising price of fossil fuel is anticipated to create growth opportunities for companies operating in the market.
In addition, a rise in income level among consumers globally, along with technological advancement in hybrid vehicle technology, is anticipated to increase the demand for hybrid electric cars during the forecast period. To support the demand for fuel-efficient mid-level hybrid electric cars, companies around the world are developing technologies to cut down the cost of production.
Russia-Ukraine war impact
The conflict has disrupted supply chains, especially for components and materials sourced from Ukraine and Russia. This can result in delays and increased costs for hybrid electric car manufacturers, as they may struggle to obtain critical parts or materials required for production. Economic uncertainty, trade disruptions, and geopolitical tensions can lead to reduced economic growth in the affected regions. This can result in a decrease in demand for new hybrid electric vehicles.
However, these challenges can drive innovation and adaptation in the hybrid electric car industry. Manufacturers may develop more resilient and versatile cars, and consumers may invest in the technology.
The hybrid electric car market is segmented on the basis of powertrain, degree of hybridization, and vehicle type. By powertrain, the market is segmented into series hybrid, parallel hybrid, and combined hybrid. On the basis of degree of hybridization, the market is fragmented into fully hybrid, and mild hybrid. By vehicle type, the market is divided into standard hybrids, luxury hybrids, and performance hybrids. Region-wise, the hybrid electric car market is analyzed across North America, Europe, Asia-Pacific, and LAMEA.
The Key players operating in the market are: TOYOTA MOTOR CORPORATION, Honda Motor Co., Ltd, Mercedes-Benz Group AG (Former Daimler AG), BMW AG, Ford Motor Company, Hyundai Motor Company, Volkswagen Group, Kia Corporation, Nissan Motor Co., Ltd., and AB Volvo.
Key Benefits For Stakeholders
- This report provides a quantitative analysis of the market segments, current trends, estimations, and dynamics of the hybrid electric car market analysis from 2022 to 2032 to identify the prevailing hybrid electric car market opportunities.
- The market research is offered along with information related to key drivers, restraints, and opportunities.
- Porter's five forces analysis highlights the potency of buyers and suppliers to enable stakeholders make profit-oriented business decisions and strengthen their supplier-buyer network.
- In-depth analysis of the hybrid electric car market segmentation assists to determine the prevailing market opportunities.
- Major countries in each region are mapped according to their revenue contribution to the global market.
- Market player positioning facilitates benchmarking and provides a clear understanding of the present position of the market players.
- The report includes the analysis of the regional as well as global hybrid electric car market trends, key players, market segments, application areas, and market growth strategies.
Additional benefits you will get with this purchase are:
- Quarterly Update and* (only available with a corporate license, on listed price)
- 5 additional Company Profile of client Choice pre- or Post-purchase, as a free update.
- Free Upcoming Version on the Purchase of Five and Enterprise User License.
- 16 analyst hours of support* (post-purchase, if you find additional data requirements upon review of the report, you may receive support amounting to 16 analyst hours to solve questions, and post-sale queries)
- 15% Free Customization* (in case the scope or segment of the report does not match your requirements, 15% is equivalent to 3 working days of free work, applicable once)
- Free data Pack on the Five and Enterprise User License. (Excel version of the report)
- Free Updated report if the report is 6-12 months old or older.
- 24-hour priority response*
- Free Industry updates and white papers.
Possible Customization with this report (with additional cost and timeline, please talk to the sales executive to know more)
- Upcoming/New Entrant by Regions
- New Product Development/ Product Matrix of Key Players
- Brands Share Analysis
- SWOT Analysis
Key Market Segments
By Degree of Hybridization
- Fully Hybrid
- Mild Hybrid
By Vehicle Type
- Standard Hybrids
- Luxury Hybrid
- Performance Hybrid
By Powertrain
- Series Hybrid
- Parallel Hybrid
- Combined Hybrid
By Region
- North America
- U.S.
- Canada
- Mexico
- Europe
- Germany
- France
- UK
- Russia
- Rest of Europe
- Asia-Pacific
- China
- India
- Japan
- Australia
- Rest of Asia-Pacific
- LAMEA
- Latin America
- Middle East
- Africa
Key Market Players:
- Honda Motor Co., Ltd.
- Mercedes-Benz Group AG (former Daimler AG)
- BMW AG
- Hyundai Motor Company
- Kia Corporation
- Nissan Motor Co., Ltd.
- Toyota Motor Corporation
- Ford Motor Company
- Volkswagen Group
- AB Volvo
TABLE OF CONTENTS
CHAPTER 1: INTRODUCTION
- 1.1. Report description
- 1.2. Key market segments
- 1.3. Key benefits to the stakeholders
- 1.4. Research methodology
- 1.4.1. Primary research
- 1.4.2. Secondary research
- 1.4.3. Analyst tools and models
CHAPTER 2: EXECUTIVE SUMMARY
- 2.1. CXO Perspective
CHAPTER 3: MARKET OVERVIEW
- 3.1. Market definition and scope
- 3.2. Key findings
- 3.2.1. Top impacting factors
- 3.2.2. Top investment pockets
- 3.3. Porter's five forces analysis
- 3.3.1. Moderate bargaining power of suppliers
- 3.3.2. High threat of new entrants
- 3.3.3. Moderate threat of substitutes
- 3.3.4. High intensity of rivalry
- 3.3.5. Moderate bargaining power of buyers
- 3.4. Market dynamics
- 3.4.1. Drivers
- 3.4.1.1. Increase in demand for efficient transportation
- 3.4.1.2. Strengthening emission norms
- 3.4.1.3. Increase in R&D activities
- 3.4.2. Restraints
- 3.4.2.1. Increase in trend towards electric vehicles
- 3.4.3. Opportunities
- 3.4.3.1. Increase in demand for hybrids to create lucrative growth opportunities for maintenance and aftersales services
- 3.4.3.2. Increase in price of fossil fuel
- 3.4.1. Drivers
CHAPTER 4: HYBRID ELECTRIC CAR MARKET, BY POWERTRAIN
- 4.1. Overview
- 4.1.1. Market size and forecast
- 4.2. Series Hybrid
- 4.2.1. Key market trends, growth factors and opportunities
- 4.2.2. Market size and forecast, by region
- 4.2.3. Market share analysis by country
- 4.3. Parallel Hybrid
- 4.3.1. Key market trends, growth factors and opportunities
- 4.3.2. Market size and forecast, by region
- 4.3.3. Market share analysis by country
- 4.4. Combined Hybrid
- 4.4.1. Key market trends, growth factors and opportunities
- 4.4.2. Market size and forecast, by region
- 4.4.3. Market share analysis by country
CHAPTER 5: HYBRID ELECTRIC CAR MARKET, BY DEGREE OF HYBRIDIZATION
- 5.1. Overview
- 5.1.1. Market size and forecast
- 5.2. Fully Hybrid
- 5.2.1. Key market trends, growth factors and opportunities
- 5.2.2. Market size and forecast, by region
- 5.2.3. Market share analysis by country
- 5.3. Mild Hybrid
- 5.3.1. Key market trends, growth factors and opportunities
- 5.3.2. Market size and forecast, by region
- 5.3.3. Market share analysis by country
CHAPTER 6: HYBRID ELECTRIC CAR MARKET, BY VEHICLE TYPE
- 6.1. Overview
- 6.1.1. Market size and forecast
- 6.2. Standard Hybrids
- 6.2.1. Key market trends, growth factors and opportunities
- 6.2.2. Market size and forecast, by region
- 6.2.3. Market share analysis by country
- 6.3. Luxury Hybrid
- 6.3.1. Key market trends, growth factors and opportunities
- 6.3.2. Market size and forecast, by region
- 6.3.3. Market share analysis by country
- 6.4. Performance Hybrid
- 6.4.1. Key market trends, growth factors and opportunities
- 6.4.2. Market size and forecast, by region
- 6.4.3. Market share analysis by country
CHAPTER 7: HYBRID ELECTRIC CAR MARKET, BY REGION
- 7.1. Overview
- 7.1.1. Market size and forecast By Region
- 7.2. North America
- 7.2.1. Key market trends, growth factors and opportunities
- 7.2.2. Market size and forecast, by Powertrain
- 7.2.3. Market size and forecast, by Degree of Hybridization
- 7.2.4. Market size and forecast, by Vehicle Type
- 7.2.5. Market size and forecast, by country
- 7.2.5.1. U.S.
- 7.2.5.1.1. Market size and forecast, by Powertrain
- 7.2.5.1.2. Market size and forecast, by Degree of Hybridization
- 7.2.5.1.3. Market size and forecast, by Vehicle Type
- 7.2.5.2. Canada
- 7.2.5.2.1. Market size and forecast, by Powertrain
- 7.2.5.2.2. Market size and forecast, by Degree of Hybridization
- 7.2.5.2.3. Market size and forecast, by Vehicle Type
- 7.2.5.3. Mexico
- 7.2.5.3.1. Market size and forecast, by Powertrain
- 7.2.5.3.2. Market size and forecast, by Degree of Hybridization
- 7.2.5.3.3. Market size and forecast, by Vehicle Type
- 7.3. Europe
- 7.3.1. Key market trends, growth factors and opportunities
- 7.3.2. Market size and forecast, by Powertrain
- 7.3.3. Market size and forecast, by Degree of Hybridization
- 7.3.4. Market size and forecast, by Vehicle Type
- 7.3.5. Market size and forecast, by country
- 7.3.5.1. Germany
- 7.3.5.1.1. Market size and forecast, by Powertrain
- 7.3.5.1.2. Market size and forecast, by Degree of Hybridization
- 7.3.5.1.3. Market size and forecast, by Vehicle Type
- 7.3.5.2. France
- 7.3.5.2.1. Market size and forecast, by Powertrain
- 7.3.5.2.2. Market size and forecast, by Degree of Hybridization
- 7.3.5.2.3. Market size and forecast, by Vehicle Type
- 7.3.5.3. UK
- 7.3.5.3.1. Market size and forecast, by Powertrain
- 7.3.5.3.2. Market size and forecast, by Degree of Hybridization
- 7.3.5.3.3. Market size and forecast, by Vehicle Type
- 7.3.5.4. Russia
- 7.3.5.4.1. Market size and forecast, by Powertrain
- 7.3.5.4.2. Market size and forecast, by Degree of Hybridization
- 7.3.5.4.3. Market size and forecast, by Vehicle Type
- 7.3.5.5. Rest of Europe
- 7.3.5.5.1. Market size and forecast, by Powertrain
- 7.3.5.5.2. Market size and forecast, by Degree of Hybridization
- 7.3.5.5.3. Market size and forecast, by Vehicle Type
- 7.4. Asia-Pacific
- 7.4.1. Key market trends, growth factors and opportunities
- 7.4.2. Market size and forecast, by Powertrain
- 7.4.3. Market size and forecast, by Degree of Hybridization
- 7.4.4. Market size and forecast, by Vehicle Type
- 7.4.5. Market size and forecast, by country
- 7.4.5.1. China
- 7.4.5.1.1. Market size and forecast, by Powertrain
- 7.4.5.1.2. Market size and forecast, by Degree of Hybridization
- 7.4.5.1.3. Market size and forecast, by Vehicle Type
- 7.4.5.2. India
- 7.4.5.2.1. Market size and forecast, by Powertrain
- 7.4.5.2.2. Market size and forecast, by Degree of Hybridization
- 7.4.5.2.3. Market size and forecast, by Vehicle Type
- 7.4.5.3. Japan
- 7.4.5.3.1. Market size and forecast, by Powertrain
- 7.4.5.3.2. Market size and forecast, by Degree of Hybridization
- 7.4.5.3.3. Market size and forecast, by Vehicle Type
- 7.4.5.4. Australia
- 7.4.5.4.1. Market size and forecast, by Powertrain
- 7.4.5.4.2. Market size and forecast, by Degree of Hybridization
- 7.4.5.4.3. Market size and forecast, by Vehicle Type
- 7.4.5.5. Rest of Asia-Pacific
- 7.4.5.5.1. Market size and forecast, by Powertrain
- 7.4.5.5.2. Market size and forecast, by Degree of Hybridization
- 7.4.5.5.3. Market size and forecast, by Vehicle Type
- 7.5. LAMEA
- 7.5.1. Key market trends, growth factors and opportunities
- 7.5.2. Market size and forecast, by Powertrain
- 7.5.3. Market size and forecast, by Degree of Hybridization
- 7.5.4. Market size and forecast, by Vehicle Type
- 7.5.5. Market size and forecast, by country
- 7.5.5.1. Latin America
- 7.5.5.1.1. Market size and forecast, by Powertrain
- 7.5.5.1.2. Market size and forecast, by Degree of Hybridization
- 7.5.5.1.3. Market size and forecast, by Vehicle Type
- 7.5.5.2. Middle East
- 7.5.5.2.1. Market size and forecast, by Powertrain
- 7.5.5.2.2. Market size and forecast, by Degree of Hybridization
- 7.5.5.2.3. Market size and forecast, by Vehicle Type
- 7.5.5.3. Africa
- 7.5.5.3.1. Market size and forecast, by Powertrain
- 7.5.5.3.2. Market size and forecast, by Degree of Hybridization
- 7.5.5.3.3. Market size and forecast, by Vehicle Type
CHAPTER 8: COMPETITIVE LANDSCAPE
- 8.1. Introduction
- 8.2. Top winning strategies
- 8.3. Product mapping of top 10 player
- 8.4. Competitive dashboard
- 8.5. Competitive heatmap
- 8.6. Top player positioning, 2022
CHAPTER 9: COMPANY PROFILES
- 9.1. Toyota Motor Corporation
- 9.1.1. Company overview
- 9.1.2. Key executives
- 9.1.3. Company snapshot
- 9.1.4. Operating business segments
- 9.1.5. Product portfolio
- 9.1.6. Business performance
- 9.1.7. Key strategic moves and developments
- 9.2. Honda Motor Co., Ltd.
- 9.2.1. Company overview
- 9.2.2. Key executives
- 9.2.3. Company snapshot
- 9.2.4. Operating business segments
- 9.2.5. Product portfolio
- 9.2.6. Business performance
- 9.2.7. Key strategic moves and developments
- 9.3. Mercedes-Benz Group AG (former Daimler AG)
- 9.3.1. Company overview
- 9.3.2. Key executives
- 9.3.3. Company snapshot
- 9.3.4. Operating business segments
- 9.3.5. Product portfolio
- 9.3.6. Business performance
- 9.4. BMW AG
- 9.4.1. Company overview
- 9.4.2. Key executives
- 9.4.3. Company snapshot
- 9.4.4. Operating business segments
- 9.4.5. Product portfolio
- 9.4.6. Business performance
- 9.5. Ford Motor Company
- 9.5.1. Company overview
- 9.5.2. Key executives
- 9.5.3. Company snapshot
- 9.5.4. Operating business segments
- 9.5.5. Product portfolio
- 9.5.6. Business performance
- 9.5.7. Key strategic moves and developments
- 9.6. Hyundai Motor Company
- 9.6.1. Company overview
- 9.6.2. Key executives
- 9.6.3. Company snapshot
- 9.6.4. Operating business segments
- 9.6.5. Product portfolio
- 9.6.6. Business performance
- 9.7. Volkswagen Group
- 9.7.1. Company overview
- 9.7.2. Key executives
- 9.7.3. Company snapshot
- 9.7.4. Operating business segments
- 9.7.5. Product portfolio
- 9.7.6. Business performance
- 9.8. Kia Corporation
- 9.8.1. Company overview
- 9.8.2. Key executives
- 9.8.3. Company snapshot
- 9.8.4. Operating business segments
- 9.8.5. Product portfolio
- 9.8.6. Business performance
- 9.8.7. Key strategic moves and developments
- 9.9. Nissan Motor Co., Ltd.
- 9.9.1. Company overview
- 9.9.2. Key executives
- 9.9.3. Company snapshot
- 9.9.4. Operating business segments
- 9.9.5. Product portfolio
- 9.9.6. Business performance
- 9.10. AB Volvo
- 9.10.1. Company overview
- 9.10.2. Key executives
- 9.10.3. Company snapshot
- 9.10.4. Operating business segments
- 9.10.5. Product portfolio
- 9.10.6. Business performance
- 9.10.7. Key strategic moves and developments